
Please be aware that this blog post uses the discontinued libbcc-based API in hello-ebpf.
Welcome back to my blog series on eBPF. Last week, I showed you how the eBPF program and Java application can communicate using eBPF maps. This allowed us to write an application that counts the number of execve calls per user.
This week, I’ll show you briefly how to use another kind of eBPF maps, the perf event buffer, and run tests with docker and JUnit 5.
This blog post is shorter than the previous one as I’m preparing for the OpenJDK committers workshop in Brussels and my Python and Java DevRoom talks at FOSDEM. I’m happy to meet my readers; say hi when you’re there.
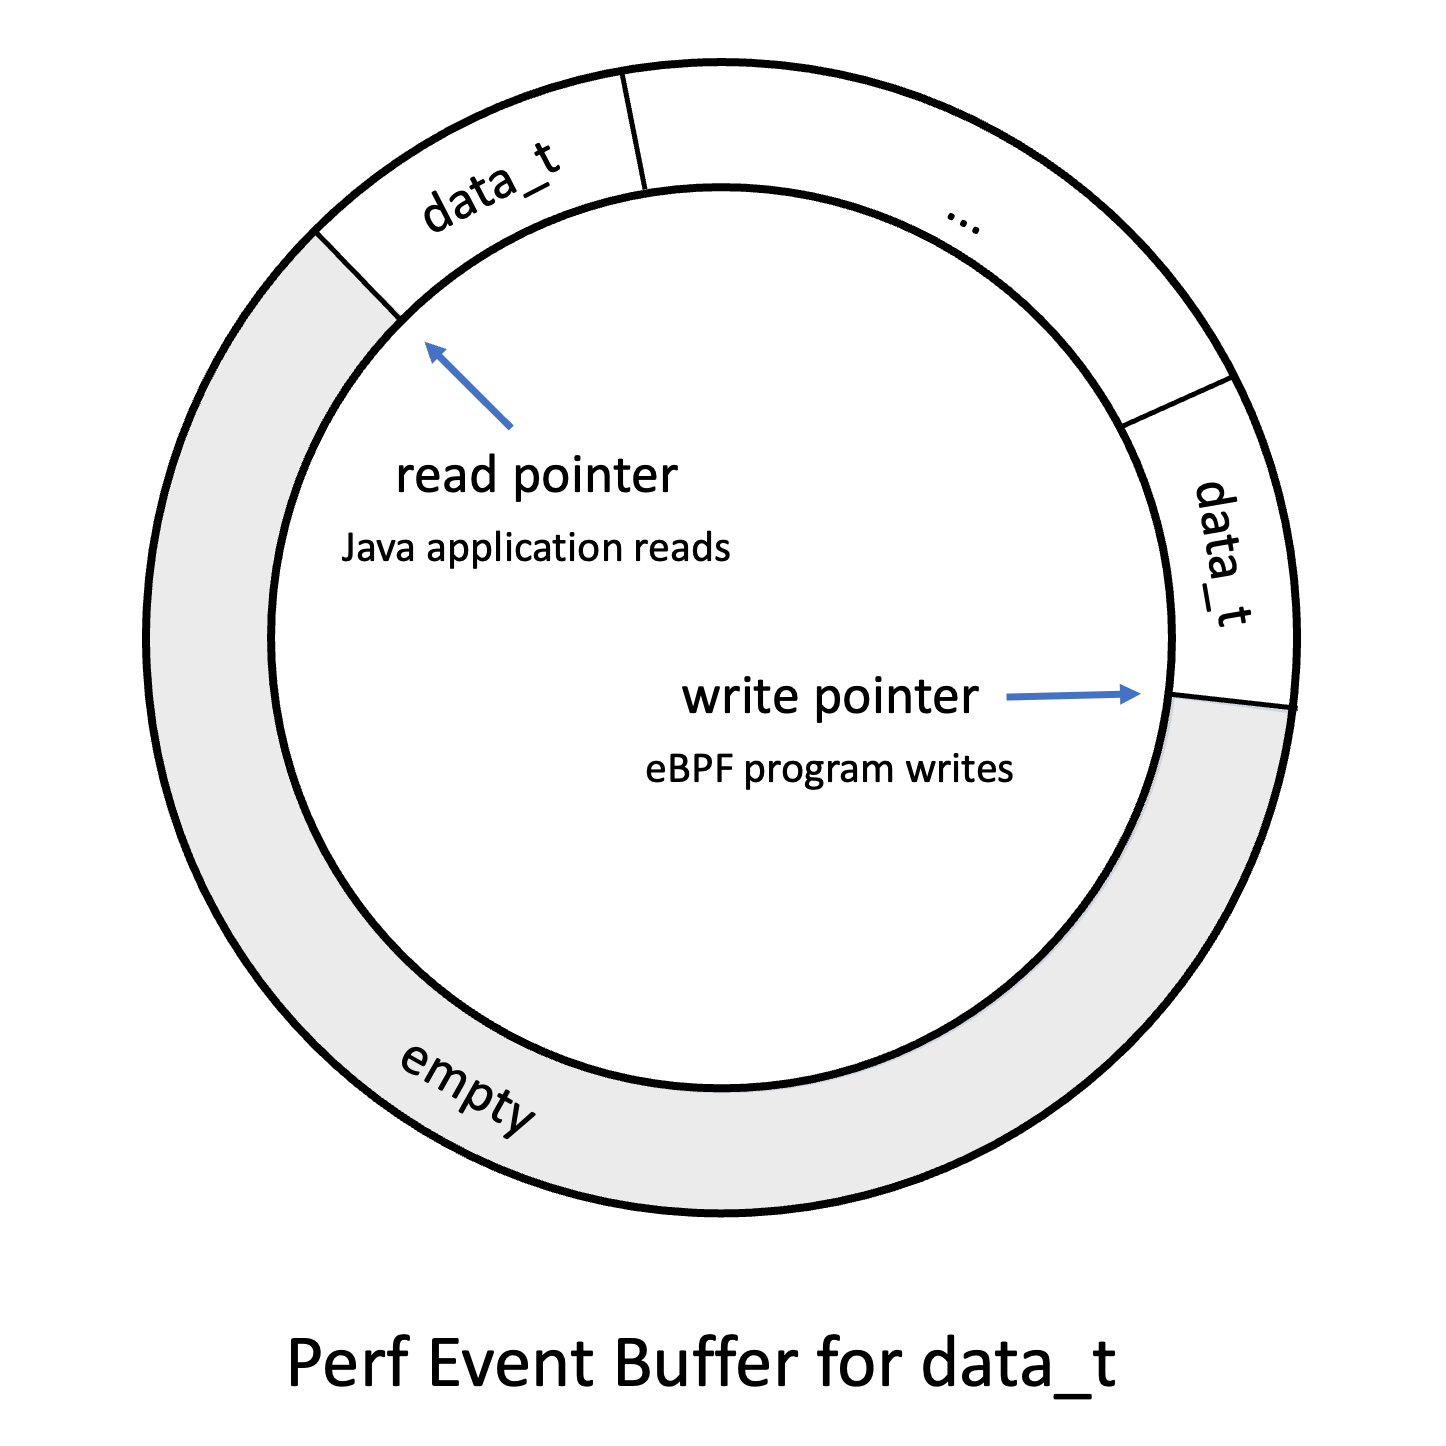
Perf Event Buffer
Data structures, like the hash map described in the previous blog post, are great for storing data but have their limitation when we want to pass new bits of information continuously from the eBPF program to our user-land application. This is especially pertinent when recording performance events. So, in 2015, the Linux kernel got a new map type: BPF_MAP_TYPE_PERF_EVENT_ARRAY. This map type functions as a fixed-size ring buffer that can store elements of a given size and is allocated per CPU. The eBPF program submits data to the buffer, and the user-land application retrieves it. When the buffer is full, data can’t be submitted, and a drop counter is incremented.
Perf Event Buffers have their issues, as explained by Andrii Nakryiko, so in 2020, eBPF got ring buffers, which have less overhead. Perf Event Buffers are still used, as only Linux 5.8 and above supports ring buffers. It doesn’t make a difference for our toy examples, but I’ll show you how to use ring buffers in a few weeks.
You can read more about Perf Event Buffers in the Learning eBPF book by Liz Rice, pages 24 to 28.
Example
Now, to a small example, called chapter2.HelloBuffer, which records for every execve call the calling process id, the user id, and the current task name and transmits it to the Java application:
> ./run.sh chapter2.HelloBuffer
2852613 1000 code Hello World  # vs code
2852635 1000 code Hello World
2852667 1000 code Hello World
2852690 1000 code Hello World
2852742 1000 Sandbox Forked Hello World  # Firefox
2852760 1000 pool-4-thread-1 Hello World
2852760 1000 jspawnhelper Hello World    # Java ProcessBuilder
2852760 1000 jspawnhelper Hello World
2852760 1000 jspawnhelper Hello World
2852760 1000 jspawnhelper Hello World
2852760 1000 jspawnhelper Hello World
2852760 1000 jspawnhelper Hello World
2852760 1000 jspawnhelper Hello World
2852760 1000 jspawnhelper Hello World
This gives us already much more information than the simple counter from my last blog post. The eBPF program to achieve this is as follows:
BPF_PERF_OUTPUT(output);

struct data_t {
    int pid;
    int uid;
    char command[16];
    char message[12];
};

int hello(void *ctx) {
    struct data_t data = {};
    char message[12] = "Hello World";

    // obtain process and user id
    data.pid = bpf_get_current_pid_tgid() >> 32;
    data.uid = bpf_get_current_uid_gid() & 0xFFFFFFFF;

    // obtain the current task/thread/process name,
    // without the folder, of the task that is currently
    // running
    bpf_get_current_comm(&data.command,
        sizeof(data.command));
    // "Safely attempt to read size bytes from kernel space
    //  address unsafe_ptr and store the data in dst." (man-page)
    bpf_probe_read_kernel(&data.message,
        sizeof(data.message), message);

    // try to submit the data to the perf buffer
    output.perf_submit(ctx, &data, sizeof(data));

    return 0;
}
You can get more information on bpf_get_current_com, bpf_probe_read_kernel in the bpf-helpers(7) man-page.
The Java application that reads the buffer and prints the obtained information is not too dissimilar from the example in my previous blog post. We first define the Data type:
record Data(
   int pid,
   int uid,
   // we model char arrays as Strings
   // with a size annotation
   @Size(16) String command,
   @Size(12) String message) {}

// we have to model the data type as before
static final BPFType.BPFStructType<Data> DATA_TYPE =
   new BPFType.BPFStructType<>("data_t",
        List.of(
                new BPFType.BPFStructMember<>("pid",
                     BPFType.BPFIntType.INT32, 0, Data::pid),
                new BPFType.BPFStructMember<>("uid",
                     BPFType.BPFIntType.INT32, 4, Data::uid),
                new BPFType.BPFStructMember<>("command",
                     new BPFType.StringType(16), 8, Data::command),
                new BPFType.BPFStructMember<>("message",
                     new BPFType.StringType(12), 24, Data::message)),
        new BPFType.AnnotatedClass(Data.class, List.of()),
            objects -> new Data((int) objects.get(0),
                                (int) objects.get(1),
                                (String) objects.get(2),
                                (String) objects.get(3)));
You might recognize that the BPF types now have the matching Java type in their type signature. I added this to have more type safety and less casting.
To retrieve the events from the buffer, we first have to open it and pass in a call-back. This call-back is called for every available event when we call PerfEventArray#perf_buffer_poll:
try (var b = BPF.builder("""
        ...
        """).build()) {
    var syscall = b.get_syscall_fnname("execve");
    b.attach_kprobe(syscall, "hello");

    BPFTable.PerfEventArray.EventCallback<Data> print_event =
      (/* PerfEventArray instance */ array,
       /* cpu id of the event */     cpu,
       /* event data */              data,
       /* size of the event data */  size) -> {
        var d = array.event(data);
        System.out.printf("%d %d %s %s%n",
            d.pid(), d.uid(), d.command(), d.message());
    };

    try (var output = b.get("output",
         BPFTable.PerfEventArray.<Data>createProvider(DATA_TYPE))
             .open_perf_buffer(print_event)) {
        while (true) {
            // wait till packages are available,
            // you can a timeout in milliseconds
            b.perf_buffer_poll();
        }
    }
}
Tests
I’m happy to announce that hello-ebpf now has its own test runner, which uses virtme and docker to run all tests in their own runtime with their own kernel. All this is wrapped in my testutil/bin/java wrapper so that you can run the tests using mvn test:
mvn -Djvm=testutil/bin/java
And the best part? All tests are written using plain JUnit 5. As an example, here is the HelloWorld test:
public class HelloWorldTest {
    @Test
    public void testHelloWorld() throws Exception {
        try (BPF b = BPF.builder("""
                int hello(void *ctx) {
                   bpf_trace_printk("Hello, World!");
                   return 0;
                }
                """).build()) {
            var syscall = b.get_syscall_fnname("execve");
            b.attach_kprobe(syscall, "hello");
            Utils.runCommand("uname", "-r");
            // read the first trace line
            var line = b.trace_readline();
            // assert its content
            assertTrue(line.contains("Hello, World!"));
        }
    }
}
There are currently only two tests, but I plan to add many more.
Conclusion
In this blog post, we learned about Perf Event Buffers, a valuable data structure for repeatedly pushing information from the eBPF program to the user-land application. Implementing this feature, we’re getting closer and closer to completing chapter 2 of the Learning eBPF book. Truth be told, the implementation in the GitHub repository supports enough of the BCC to implement the remaining examples and even the exercises from Chapter 2.
In the next part of the hello-ebpf series, I’ll show you how to tail call in eBPF to other eBPF functions and how to write your first eBPF application that uses the hello-ebpf library as a dependency.
Thanks for joining me on this journey to create a proper Java API for eBPF. Feel free to try the examples for yourself or even write new ones and join the discussions on GitHub. See you in my next blog post or at FOSDEM.
This article is part of my work in the SapMachine team at SAP, making profiling and debugging easier for everyone.

")
")


")