For the impatient: Take a look at my Java JFR Profiler IntelliJ plugin to easily profile your application and view JFR files directly in your IDE.
I got involved in the Firefox Profiler development, spending significant portions of my time at SAP in the last half year on it. It has been an exciting ride. I learned a lot and contributed a few features. So I was essentially developing React code when I wasn’t working on ASGST or other OpenJDK-related tools. But you may well ask the most important of all questions: Why? Why did I spend so much time on a profiler for JavaScript and the Firefox browser? It all started in August 2022…
How did I end up there?
I developed code related to the Java debugging protocol in the second quarter of 2022. I had grand plans, but it eventually did turn out to be far more complicated than expected, but that is a story for another blog post. You can read my short primer on Java debugging internals to get a glimpse of this work. During the development, I encountered a problem: How can I profile my code, especially unit tests? I had many unit tests like the following, which tested specific aspects of my code:
@Test
public void testEvaluateSwitchStatement() {
    var program = Program.parse("((= x 1) (switch (const x)" +
        "(case 1 (= v (collect 2))) (case 2 (= v (collect 1)))" +
        "))");
    var funcs = new RecordingFunctions();
    new Evaluator(vm, funcs).evaluate(program);
    assertEquals(List.of(wrap(2L)), funcs.values);
}
I wanted to use an open-source profiler, as I had no access to the paid version of IntelliJ, which includes profiling support. Multiple tools are available, but it essentially boils down to async-profiler and JMC. Both tools have their advantages and disadvantages regarding their UI, but it essentially boils down to ease of use vs. available features:
Async-profiler and its profiling visualizations are easy to use but do not have that many features. The only available visualization is flamegraphs with minimal interactivity, just zooming is supported. Flamegraphs are the bread-and-butter of profiling:
If you want more visualizations, like a tree view, timelines, or a JFR event view, you can export your profile into JFR format (or use JFR to record your profile directly) and view it in JMC. But the difference between the ease of use of both is vast: Whereas the flamegraphs of async-profiler are usable by anyone with a short introduction, using JMC has a steep learning curve, it is currently more a tool for experts to dig deep into the profiling data. This observation leads us to the first problem: There is, to my knowledge, no open-source tool that offers more visualizations than just flamegraphs and is as easy to use.
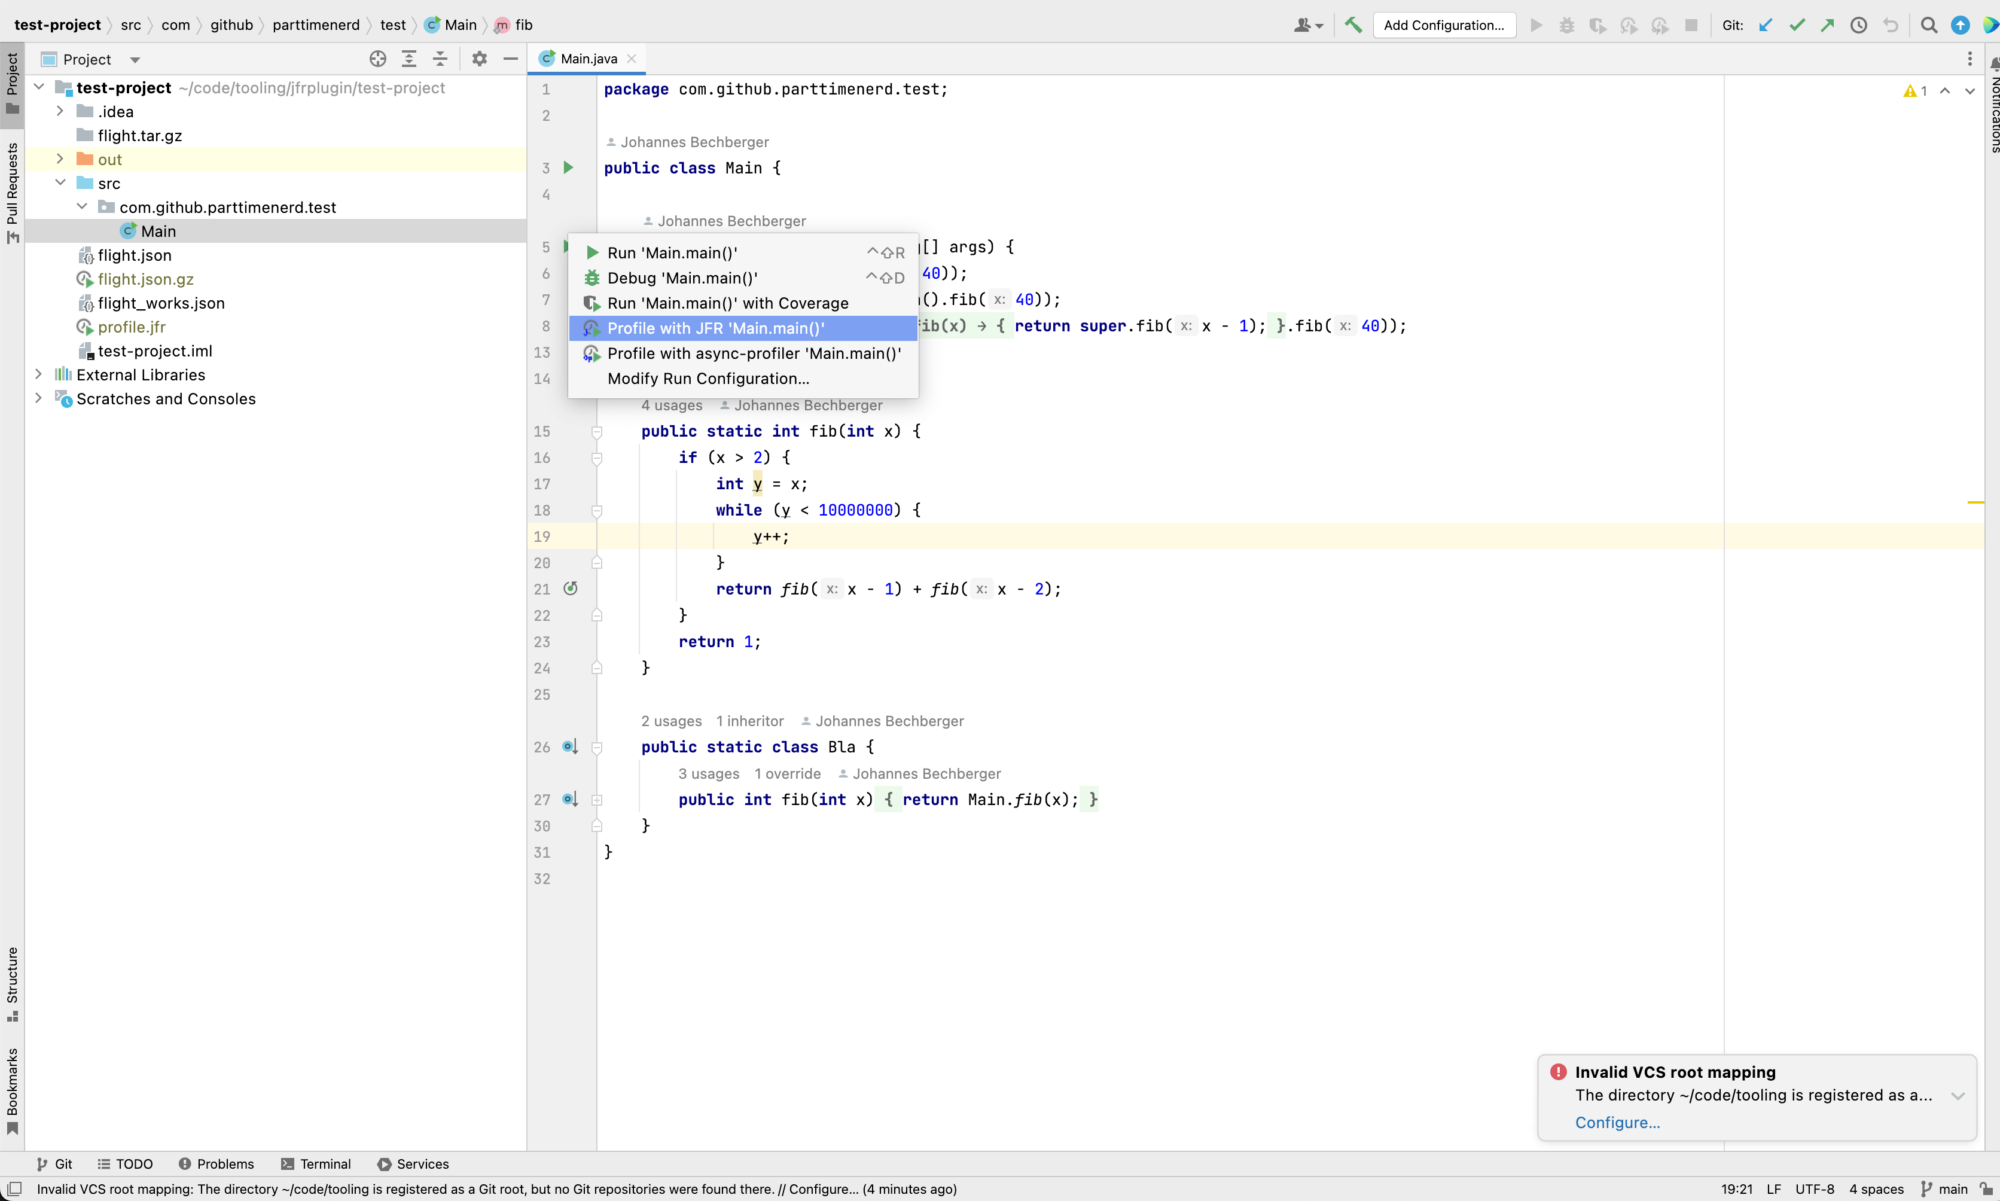
Another problem with both async-profiler and JFR is the missing integration into IDEs. I would like to just click on a button in a context menu to profile an individual test case:
Without the hassle of creating a main method that just calls this method: I want to be able to profile it by modifying the JVM options of a run configuration.
I thought I was probably not the only one with this use case who stumbled upon the two problems impeding profiling. I had some spare time in August, so I looked for ways to build a tool myself.
Building a basic version of an IDE plugin that solves the second of my two problems is relatively easy. There is already the open-source profiling plugin Panda by Rastislav Papp, on which I based mine. Panda has only a simple tree view visualization, so it does not cover my first problem with visualizations. So I still had to figure out how I could implement the UI. Implementing it directly in the IDE in Java is cumbersome, so I decided early on to use an embedded browser. I considered implementing it myself, with the help of libraries like d3-flamegraph or extending speedscope, but this proved too much work. And I had no experience in building production-ready web applications, or for that matter, React.
Advantages of Firefox Profiler
Here comes the Firefox Profiler: It might seem illogical to use it in a use case that its developers never thought about, but it has a lot going for it:
it has multiple visualizations and a timeline to select time slices
it has a matrix channel where you can ask a lot of questions and get great answers
it has a well-defined profile format which is rather extensively documented
its developers were open to collaborating with me, adapting Firefox Profiler for non-web use cases
It has still been a lot of work to add the necessary features for my use case, and it is an ongoing effort to integrate them into the mainline Firefox Profiler. But if the current Firefox Profiler meets all your needs UI-wise, then using it beyond the web is just a matter of writing a profiler.
Just keep in mind that you’ll have to map your data onto the profile data structure of Firefox Profiler.
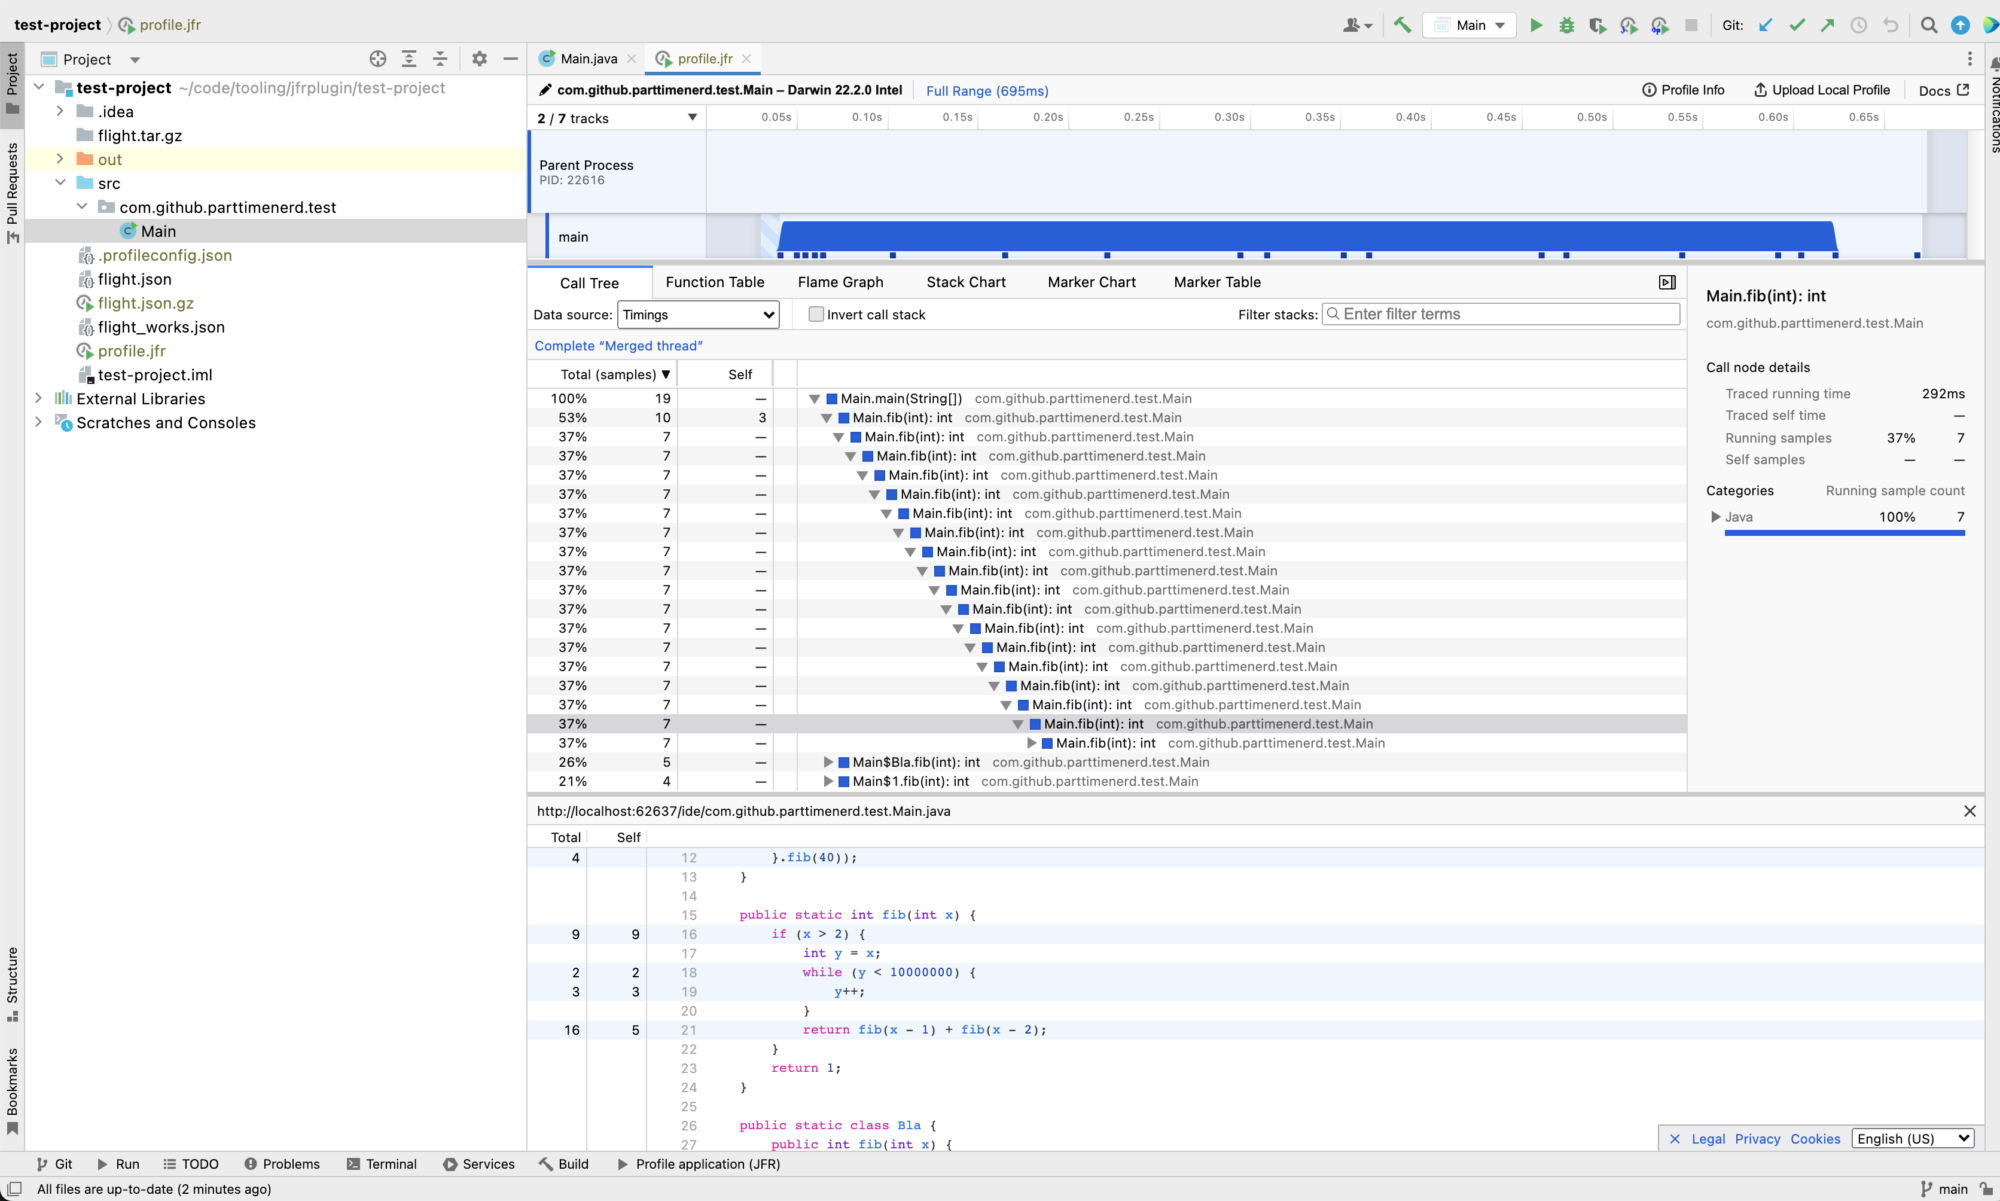
It uses my Firefox Profiler fork, which includes additions not yet in the upstream repository and has a modular implementation so that you can use the JFR to Firefox Profiler converter independently. The plugin supports gathering profiles using JFR and async-profiler (via ap-loader), the previous image with the different run configurations is from my plugin, and opening arbitrary JFR files (as long as they are not too large):
The plugin integrates with your IDE, navigating to a method in the source code when you double-click a method in the profile view. Shift double-click, and it shows you the code with the profiling information on the side:
Besides that, it has support for showing information on all JFR events:
The Firefox Profiler view contains a Function Table, Flame Graph, and Stack Chart view, combined with a timeline on top, so it truly solves the first problem of visualizations. And it solves the second problem, as profiling with JFR or async-profiler can’t be more accessible than clicking a single button.
The plugin is under active development and currently in the beta stage, so give it a try and feel free to create issues on GitHub. You can pick the Java JFR Profiler plugin from the JetBrains marketplace.
I will write an entire blog post covering the plugin usage in the next few weeks, so stay tuned for more information and possibly a screencast.
I’ll release another, more technical blog post in the next few days, which covers other tools that use Firefox Profiler as a visualization and the profile format. This will be the second part of my FOSDEM talk. I hope to see you there or in the stream.
This blog post and the IntelliJ Plugin are part of my work in the SapMachine team at SAP, making profiling easier for everyone.
This blog post will be the base for my upcoming talk at FOSDEM 2023, “AsyncGetStackTrace: The Improved Version Of AsyncGetCallTrace (JEP 435),” and is based on the JEP Candidate 435.
Consider you want to write a profiler to profile Java applications. Why? Because you think that the existing ones “[…] Are Fucking Terrible” or “[…] Broken”. Or you want to start a blog series on writing a profiler from scratch to learn their inner workings (hi there, regular readers). One of the integral parts is to get stack traces of your application. Modern profilers are usually sampling profilers, which probe an application at regular intervals. Probing is hard without a proper way to obtain traces. The JVM offers us two different mechanisms:
GetStackTrace
You could use the official and well defined GetStackTrace JVMTI API, which OpenJ9 and every other JVM out there also Implement:
Get information about the stack of a thread. If max_frame_count is less than the depth of the stack, the max_frame_count topmost frames are returned, otherwise the entire stack is returned. The topmost frames, those most recently invoked, are at the beginning of the returned buffer.
So what is the problem? This API is safe-point biased. This means that you can only obtain a stack trace using GetStackTrace only at certain points in time where the JVM state is well-defined, called safe points. This bias significantly reduces the accuracy of your profiler, as we can only observe a subset of locations in a program using these stack traces. More on this in blog posts like “Java Safepoint and Async Profiling” by Seetha Wenner.
We, therefore, cannot in all earnest use this API, except if we’re constrained to official APIs like VisualVM, which despite everything, uses it.
So what are our other options? Writing a custom perf agent, we could obtain the traces using perf on Linux, which polls the JVM for information on all observed methods. But this is Linux-specific and never took off, with the most popular agent only supporting Java 8. There has been an issue for async-profiler since 2017 in which Andrei Pangin concluded:
The idea is to implement Java stack walking on our own without relying on AGCT. Since the agent runs in the context of JVM, it can access VM structures, especially those exported through VMStructs. It should be possible to replicate stack walking logic of the VM inside async-profiler, though it might be challenging. The main risk is that differrent versions of JVM may have different stack layout, but VMStructs along with special handling of the known versions is likely to help.
He never implemented anything into his async-profiler.
AsyncGetCallTrace
The only other option left is to use AsyncGetCallTrace, an API added on the 19th of November 2002 in the JVMTI draft and removed two months later. This API is the asynchronous, non-safepoint-biased (kind-of) version of GetStackTrace, called from signal handlers at any point of time:
void AsyncGetCallTrace(ASGCT_CallTrace *trace, jint depth,
                       void* ucontext)
// Arguments:
//
//   trace    - trace data structure to be filled by the VM.
//   depth    - depth of the call stack trace.
//   ucontext - ucontext_t of the LWP
//
// ASGCT_CallTrace:
//   typedef struct {
//       JNIEnv *env_id;
//       jint num_frames;
//       ASGCT_CallFrame *frames;
//   } ASGCT_CallTrace;
//
// Fields:
//   env_id     - ID of thread which executed this trace.
//   num_frames - number of frames in the trace.
//                (< 0 indicates the frame is not walkable).
//   frames     - the ASGCT_CallFrames that make up this trace.
//                Callee followed by callers.
//
//  ASGCT_CallFrame:
//    typedef struct {
//        jint lineno;
//        jmethodID method_id;
//    } ASGCT_CallFrame;
The honest-profiler was probably the first open-source profiler that used it, starting in early 2014. After this, many other profilers, commercial and open-source, followed, not because it is an ideal API, but because it was the only one available. Albeit available is a strong word, as Sun removed the API from JVMTI, it now lives in a C++ source file without any exported header: The JVM exports the symbol AsyncGetCallTrace, because Sun probably used the API in their Sun Studio, which contained a profiler. To use it, one must use dlsym and hope that it is still there: It’s an internal API that might disappear in the blink of an eye, although being rather unlikely. Other JVMs are not required to have this API, e.g., OpenJ9 only got this API in 2021.
History of AsyncGetStackTrace
So where do I come into this story? I started in the SapMachine team at SAP at the beginning of last year after only minor academic success. One of my first tasks was to help my colleague Gunter Haug fix a bug in the PPC64le support of async-profiler, resulting in my first contribution to this project.
We had discussions on AsyncGetCallTrace during all of this, as Gunter had talked with Volker Simonis a few years back about writing a better API, but never found the time to work on it. So when I came with fresh enthusiasm, I restarted these discussions in the middle of January. I started working on a new API with the working title AsyncGetCallTrace2, later renamed to AsyncGetStackTrace, implementing a basic version with a modified async-profiler and getting valuable feedback from Gunter, Volker, and Andrei.
These discussions eventually led to the proposal of AsyncGetStackTrace that is currently out in the open as JEP Candidate 435. waiting for feedback from the JFR and supportability community (and the related teams at Oracle).
AsyncGetStackTrace
The proposed API is essentially an extended, official, and well-tested version of AsyncGetCallTrace:
it has its own profile.h header, so using it is easy
it returns much more information on individual frames, like compilation level (interpreted, C1, C2, …) and info on inlining
and can also be instructed to record information on all C/C++ frames on the stack …
… for Java and (!) non-Java threads
its implementation contains a StackWalker class which could be used for AsyncGetCallTrace and JFR in the future …
… which would result in less technical debt and easier propagation of bug fixes, as today where the stack walking code of JFR and AsyncGetCallTrace overlap with copied code
I’m using C/C++ frames as the term for all frames that are typically called native in other programming language communities because native frames are related to native methods, which are methods that are declared in Java but defined in C/C++ code.
Now to the API: I will inadvertently use parts of the text of my JEP in the following, but I will not update this blog post in the future every time my JEP changes. I would really encourage you to read the JEP Candidate 435 yourself, after you read this one, it has a different angle than this blog post.
Function Declaration
The primary function definition is similar to AsyncGetCallTrace:
It stores the stack frames in the pre-allocated trace, up to the specified depth, obtain the start frame from the passed ucontext. The only real difference is here that we can configure the stack walking. Currently, the API supports two features which the caller can enable by setting the bits of the options argument:
enum ASGST_Options {
  // include C/C++ and stub frames too
  ASGST_INCLUDE_C_FRAMES         = 1,
  // walk the stacks of C/C++, GC and deopt threads too
  ASGST_INCLUDE_NON_JAVA_THREADS = 2,
};
Both options make writing simple profilers which also walk C/C++ frames and threads far more straightforward. The first option allows us to see frames that we could not see before (even with the advanced processing of async-profiler): C/C++ frames between Java frames. This is quite useful when you work with JNI code which in turn calls Java code. You can find an example for this in the innerc test case of my JEP draft code:
With the old API you would never observe the checkCMethod in a stack trace, even if it would take lots of time to execute. But we disabled the options to mimic the behavior (and number of obtained frames), of AsyncGetCallTrace.
CallTrace
We defined the main trace data structure in the new API as follows:
typedef struct {
  jint num_frames;                // number of frames in this
                                  //   trace, (< 0 indicates the
                                  //   frame is not walkable).
  uint8_t kind;                   // kind of the trace
  ASGST_CallFrame *frames;        // frames that make up this trace.
                                  //   Callee followed by callers.
  void* frame_info;               // more information on frames
} ASGST_CallTrace;
There are two new fields: The kind of trace and the frame_info field for additional information on every frame, which could later be added depending on the configuration, without changing the API.
There are five different kinds of traces:
Java Trace: trace of a thread that is currently executing Java code (or C/C++ code transitively called from Java code). The only kind you would observe with the default configuration because only these traces contain Java frames
C/C++ Trace: trace of a non-Java thread
GC Trace: trace of a Java thread during a GC execution
Deoptimization Trace: trace of Java thread that currently runs in a deoptimization handler (deoptimizing JIT compiled code)
Unknown Trace: signals that we could not get a first valid frame from the passed ucontext
We encode the error code as negative numbers in the num_frames field because it keeps the data structures simple and AsyncGetCallTrace does it too. Every trace with num_frames > 0 is valid.
Frames
The most significant difference between the two APIs is in the representation of frames: Where AsyncGetCallTrace just stored the bytecode index and the method id, we capture much more. But first, we have to distinguish between Java frames, related to Java and native methods, and non-Java frames, related to stub and C/C++ frames. We use a union called ASGST_CallFrame for this:
typedef union {
  uint8_t type;     // to distinguish between JavaFrame and
                    //   NonJavaFrame
  ASGST_JavaFrame java_frame;
  ASGST_NonJavaFrame non_java_frame;
} ASGST_CallFrame;
The type here is more fine-grained than just two options:
enum ASGST_FrameTypeId {
  ASGST_FRAME_JAVA         = 1, // JIT compiled and interpreted
  ASGST_FRAME_JAVA_INLINED = 2, // inlined JIT compiled
  ASGST_FRAME_NATIVE       = 3, // native wrapper to call
                                //   C methods from Java
  ASGST_FRAME_STUB         = 4, // VM generated stubs
  ASGST_FRAME_CPP          = 5  // C/C++/... frames
};
The first three types map to ASGST_JavaFrame and others to ASGST_NonJavaFrame, as hinted before. We don’t store too much information for non-Java frames not to increase the size of every frame. We store the program counter, which the profiler can use to obtain the function name and possibly the location inside the function:
typedef struct {
  uint8_t type;      // frame type
  void *pc;          // current program counter inside this frame
} ASGST_NonJavaFrame; // used for FRAME_STUB, FRAME_CPP
We store the compilation level, the bytecode index, and the method id for Java frames, encoding the information on inlining in the type:
typedef struct {
  uint8_t type;            // frame type
  int8_t comp_level;       // compilation level,
                           //   0 is interpreted, -1 is undefined,
                           //   > 1 is JIT compiled
  uint16_t bci;            // 0 < bci < 65536
  jmethodID method_id;
} ASGST_JavaFrame;         // used for FRAME_JAVA,
                           //   FRAME_JAVA_INLINED and FRAME_NATIVE
Although the API provides more information, the amount of space required per frame (e.g., 16 bytes on x86) is the same as for the existing AsyncGetCallTrace API.
Testing
AsyncGetCallTrace has just onetest case at the time of writing, which merely checks one single frame. This is a pity for such a widely used API. The JEP candidate suggests that the implementation should have many more than that. Walking a stack asynchronously might trigger segmentation faults in the profiled JVM. The possibility of such can be reduced by extensive testing, calling AsyncGetStackTrace millions of times per second on benchmarks for hours and calling it with randomly modified ucontexts.
The code of the draft implementation contains several of these to ensure that calling the API is safe enough. It will never be entirely safe, as asynchronously walking stacks in a signal handler of a thread while all the other threads are still running is inherently risky. The aim is to reduce the risk to a level where the possibility of anything happening in real-world settings is minuscule.
Conclusion
Working on this JEP, with the help of my team and Jaroslav Bachorik, almost exactly a year now, gave me a glimpse into the inner workings of the OpenJDK. It was great to talk with so many different people from different companies. I hope to continue this in the future and someday land this JEP in the OpenJDK, gifting the Java ecosystem a much-needed official profiling API. Achieving this will probably take months, if not years, but we’ll see.
Thanks for reading this article. If you’re interested in a presentation version, come to the Friends of OpenJDK devroom at FOSDEM 2023, where I give a talk on Sunday the 5th of February at 3:20 pm or drop me a message if you’re there.
Share the word on AsyncGetStackTrace and comment with any suggestions or questions that you might have.
This blog post is part of my work in the SapMachine team at SAP, making profiling easier for everyone.
This is the second post in the series, building a profiler from scratch using AsyncGetCallTrace: Today, we’re covering wall-clock profiling and how to collect the obtain stack traces. If you’re unfamiliar with AsyncGetCallTrace, please check out my previous article in the series here.
Our goal today is to essentially write the primary loop of a profiler and do the following every n milliseconds (where n is our chosen profiling interval):
The question that comes up is: Which threads should we sample? If we only sample currently running threads, then we have cpu-time profiling, but if we sample all threads (running and idle), we have the far more popular wall-clock profiling. The difference between both types is best described by Richard Warburton and Sadiq Jaffer in their article on opsian.com:
CPU Time. There’s very little point in trying to measure what’s happening off-cpu if you’ve got a single very hot thread, as many event-loop style applications have. You may see plenty of time being spent in other threads that are waiting around performing background work but aren’t actually a bottleneck in terms of your application. So CPU Time is useful when you know you’re bottlenecked on a CPU problem.
Wallclock Time is useful for problems where CPU utilisation seems low but application throughput or latency doesn’t meet expectations. This is because threads are probably blocked on something, for example lock contention, times when you’re waiting for downstream blocking network IO to happen or running with too many threads so some of them don’t get scheduled. The trigger for looking at Wallclock time would be low CPU usage during your period of performance issues.
The choice of the sampling mode, therefore, depends on the actual use case.
How do we obtain the list of threads in the first place? We could use the aptly named GetAllThreads method, but we cannot use the returned thread objects to quickly get the thread ids we need for sending the threads signals. There is another possibility: Registering for ThreadStart and ThreadEnd events and collecting the threads as they are created:
Thread start events are generated by a new thread before its initial method executes. A thread may be listed in the array returned by GetAllThreads before its thread start event is generated. It is possible for other events to be generated on a thread before its thread start event. The event is sent on the newly started thread.
JVMTI documentation
We create a class called ThreadMap for this purpose (stored in a global variable): It maps thread ids to the internal ids (because thread ids might be reused during the lifetime of a process), and the jthread (for JVMTI operations) and the pthread (for sending signals) and maps these internal ids in turn to names, so we can later display them. It has to be thread-safe, as we’re accessing it from multiple threads in parallel. So we have to create a lock for its internal data structures. This is quite simple with modern C++:
Obtaining the thread id for the current thread leads to our first platform-dependent code, using a syscall on Linux and a non-posix pthread method on mac:
Yes, we could quickly implement our profiler for other BSDs like FreeBSD, but MacOS is the only one I have at hand.
Keep in mind to also add the main thread to the collection by calling the OnThreadStart method in the OnVMInit method, which handles the start of the VM.
Now we have an up-to-date list of all threads. For wall-clock profiling, this is fine, but for cpu-time profiling, we have to obtain a list of running threads. We conveniently stored the jthread objects in our thread map, so we can now use the GetThreadState method:
bool is_thread_running(jthread thread) {
  jint state;
  auto err = jvmti->GetThreadState(thread, &state);
  // handle errors as not runnable
  return err == 0 && state != JVMTI_THREAD_STATE_RUNNABLE;
}
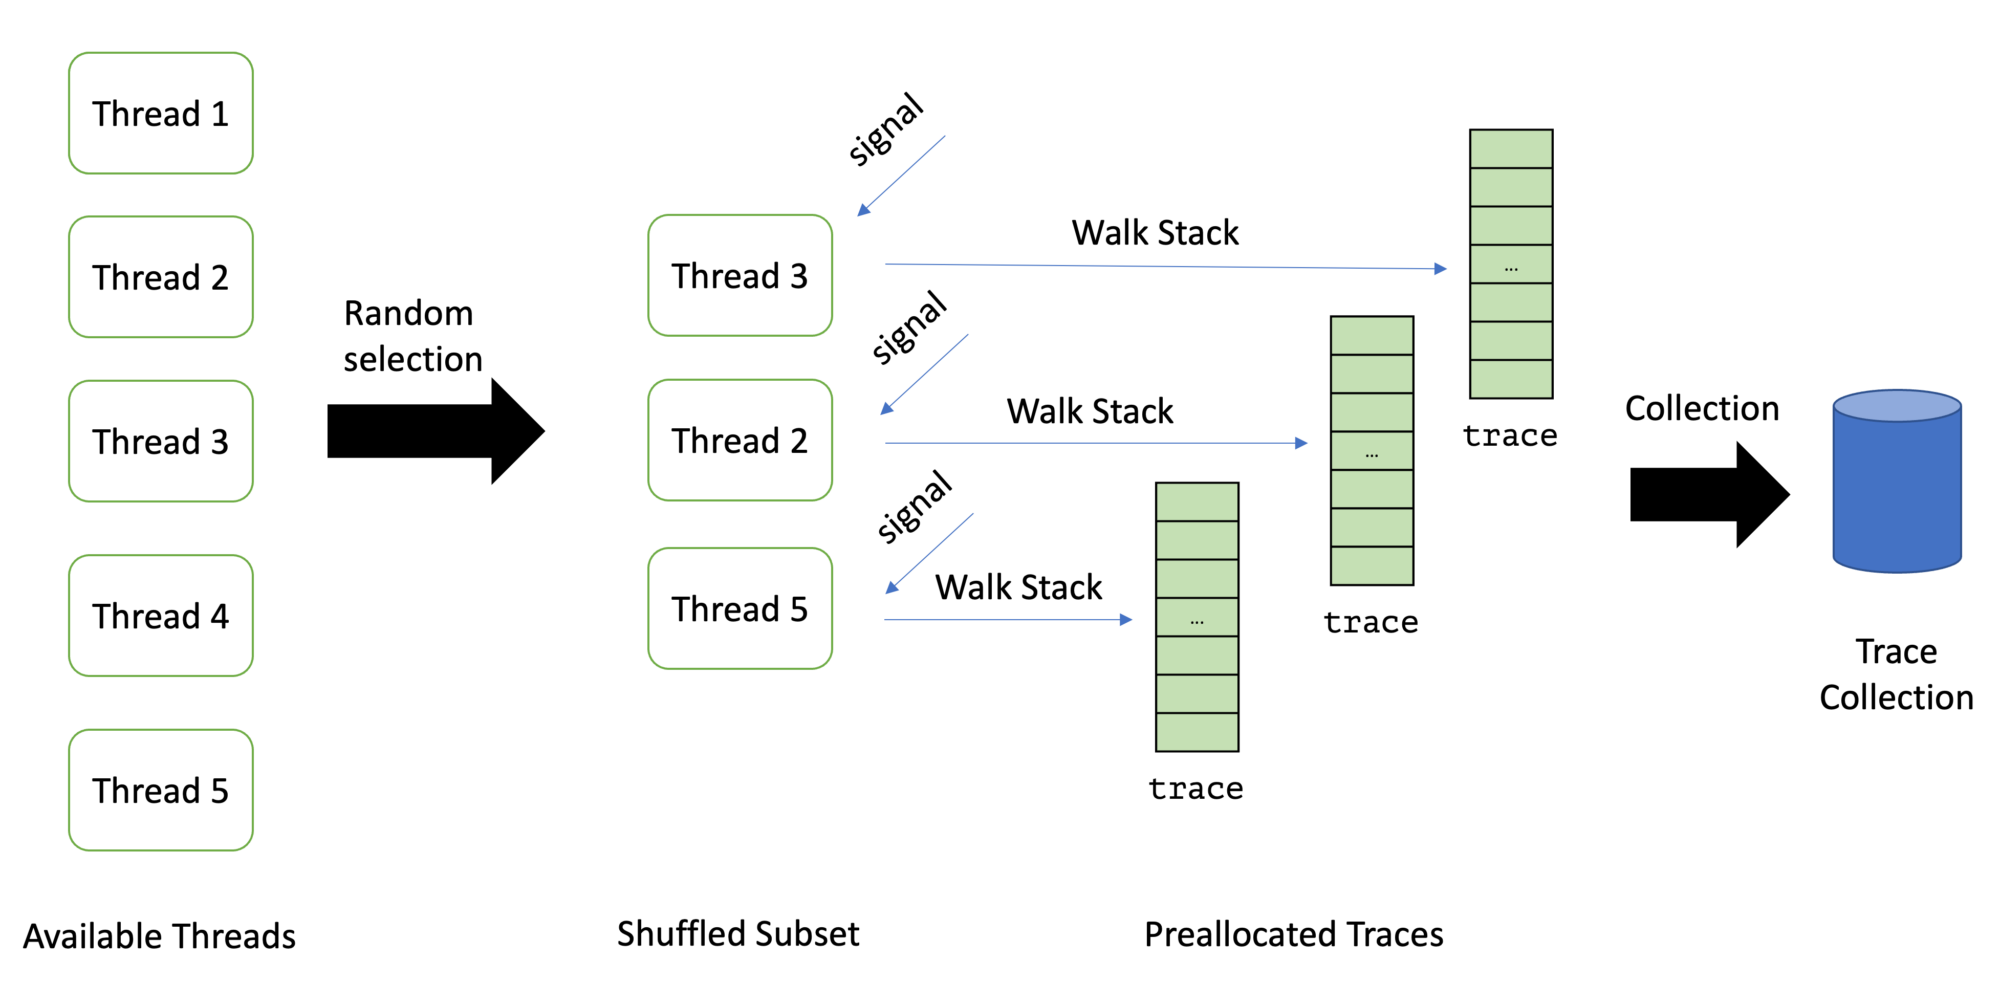
This leads us to a list of threads that we can sample. It is usually not a good idea to sample all available threads: With wall-clock profiling, the list of threads can be so large that sampling all threads is too costly. Therefore one typically takes a random subset of the list of available threads. Async-profiler, for example, takes 8, which we use too.
Taking a random subset is quite cumbersome in C, but C++ has a neat library function since C++11: std:shuffle. We can use it to implement the random selection:
Be aware that we had to change the mutex to a mutex which allows recursive reentrance, as get_all_threads also acquires the mutex.
The next step is creating a sampling thread that runs the loop I described at the beginning of this article. This superseedes the itimer sampler from the previous post, as the mechanism does not support sending signals to a random subset only. The sampling thread is started in the OnVMInit handler and joined the OnAgentUnload handler. Its implementation is rather simple:
std::atomic<bool> shouldStop = false;
std::thread samplerThread;

static void sampleLoop() {
  initSampler();
  std::chrono::nanoseconds interval{interval_ns};
  while (!shouldStop) {
    auto start = std::chrono::system_clock::now();
    sampleThreads();
    auto duration = std::chrono::system_clock::now() - start;
    // takes into account that sampleThreads() takes some time
    auto sleep = interval - duration;
    if (std::chrono::seconds::zero() < sleep) {
      std::this_thread::sleep_for(sleep);
    }
  }
  endSampler(); // print the collected information
}

static void startSamplerThread() {
  samplerThread = std::thread(sampleLoop);
}
The initSampler function preallocates the traces for N=8 threads, as we decided only to sample as many at every loop. The signal handlers can later use these preallocated traces to call AsyncGetCallTrace:
const int MAX_DEPTH = 512; // max number of frames to capture

static ASGCT_CallFrame global_frames[MAX_DEPTH * MAX_THREADS_PER_ITERATION];
static ASGCT_CallTrace global_traces[MAX_THREADS_PER_ITERATION];


static void initSampler() {
  for (int i = 0; i < MAX_THREADS_PER_ITERATION; i++) {
    global_traces[i].frames = global_frames + i * MAX_DEPTH;
    global_traces[i].num_frames = 0;
    global_traces[i].env_id = env;
  }
}
The sampleThreads the function sends the signals to each thread using pthread_signal. This is why store the pthread for every thread. But how does a signal handler know which of the traces to use? And how does the sampleThreads function know when all signal handlers are finished?
It uses two atomic integer variables for this purpose:
available_trace: the next unused available trace index in the global_traces array
stored_traces: the number of traces already stored
The sampleThreads function has to only wait till stored_traces is as expected:
static void sampleThreads() {
  // reset the global variables
  available_trace = 0;
  stored_traces = 0;
  // get the threads to sample
  auto threads = thread_map.get_shuffled_threads();
  for (pid_t thread : threads) {
    auto info = thread_map.get_info(thread);
    if (info) {
      // send a signal to the thread
      pthread_kill(info->pthread, SIGPROF);
    }
  }
  // wait till all handlers obtained there traces
  while (stored_traces < threads.size());
  // process the traces
  processTraces(threads.size());
}
We keep the processing of the traces from the last blog post and just store the total number of traces as well as the number of failed traces:
static void processTraces(size_t num_threads) {
  for (int i = 0; i < num_threads; i++) {
    auto& trace = global_traces[i];
    if (trace.num_frames <= 0) {
      failedTraces++;
    }
    totalTraces++;
  }
}
The two global variables don’t have to be atomic anymore, as only the sampler thread modifies them. A regular profiler would of course use the traces to obtain information on the run methods, but this is a topic for the next blog post in this series, so stay tuned. You can find the source code for the project on GitHub.
This blog series is part of my work in the SapMachine team at SAP, making profiling easier for everyone.