Debugging OpenJDK Tests in VSCode Without Losing Your Mind

Consider you want to debug a test case of the JDK like serviceability/AsyncGetCallTrace. This test, and many others, are implemented using the Regression Test Harness for the JDK (jtreg):

jtreg is the test harness used by the JDK test framework. This framework is intended primarily for regression tests. It can also be used for unit tests, functional tests, and even simple product tests — in other words, just about any type of test except a conformance test, which belong in a TCK.

As well as API tests, jtreg is designed to be well suited for running both positive and negative compiler tests, simple manual GUI tests, and (when necessary) tests written in shell script. jtreg also takes care of compiling tests as well as executing them, so there is no need to precompile any test classes.

https://openjdk.org/jtreg/

JTREG is quite powerful, allowing you to combine C++ and Java code, but it makes debugging the C++ parts hard. You could, of course, just debug using printf. This works but also requires lots of recompiles during every debugging session. Attaching a debugger like gdb is possible but rather cumbersome, especially if you want to bring this into a launch.json to enable debugging in VSCode.

But worry no more: My new vsreg utility will do this for you 🙂 You can obtain the tool by just cloning its GitHub repository:

git clone https://github.com/parttimenerd/vsreg

Then pass the make test command to it, which you use to run the test that you want to debug:

vsreg/vsreg.py "ASGCT debug" -- make test TEST=jtreg:test/hotspot/jtreg/serviceability/AsyncGetCallTrace JTREG="VERBOSE=all"

Be sure always to pass JTREG="VERBOSE=all": vsreg executes the command, parses the output, and adds a launch config with the label “ASGCT debug” to the .vscode/launch.json file in the current folder.

The utility is MIT licensed and only tested on Linux. Update: Works also on Mac with lldb.

Example Usage

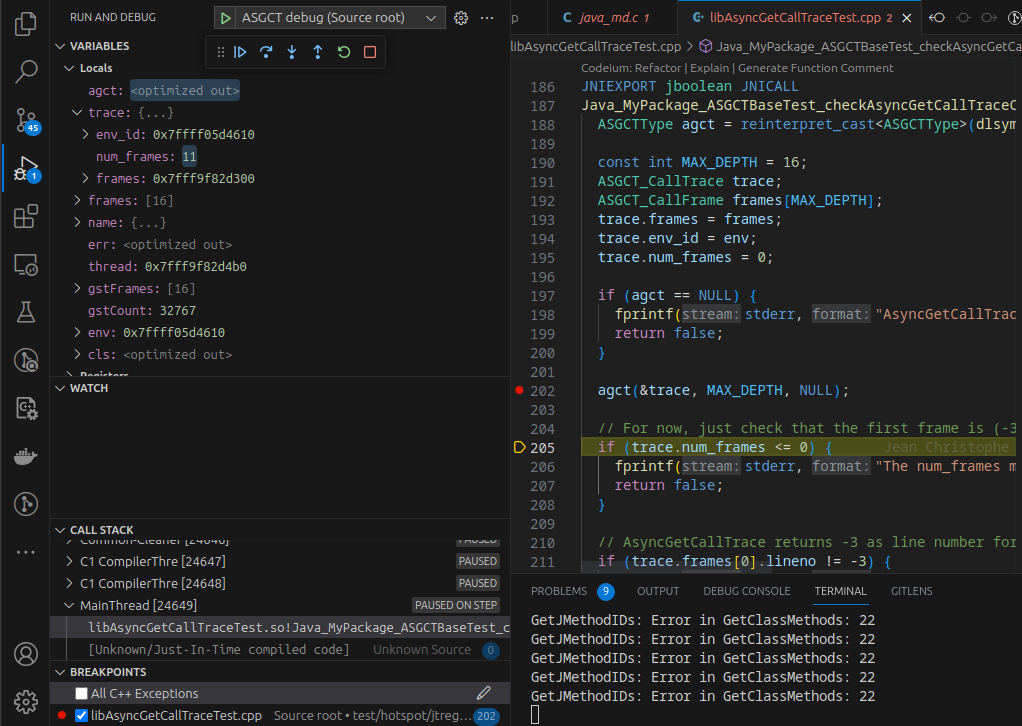
You’re now able to select “ASGCT debug” in “Run and Debug”:

You can choose the launch config and run the jtreg test with a debugger:
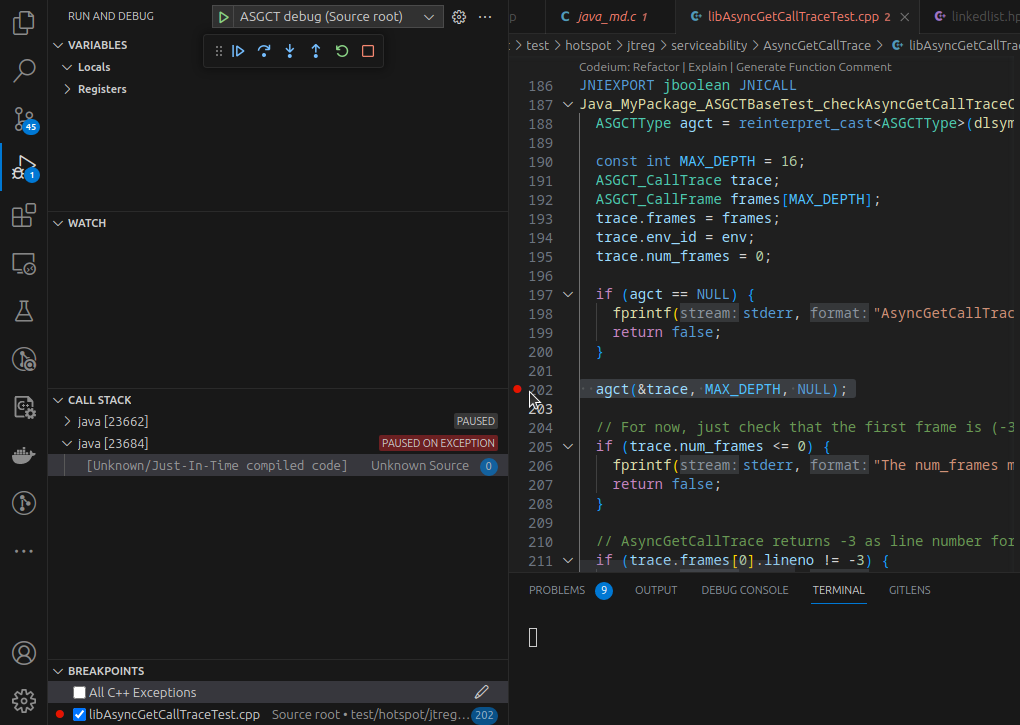
The debugger pauses on a segfault, but there are always a few at the beginning of the execution that can safely be ignored. We can use the program’s pause to add a break-point at an interesting line. After hitting the break-point, we’re able to inspect the local variables…
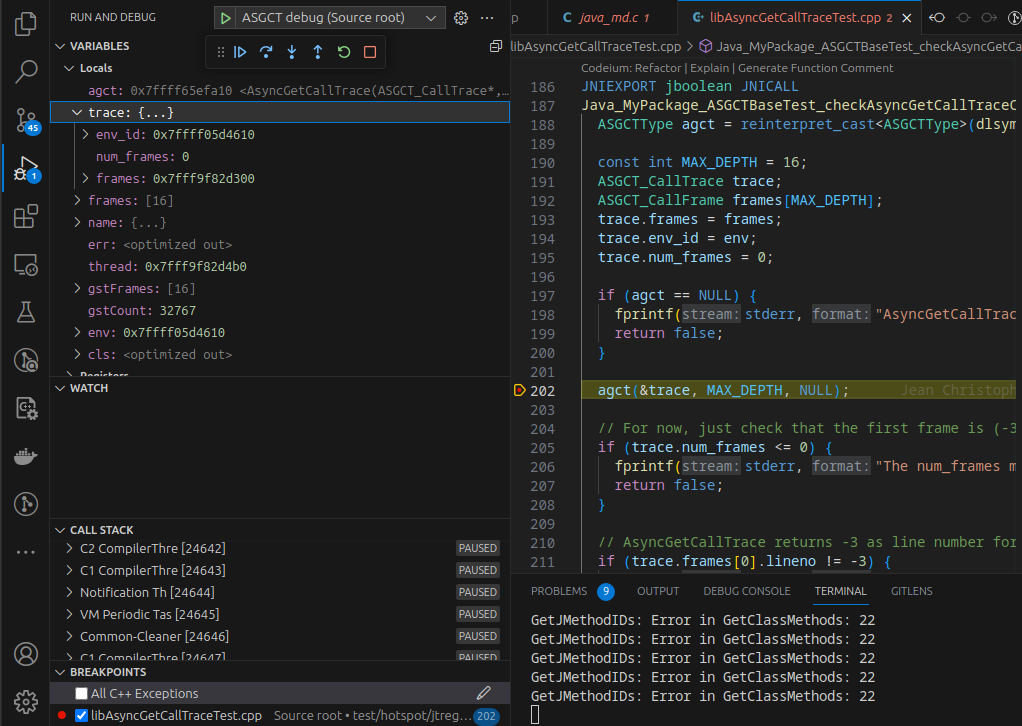
… and do things like stepping over a line:
Recompilation

If you want to recompile the tests, use make images test-image. You can add a task to your .vscode/tasks.json file and pass the label to the --build-task option:

{
  "version": "2.0.0",
  "tasks": [
    {
      "label": "Make test-image",
      "type": "shell",
      "options": {

          "cwd": "${workspaceFolder}"
      },
      "command": "/usr/bin/gmake",
      "args": ["images", "test-image"],
      "problemMatcher": ["$gcc"]
    }
  ]
}

Options

vsreg has a few options:

usage: vsreg.py [-h] [-t TEMPLATE] [-d] [-b TASK] LABEL COMMAND [COMMAND ...]

Create a debug launch config for a JTREG test run

positional arguments:
  LABEL                 Label of the config
  COMMAND               Command to run

options:
  -h, --help            show this help message and exit
  -t TEMPLATE, --template TEMPLATE
                        Template to use for the launch config, 
                        or name of file without suffix in 
                        vsreg/template folder
  -d, --dry-run         Only print the launch config
  -b TASK, --build-task TASK
                        Task to run before the command

An example template looks like this:

{
  "name": "$NAME",
  "type": "cppdbg",
  "request": "launch",
  "program": "",
  "args": [],
  "stopAtEntry": false,
  "cwd": "",
  "environment": [],
  "externalConsole": false,
  "MIMode": "gdb",
  "miDebuggerPath": "/usr/bin/gdb",
  "setupCommands": [
    {
      "description": "Enable pretty-printing for gdb",
      "text": "-enable-pretty-printing",
      "ignoreFailures": true
    },
    {   
      "description": "The new process is debugged after a fork. The parent process runs unimpeded.",
      "text": "-gdb-set follow-fork-mode child",
      "ignoreFailures": true
    }
  ],
  "preLaunchTask": ""
}

vsreg fills in $NAME (with the label), program (with the used Java binary), args, cwd, environment and preLaunchTask.

Conclusion

vsreg is one of these utilities that solve one specific itch: I hope it also helps others; feel free to contribute to this tool, adding new templates and other improvements on GitHub.

The tool is inspired by bear, “a tool that generates a compilation database for clang tooling.”

If you’re wondering why I have a renewed interest in debugging: I’m working full-time on a new proof-of-concept implementation related to JEP 435.

Update 14th July

vsreg now supports creating debug launch configurations for arbitrary commands, e.g. vsreg/vsreg.py "name" -- command, and supports mac os with LLDB. I use this tool daily at work, so feel free to submit any suggestions, I’m happy to further extend this tool.

This project is part of my work in the SapMachine team at SAP, making profiling easier for everyone.

Report of my small Tour d’Europe

Between 31st May and 14th June, I was on tour, giving seven talks in 4 cities in 3 different countries:

A visualization of all the cities I visited, but I took the train for all transits (except for the Arnhem to Nieuwegein route, where Ties van de Ven drove me in his Tesla).

It was an exciting trip, and I had the pleasure of visiting friends in Zurich and Augsburg and a grain mill shop in Munich.

Sadly there are only recordings of two of my seven talks, but all talks were excellent:

JUG Milano: Your Java Application Is Slow? Check Out These Open-Source Profilers

I gave my updated QCon talk in Milan on 31st May:

This is related to my InfoQ article Unleash the Power of Open Source Java Profilers: Comparing VisualVM, JMC, and async-profile. I had a lot of fun giving the talk, and I hope the audience liked it.

Being in Milan for the first time was fantastic. I was able to stay with Mario Fusco for a few days to enjoy the beauty of Gorgonzola, the suburb of Milan where he lives, and also visit the famous Museo Nazionale della Scienza e della Tecnologia Leonardo da Vinci:

OpenValue Munich Meetup: Writing a Profiler in 240 Lines of Pure Java

I then went on to give a talk at the OpenValue Munich Meetup, based on the previous talk and my Writing a Profiler in 240 Lines of Pure Java article:

But before this, I stayed with friends in Augsburg and Zurich:

Wooden tower near Oerlikon, nearby Zurich

JDriven Full Stack Conference

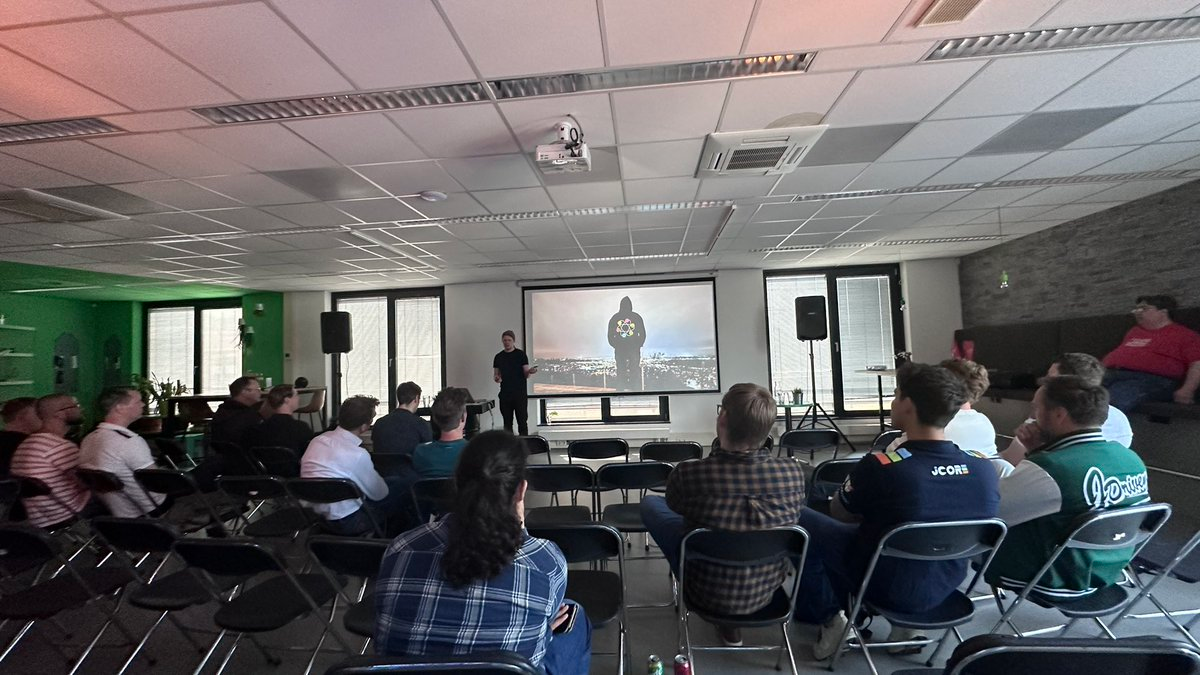
I gave a similar talk, only with a little more information on why you shouldn’t trust profilers (see), in Nieuwegein:

This concluded my three talks outside of Karlsruhe.

Gulasch Programmier Nacht Karlsruhe

After coming home, I gave two talks at the GPN, one based on the article Do you trust profilers? I once did, too, and one based on the two articles Instrumenting Java Code to Find and Handle Unused Classes and Class Loader Hierarchies. The former talk is recorded:

Karlsruher Entwicklertag

My last two talks in Karlsruhe were my profiling talk from before and a talk with live coding based on my writing a profiler from scratch series.

Conclusion

Giving so many talks during two weeks was interesting, although it proved more taxing than I had hoped. I’m happy to start working on my JEP and fixing bugs; a significant rewrite of the JEP might be on the horizon. The following blog post will probably be related.

If you want to see me giving a talk, either invite me or come to the following few planned talks:

July

September

Oktober

  • Basel One, 18th and 19th October: Unleash the Power Of Open-Source Profilers

Hopefully, there will be more. You can find my past and upcoming talks on my new Talks page.

Class Loader Hierarchies

Understanding class loader hierarchies is essential when developing Java agents, especially if these agents are instrumenting code. In my Instrumenting Java Code to Find and Handle Unused Classes post, I instrumented all classes with an agent and used a Store class in this newly added code:

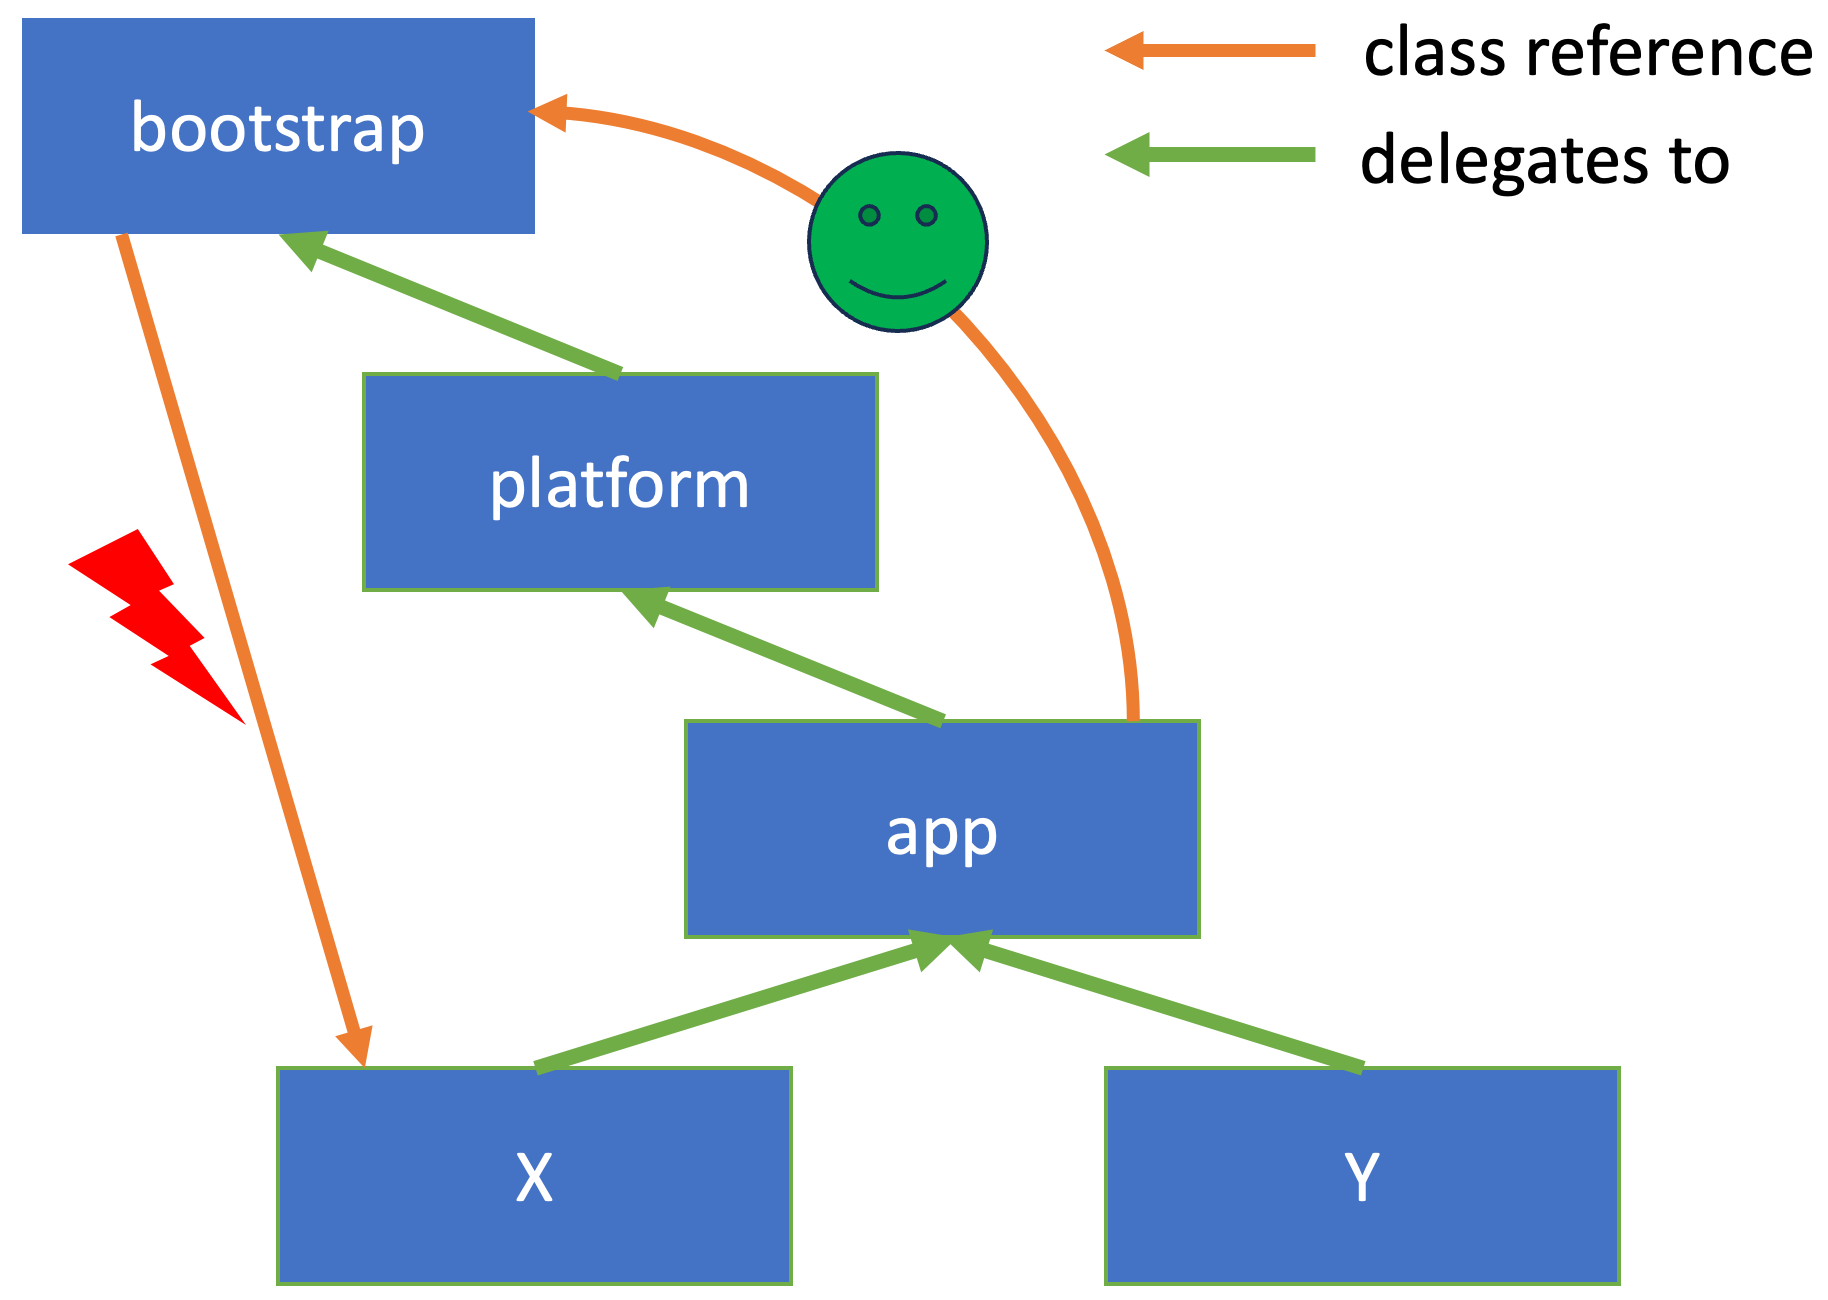
A challenge here is that all instrumented classes will use the Store. We, therefore, have to put the store onto the bootstrap classpath, making it visible to all classes.

Class loaders are responsible for (possibly dynamically) loading classes, and they form a hierarchy:

A class loader is an object that is responsible for loading classes. The class ClassLoader is an abstract class. Given the binary name of a class, a class loader should attempt to locate or generate data that constitutes a definition for the class. A typical strategy is to transform the name into a file name and then read a “class file” of that name from a file system.

[…]

The ClassLoader class uses a delegation model to search for classes and resources. Each instance of ClassLoader has an associated parent class loader. When requested to find a class or resource, a ClassLoader instance will usually delegate the search for the class or resource to its parent class loader before attempting to find the class or resource itself.

ClassLoader Documentation

An application has multiple class loaders:

A typical Java application has a bootstrap class loader (internal JDK classes and the ClassLoader class itself, implemented in C++ code), a platform classloader (all other JDK classes), and an application/system class loader (application classes):

  • Bootstrap class loader. It is the virtual machine’s built-in class loader, typically represented as null, and does not have a parent.
  • Platform class loader. The platform class loader is responsible for loading the platform classes. Platform classes include Java SE platform APIs, their implementation classes and JDK-specific run-time classes that are defined by the platform class loader or its ancestors. The platform class loader can be used as the parent of a ClassLoader instance. […]
  • System class loader. It is also known as application class loader and is distinct from the platform class loader. The system class loader is typically used to define classes on the application class path, module path, and JDK-specific tools. The platform class loader is the parent or an ancestor of the system class loader, so the system class loader can load platform classes by delegating to its parent.
ClassLoader Documentation

An application might create more class loaders to load classes, e.g., from JARs or do some access control; these classes typically have the application class loader as their parent.

Classes loaded by the application class loader (or children of it) can reference JDK classes but not vice versa. This leads to the problem mentioned before. We can mitigate this by putting all classes that our instrumentation-generated code uses into a runtime JAR which we then “put” on the bootstrap class path.

But we don’t put it there but instead tell the bootstrap class loader to also look into our runtime JAR when looking for a class. We do this by using the method void appendToBootstrapClassLoaderSearch(JarFile jarfile) of the Instrumentation class:

Specifies a JAR file with instrumentation classes to be defined by the bootstrap class loader.

When the virtual machine’s built-in class loader, known as the “bootstrap class loader”, unsuccessfully searches for a class, the entries in the JAR file will be searched as well.

This method may be used multiple times to add multiple JAR files to be searched in the order that this method was invoked.

Instrumentation Documentation

But the documentation also tells us that you can create a giant mess when you aren’t careful, including only the minimal number of required classes in the added JAR:

The agent should take care to ensure that the JAR does not contain any classes or resources other than those to be defined by the bootstrap class loader for the purpose of instrumentation. Failure to observe this warning could result in unexpected behavior that is difficult to diagnose. For example, suppose there is a loader L, and L’s parent for delegation is the bootstrap class loader. Furthermore, a method in class C, a class defined by L, makes reference to a non-public accessor class C$1. If the JAR file contains a class C$1 then the delegation to the bootstrap class loader will cause C$1 to be defined by the bootstrap class loader. In this example an IllegalAccessError will be thrown that may cause the application to fail. One approach to avoiding these types of issues, is to use a unique package name for the instrumentation classes.

Instrumentation Documentation

You have to append the classes to the search path before (!) the first reference of the classes, as a class that cannot be resolved when first referenced will never be adequately resolved.

If you want to learn more on how to write an agent, consider reading my Instrumenting Java Code to Find and Handle Unused Classes blog post or watching my talk Instrument to Remove: Using Java agents for fun and profit at the Gulasch Programmier Nacht at June the 10th (a live stream and recordings will be available).

More information on class loaders can be found in the Baeldung article Class Loaders in Java.

How to get the class loader hierarchy of your project

I wanted to know the class loader hierarchy for my own projects, so of course, I wrote an agent for it: The ClassLoader Hierarchy Agent prints the class loader hierarchy at agent load time, the JVM shutdown, and in regular intervals.

Its usage is quite simple. Just attach it to a JVM or add it at startup:

Usage: java -javaagent:classloader-hierarchy-agent.jar[=maxPackages=10,everyNSeconds=0] <main class>
  maxPackages: maximum number of packages to print per classloader
  every: print the hierarchy every N seconds (0 to disable)

For the finagle-http renaissance benchmark, the agent, for example, prints the following when the benchmark is in full swing:

[root]
  platform
       java.sql
       sun.util.resources.provider
       sun.text.resources.cldr.ext
       sun.util.resources.cldr.provider
    app
         me.bechberger               # class loader hierarchy agent 
         org.renaissance             # benchmark harness code
         org.renaissance.core
      null                           # the actual benchmark
        Thread: finagle/netty4/boss-1
           scala
           scala.collection
           scala.jdk
           scala.io
           scala.runtime

The root node is the bootstrap class loader. For every class loader, it gives us a thread that uses it as its primary class loader, a short list of packages associated with the class loader, and its child class loaders.

Class loaders can have names, but sadly not many class loader creators use this feature, which turns understanding the individual class loader hierarchies into a guessing game. This is especially the case for Spring based applications like the Spring PetClinic:

[root]  
  platform
       java.sql
       javax.sql
       sun.security.ec
       sun.security.jgss
       sun.security.smartcardio
    app
      Thread: main
         me.bechberger
         jdk.jshell.execution.impl
         org.springframework.boot.loader
         jdk.internal.org.jline
         org.springframework.boot.loader.jar
      null
        Thread: mysql-cj-abandoned-connection-cleanup
           jakarta.servlet
           jakarta.validation
           org.postgresql
           jakarta.transaction
           jakarta.el

Feel free to try this agent on your applications; maybe you gain some new insights.

Conclusion

Understanding class loader hierarchies helps to understand subtle problems in writing instrumenting agents. Knowing how to write small agents can empower you to write simple tools to understand the properties of your application.

I hope this blog post helped you to understand class loader hierarchies and agents a little bit better. I’m writing it in a lovely park in Milan:

After giving a talk at JUG Milano on profiling on Wednesday:

Next week, I will write a short article on my talk (with slides and the recording). If you live near Munich, you can attend my talk Write your own Java Profiler in 240 lines of pure Java on Monday, June 5th.

As always, feel free to fork my code, share my article, and send suggestions or corrections; see you next week, either on my blog or in person.

This project is part of my work in the SapMachine team at SAP, making profiling easier for everyone.