Custom Events in the Blocky World: Using JFR in Minecraft

Java Flight Recorder (JFR) is one of the main open-source profilers for Java, and the only one built directly into the OpenJDK. You can find an introduction to Java profiling in my InfoQ Unleash the Power of Open-Source Profilers article and additional information and presentation on my Profiling Talks page. Furthermore, I wrote an introduction to custom JFR events: Custom JFR Events: A Short Introduction. JFR and custom events are pretty helpful when profiling applications, this blog post gives you an example from the real world.

I was searching for some JFR-related settings on the internet when I stumbled upon the /jfr command that exists in Minecraft:

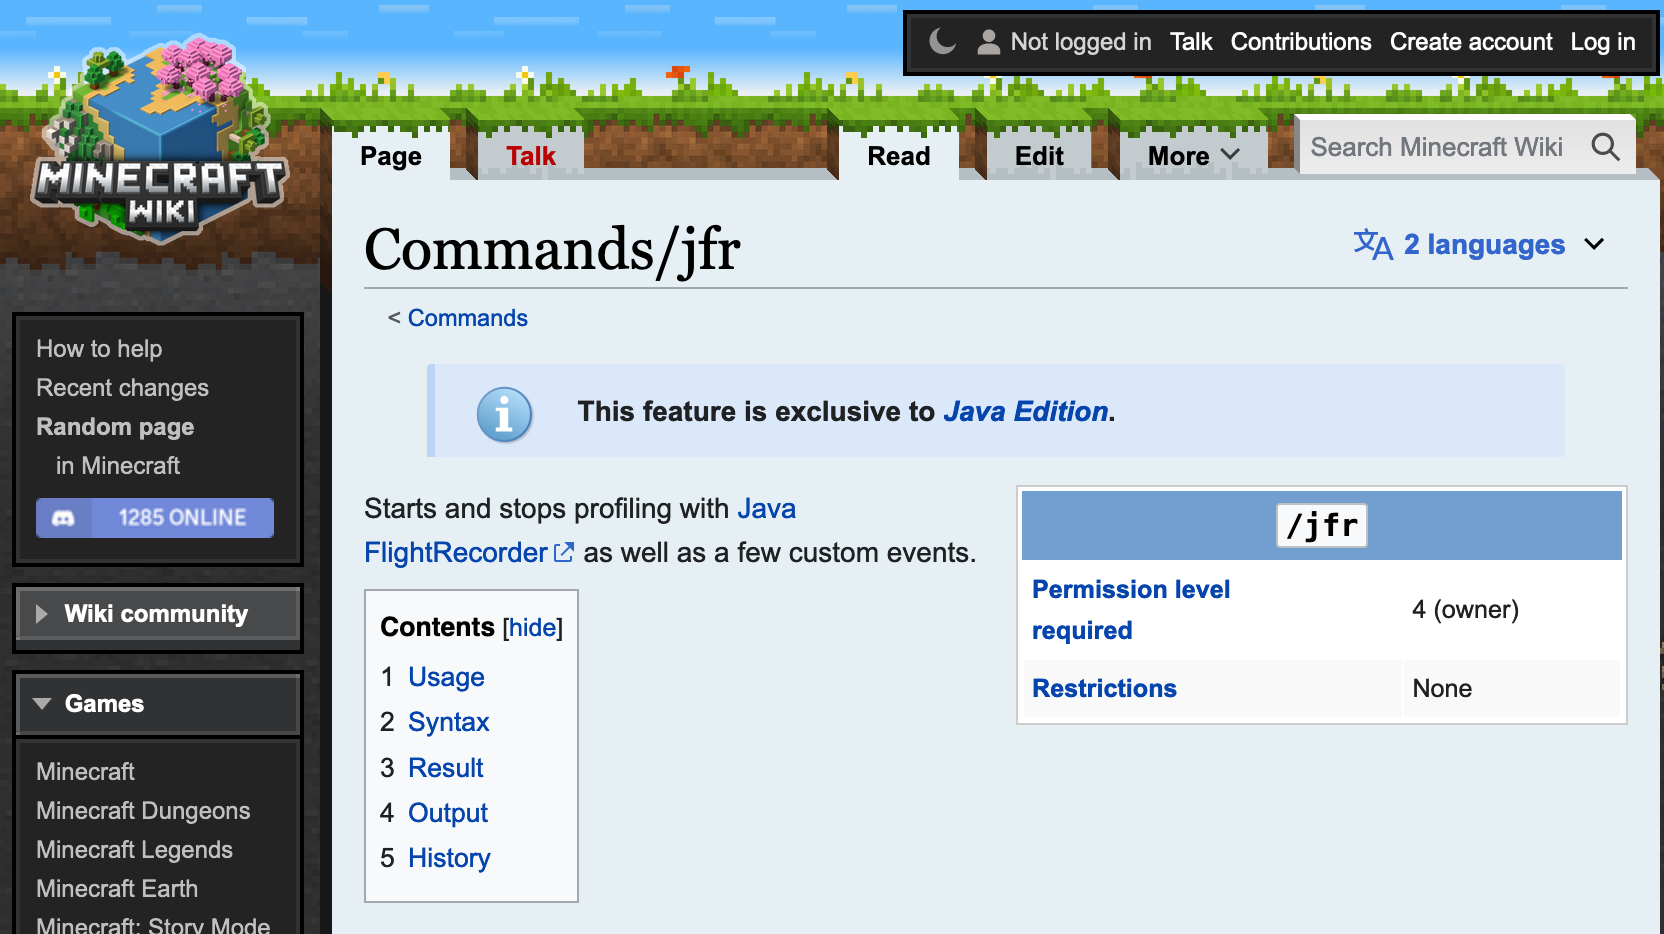
This, of course, intrigued me, especially as Minecraft apparently adds some custom JFR events:

So I had to check it out. I downloaded and started the Java server, got a demo account, and connected to my local instance. This works with a demo account when you launch the demo world, enable the cheat mode in the settings, kick yourself via “/kick @p,” and then select your own server. I found this via this bug report.

You then must ensure that you have OP privileges and add them, if not via the Minecraft server shell. Then, you can type /jfr start in the chat (launch it by typing T) to start the recording and /jfr stop to stop it.

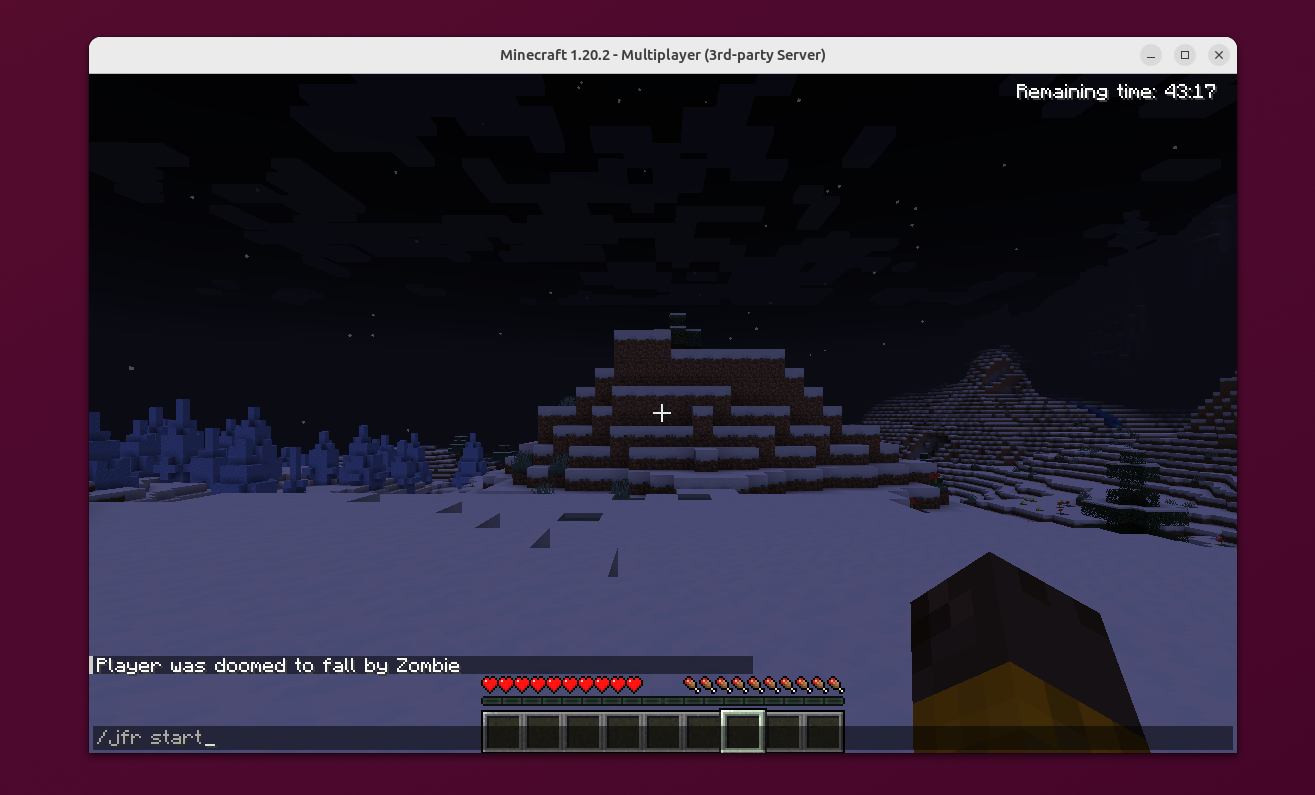
You see that it’s my first time “playing” Minecraft, and I’m great at getting attacked. It’s probably also my last time.

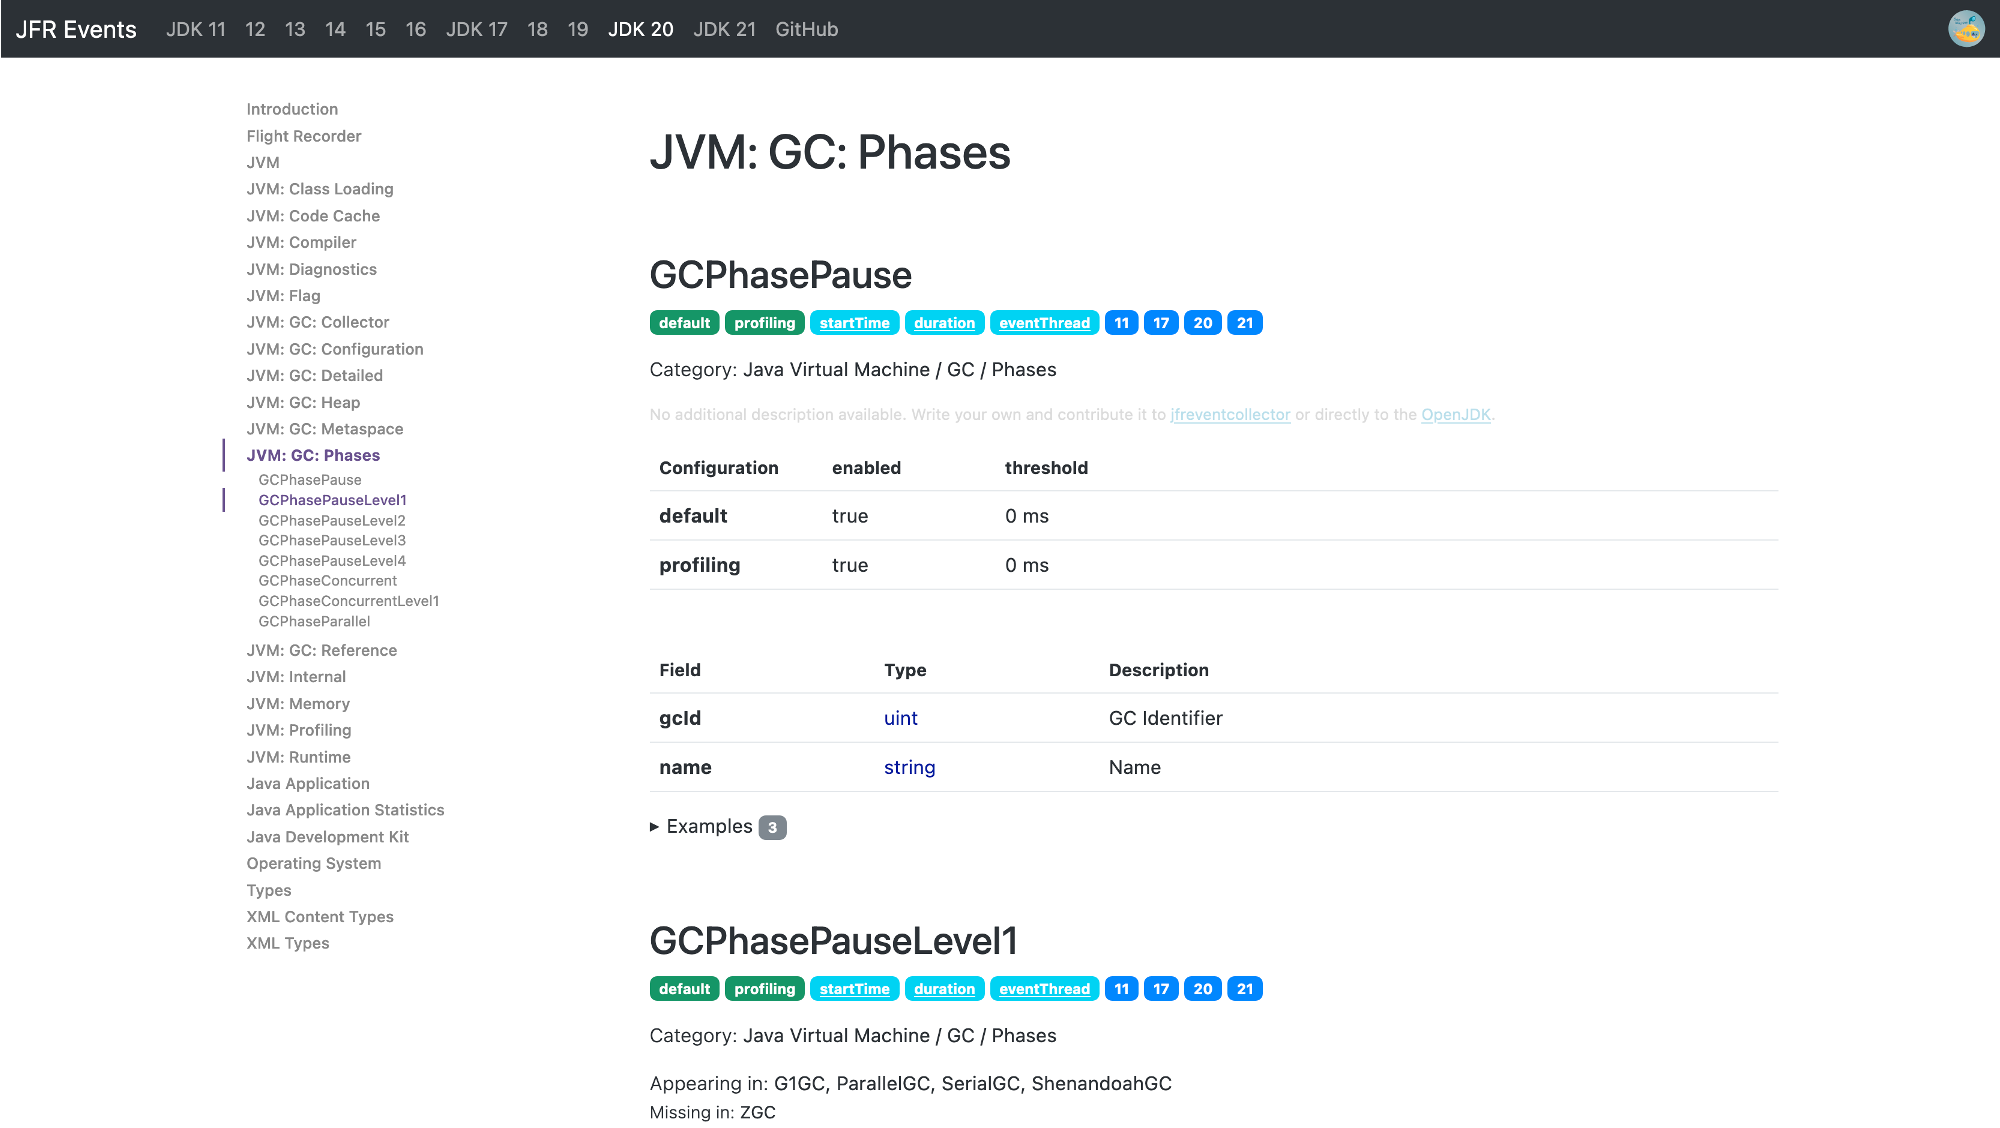
Minecraft stores the JFR file in the debug folder in the working directory of your server, both as a JFR file and as a JSON file. You can view the JFR file in a JFR viewer of your choice, like JMC or my IntelliJ JFR plugin (web view of the file, JFR file itself), and explore the custom JFR events:

This lets you get insights into the chunk generation and specific traffic patterns of the Minecraft server.

But what does the event specification look like? We could disassemble the Minecraft JAR and potentially get into legal trouble, or we could just use the jfr utility with its metadata command and get an approximation of the event definition from the JFR metadata:

jfr metadata debug/server-2023-11-17-155349.jfr | \
    grep minecraft --after-context=40

The ChunkGeneration event looks as follows:

@Name("minecraft.ChunkGeneration")
@Label("Chunk Generation")
@Category({"Minecraft", "World Generation"})
class ChunkGeneration extends jdk.jfr.Event {
  @Label("Start Time")
  @Timestamp("TICKS")
  long startTime;

  @Label("Duration")
  @Timespan("TICKS")
  long duration;

  @Label("Event Thread")
  @Description("Thread in which event was committed in")
  Thread eventThread;

  @Label("Stack Trace")
  @Description("Stack Trace starting from the method the event was committed in")
  StackTrace stackTrace;

  @Label("First Block X World Position")
  int worldPosX;

  @Label("First Block Z World Position")
  int worldPosZ;

  @Label("Chunk X Position")
  int chunkPosX;

  @Label("Chunk Z Position")
  int chunkPosZ;

  @Label("Status")
  String status;

  @Label("Level")
  String level;
}

You can find all defined events here. The actual implementation of these events is only slightly larger because some events accumulate data over a period of time.

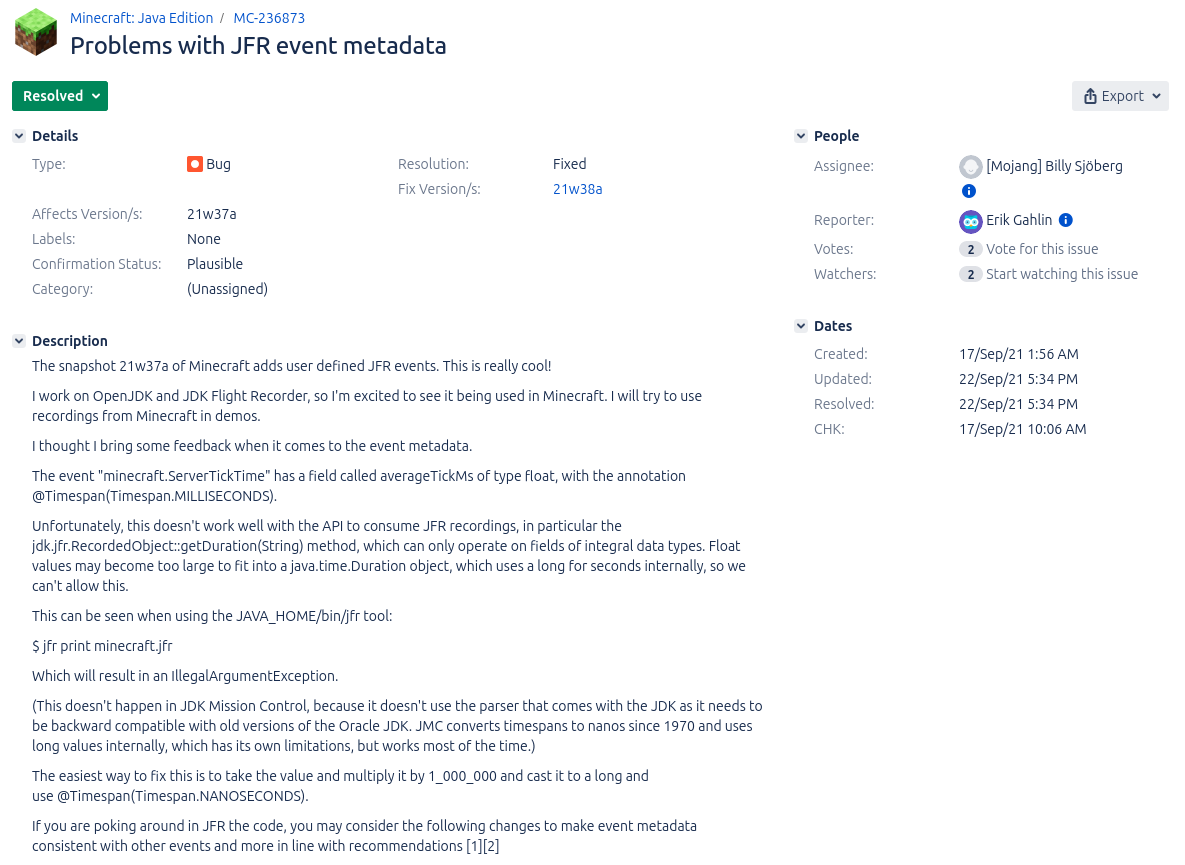
I’m, of course, not the first OpenJDK developer who stumbled upon these custom events. Erik Gahlin even found them shortly after their addition in 2021 and promptly created an issue to recommend improvements (see MC-236873):

Conclusion

In my previous blog post, I showed you how to create custom JFR events for a small sample application. Seeing custom events in Minecraft shows you that custom events are used in the wild by applications used by millions of users, helping developers improve the performance of their applications.

If you’re looking for more information on custom JFR events, I would recommend reading my previous blog post Custom JFR Events: A Short Introduction and Gunnar Morlings Monitoring REST APIs with Custom JDK Flight Recorder Events article. See you in a couple of days with a new blog post on JFR event configuration.

This article is part of my work in the SapMachine team at SAP, making profiling and debugging easier for everyone.

Custom JFR Events: A Short Introduction

JDK Flight Recorder (JFR) is one of the two prominent open-source profilers for the OpenJDK (besides async-profiler). It offers many features (see Profiling Talks) and the ability to observe lots of information by recording over one hundred different events. If you want to know more about the existing events, visit my JFR Event Collection website (related blog post):

Besides these built-in events, JFR allows you to implement your events to record custom information directly in your profiling file.

Let’s start with a small example to motivate this. Consider for a moment that we want to run the next big thing after Software-as-a-Service: Math-as-a-Service, a service that provides customers with the freshest Fibonacci numbers and more.

We develop this service using Javalin:

public static void main(String[] args) throws Exception {
    // create a server with 4 threads in the thread pool                                                                               
    Javalin.create(conf -> {                                                  
            conf.jetty.server(() ->                                           
                new Server(new QueuedThreadPool(4))                           
            );                                                                
            })                                                                
            .get("/fib/{fib}", ctx -> {                                       
                handleRequest(ctx, newSessionId());                           
            })                                                                
            .start(7070);                                                     
    System.in.read();                                                         
}                                                                             
                                                                              
static void handleRequest(Context ctx, int sessionId) {                       
    int n = Integer.parseInt(ctx.pathParam("fib"));
    // log the current session and n                           
    System.out.printf("Handle session %d n = %d\n", sessionId, n);            
    // compute and return the n-th fibonacci number                                                        
    ctx.result("fibonacci: " + fib(n));                                                                                                 
}                                                                             
                                                                              
public static int fib(int n) {                                                
    if (n <= 1) {                                                             
        return n;                                                             
    }                                                                         
    return fib(n - 1) + fib(n - 2);                                           
}                                                                                                                                                     

This is a pretty standard tiny web endpoint, minus all the user and session handling. It lets the customer query the n-th Fibonacci number by querying /fib/{n}. Our built-in logging prints n and the session ID on standard out, but what if we want to store it directly in our JFR profile while continuously profiling our application?

This is where custom JFR events come in handy:

public class SessionEvent extends jdk.jfr.Event {
    int sessionId;
    int n;

    public SessionEvent(int sessionId, int n) {
        this.sessionId = sessionId;
        this.n = n;
    }
}

The custom event class extends the jdk.jfr.Event class and simply define a few fields for the custom data. These fields can be annotated with @Label("Human readable label") and @Description("Longer description") to document them.

We can now use this event class to record the relevant data in the handleRequest method:

static void handleRequest(Context ctx, int sessionId) {            
    int n = Integer.parseInt(ctx.pathParam("fib"));                
    System.out.printf("Handle session %d n = %d\n", sessionId, n);
    // create event 
    var event = new SessionEvent(sessionId, n);
    // add start and stacktrace                   
    event.begin();                                                 
    ctx.result("fibonacci: " + fib(n));
    // add end and store                          
    event.commit();                                                
}                                                                  

This small addition records the timing and duration of each request, as well as n and the session ID in the JFR profile. The sample code, including a request generator, can be found on GitHub. After we ran the server, we can view the recorded events in a JFR viewer, like JDK Mission Control or my JFR viewer (online view):

This was my short introduction to custom JFR events; if you want to learn more, I highly recommend Gunnar Morlings Monitoring REST APIs with Custom JDK Flight Recorder Events article. Come back next week for a real-world example of custom JFR events.

This article is part of my work in the SapMachine team at SAP, making profiling and debugging easier for everyone.

Let’s create a Python Debugger together: PyData Talk

A small addendum to the previous five parts of my journey down the Python debugger rabbit hole (part 1, part 2, part 3, part 4, and part 5).

I gave a talk on this topic, based on my blog posts, at PyData Karlsruhe:

You can find all the source code of the demos here. It was a great pleasure giving this talk, and the audience received it well.

This might be the end of my journey into Python debuggers, but I feel some untold topics are out there. So, if you have any ideas, feel free to comment. See you in my next blog post and possibly at the next Python conference that accepts my talk proposal.

The presentation was part of my work in the SapMachine team at SAP, making profiling and debugging easier for everyone.

Let’s create a Python Debugger together: Tiny Addendum (exec and __name__)

A small addendum to the previous four parts of my journey down the Python debugger rabbit hole (part 1, part 2, part 3, and part 4).

I tried the debugger I finished last week on a small sample application for my upcoming talk at the PyData Südwest meet-up, and it failed. The problem is related to running the file passed to the debugger. Consider that we debug the following program:

def main():
    print("Hi")

if __name__ == "__main__":
    main()

We now set the breakpoint in the main method when starting the debugger and continuing with the execution of the program. The problem: It never hits the breakpoint. But why? Because it never calls the main method.

The cause of this problem is that the __name__ variable is set to dbg2.py (the file containing the code is compiling and running the script). But how do we run the script? We use the following (based on a Real Python article):

_globals = globals().copy()

# ...

class Dbg:
  
   # ...   
    
   def run(self, file: Path):
        """ Run a given file with the debugger """
        self._main_file = file
        # see https://realpython.com/python-exec/#using-python-for-configuration-files
        compiled = compile(file.read_text(), filename=str(file), mode='exec')
        sys.argv.pop(0)
        sys.breakpointhook = self._breakpoint
        self._process_compiled_code(compiled)
        exec(compiled, _globals)

This code uses the compile method to compile the code, telling this method that the file belongs to the program file.

The mode argument specifies what kind of code must be compiled; it can be 'exec' if source consists of a sequence of statements, 'eval' if it consists of a single expression, or 'single' if it consists of a single interactive statement (in the latter case, expression statements that evaluate to something other than None will be printed).

Python Documentation for The Mode Argument of the Compile Method

We then remove the first argument of the program because it is the debugged file in the case of the debugger and run some post-processing on the compiled code object. This is the reason why we can’t just use eval. Finally, we use exec to execute the compiled code with the global variables that we had before creating the Dbg class and others.

The problem is that exec it doesn’t set the import-related module attributes, such as __name__ and __file__ properly. So we have to emulate these by adding global variables:

        exec(compiled, _globals | 
                      {"__name__": "__main__", "__file__": str(file)})

It makes of course sense that exec behaves this way, as it is normally used to evaluate code in the current context.

With this now fixed, it is possible to debug normal applications like the line counter that I use in my upcoming talk at the 16th November in Karlsruhe.

I hope you liked this short addendum and see you next time with a blog post on something more Java-related.

Let’s create a Python Debugger together: Part 4 (Python 3.12 edition)

The fourth part of my journey down the Python debugger rabbit hole (part 1, part 2, and part 3).

In this article, we’ll be looking into how changes introduced in Python 3.12 can help us with one of the most significant pain points of our current debugger implementation: The Python interpreter essentially calls our callback at every line of code, regardless if we have a breakpoint in the currently running method. But why is this the case?

Continue reading

Let’s create a Python Debugger together: Part 3 (Refactoring)

This is the necessary third part of my journey down the Python debugger rabbit hole; if you’re new to the series, please take a look at part 1 and part 2 first.

I promised in the last part of this series that I’ll show you how to use the new Python APIs. However, some code refactoring is necessary before I can finally proceed. The implementation in dbg.py mixes the sys.settrace related code and code that can be reused for other debugging implementations. So, this is a short blog post covering the result of the refactoring. The code can be found in dbg2.py.

Continue reading

Who killed the JVM? Attaching a debugger twice

A few weeks back, I told you about on-demand debugging in my Level-up your Java Debugging Skills with on-demand Debugging blog post, enabling you to delay a debugging session till:

  • You gave orders via jcmd (onjcmd=y option), a feature contributed by the SapMachine team
  • the program threw a specific exception (onthrow=<exception>)
  • The program threw an uncaught exception (onuncaught=y)

This is quite useful because the JDWP agent has to do substantial initialization before it can start listening for the attaching debugger:

The triggering event invokes the bulk of the initialization, including creation of threads and monitors, transport setup, and installation of a new event callback which handles the complete set of events.

Comment in JDWP-agent Source Code

Other things, like class loading, were slower with an attached debugger in older JDK versions (see JDK-8227269).

But what happens after you end the debugging session? Is your debugged program aborted, and if not, can you reattach your debugger at a later point in time? The answer is as always: It depends. Or, more precisely: It depends on the remote debugger you’re using and how you terminate the debugging session.

But why should you disconnect and then reattach a debugger? It allows you to not run the debugger during longer ignorable stretches of your application’s execution. The overhead of running the JDWP agent waiting for a connection is minimal compared to the plethora of events sent from the agent to the debugger during a debugging session (like class loading events, see A short primer on Java debugging internals).

Before we cover how to (re)attach a debugger in IDEs, we’ll see how this works on the JDWP/JDI level:

On JVM Level

The JDWP agent does not prevent the debugger from reattaching. There are two ways that Debugging sessions can be closed by the debugger: dispose and exit. Disposing of a connection via the JDWP Dispose command is the least intrusive way. This command is exposed to the debugger in JDI via the VirtualMachine#dispose() method:

Invalidates this virtual machine mirror. The communication channel to the target VM is closed, and the target VM prepares to accept another subsequent connection from this debugger or another debugger, including the following tasks:

Any current method invocations executing in the target VM are continued after the disconnection. Upon completion of any such method invocation, the invoking thread continues from the location where it was originally stopped.

JDI Documentation

This essentially means that disposing of a debugging connection does not prevent the currently debugged application from continuing to run.

The other way is using the exit command, exposed as VirtualMachine#exit(int exitCode):

Causes the mirrored VM to terminate with the given error code. All resources associated with this VirtualMachine are freed. If the mirrored VM is remote, the communication channel to it will be closed.

JDI DOCUMENTATION

This, of course, prevents the debugger from reattaching.

Reattaching with IDEs

NetBeans, IntelliJ IDEA, and Eclipse all support reattaching after ending a debugging session by just creating a new remote debugging session. Be aware that this only works straightforwardly when using remote debugging, as the local debugging UI is usually directly intertwined with the UI for running the application. I would recommend trying remote debugging once in a while, even when debugging on your local machine, to be able to use all the advanced features.

Terminating an Application with IDEs

NetBeans is the only IDE of the three that does not support this (as far as I can ascertain). IntelliJ IDEA and Eclipse both support it, with Eclipse having the more straight-forward UI:

If the terminate button is not active, then you might have to tick the Allow termination of remote VM check-box in the remote configuration settings:

IntelliJ IDEA’s UI is, in this instance, arguably less discoverable: To terminate the application, you have to close the specific debugging session tab explicitly.

This then results in a popup that offers you the ability to terminate:

Conclusion

The ability to disconnect and then reattach debuggers is helpful for many complex debugging scenarios and can help you debug faster. Being able to terminate the application directly from the debugger is an additional time saver when working with remote debugging sessions. Both are often overlooked gems of Java debugging, showing once more how versatile the JDWP agent and UI debuggers are.

I hope you enjoyed this addendum to my Level-up your Java Debugging Skills with on-demand Debugging blog post. If you want even more debugging from me, come to my talk on debugging at JUG Karlsruhe on the 7th of November, to the ConFoo conference in Montreal on the 23rd of February, and hopefully, next year a conference or user group near you.

This article is part of my work in the SapMachine team at SAP, making profiling and debugging easier for everyone. It was supported by rainy weather and the subsequent afternoon in a cafe in Bratislava: