Hello eBPF: First steps with libbpf (5)

Welcome back to my blog series on eBPF. Two weeks ago, I showed you how to write your own eBPF application using my hello-ebpf library based on libbcc. This week, I show you why using libbcc is not the best idea and start working with the newer libbpf.

With my current libbcc-based approach, we essentially embed the executed eBPF program into our programs as a string into our applications and compile them on the fly for every run:

public class HelloWorld {
    public static void main(String[] args) {
        try (BPF b = BPF.builder("""
                int kprobe__sys_clone(void *ctx) {
                   bpf_trace_printk("Hello, World!");
                   return 0;
                }
                """).build()) {
            b.trace_print();
        }
    }
}

Problems with Libbcc

Using libbcc and porting the Python wrapper made it easy to start developing a user-land Java library and offers some syntactic sugar, but it has major disadvantages, to quote Andrii Nakryiko:

  • Clang/LLVM combo is a big library, resulting in big fat binaries that need to be distributed with your application.
  • Clang/LLVM combo is resource-heavy, so when you are compiling BPF code at start up, you’ll use a significant amount of resources, potentially tipping over a carefully balanced production workfload. And vice versa, on a busy host, compiling a small BPF program might take minutes in some cases.
  • BPF program testing and development iteration is quite painful as well, as you are going to get even most trivial compilation errors only in run-time, once you recompile and restart your user-space control application. This certainly increases friction and is not helping to iterate fast.
BPF Portability and CO-RE by Andrii Nakryiko

Additionally, the libbcc binaries in the official Ubuntu package repositories are outdated, so we’re accumulating technical debt using them.

BPF-based Library

So what is the alternative? We compile the embedded C code in our application to eBPF bytecode at build time using a custom annotation processor and load the bytecode using libbpf at run-time:

This allows us to create self-contained JARs that will eventually neatly package our eBPF application.

With this new chapter of the hello-ebpf project, I am trying to create a proper Java API that

  • builds on top of libbpf
  • isn’t bound to mimic the Python API, thus making it easier to understand for Java developers
  • is tested with a growing number of tests so that it is safe to use
  • prefers usability (and a small API) over speed

The annotation processor for this lives in the bpf-processor, and the central part of the library is in the bpf folder. It is in its earliest stages, but you can expect more features and tests in the following months.

HelloWorld Example

Writing programs with libbpf is not too dissimilar to using my libbcc wrapper:

@BPF // annotation to trigger the BPF annotation processor
public abstract class HelloWorld extends BPFProgram {
    
    // eBPF program code that is compiled at build
    // time using clang
    static final String EBPF_PROGRAM = """
            #include "vmlinux.h"
            #include <bpf/bpf_helpers.h>
            #include <bpf/bpf_tracing.h>
                            
            SEC ("kprobe/do_sys_openat2")
            int kprobe__do_sys_openat2(struct pt_regs *ctx){                                                             
                bpf_printk("Hello, World from BPF and more!");
                return 0;
            }
                            
            char _license[] SEC ("license") = "GPL";
            """;

    public static void main(String[] args) {
        // load an instance of the HelloWorld implementation
        try (HelloWorld program = BPFProgram.load(HelloWorld.class)) {
            // attach to the kprobe
            program.autoAttachProgram(
                program.getProgramByName("kprobe__do_sys_openat2"));
            program.tracePrintLoop(f -> 
                String.format("%d: %s: %s", (int)f.ts(), f.task(), f.msg()));
        }
    }
}

Running this class via ./run_bpf.sh HelloWorld will then print the following:

3385: irqbalance: Hello, World from BPF and more!
3385: C2 CompilerThre: Hello, World from BPF and more!

The annotation processor created an implementation of the HelloWorld class, which overrides the getByteCode method:

public final class HelloWorldImpl extends HelloWorld {
    /**
     * Base64 encoded gzipped eBPF byte-code
     */
    private static final String BYTE_CODE = "H4sIAA...n5q6hfQNFV+sgDAAA=";

    @Override
    public byte[] getByteCode() {
        return Util.decodeGzippedBase64(BYTE_CODE);
    }
}

Compiler Errors

But what happens when you make a mistake in your eBPF program, for example, not writing a semicolon after the bpf_printk call? Then, the annotation processor throws an error at build-time and prints the following error message when calling mvn package:

Processing BPFProgram: me.bechberger.ebpf.samples.HelloWorld
Obtaining vmlinux.h header file
Could not compile eBPF program
HelloWorld.java:[19,66]  error: expected ';' after expression
    bpf_printk("Hello, World from BPF and more!")
                                                 ^
                                                 ;
1 error generated.

The annotation processor compiles the eBPF program using Clang and post-processes the error messages to show the location in the Java program. Using libbcc, we only get this error at run-time, which makes finding these issues far harder.

Conclusion

Using libbpf instead of libbcc has many advantages: Smaller, self-contained JARs, better developer support, and a more modern library. The hello-ebpf project will evolve to focus on libbpf to become a fully functional and tested eBPF user-land library. Using an annotation processor offers so many possibilities, so stay tuned.

Thanks for joining me on this journey to create a proper Java API for eBPF. I’ll see you in two weeks for the next installment in this series, and possibly before for a trip report on my current travels.

This article is part of my work in the SapMachine team at SAP, making profiling and debugging easier for everyone. This article was written in Canada, thanks to ConFoo and Theresa Mammarella, who made this trip possible. Inspiration came from Ansil H’s series on eBPF.

Hello eBPF: Tail calls and your first eBPF application (4)

Please be aware that this blog post uses the discontinued libbcc-based API in hello-ebpf.

Welcome back to my blog series on eBPF. Two weeks ago, I showed you how to use perf event buffers to stream data from the eBPF program to the Java application. This week, we will finish chapter 2 of the Learning eBPF book, learn how to use tail calls and the hello-ebpf project as a library and implement one of the book’s exercises. We start with function and tail calls:

Function Calls

Regular C programs are divided into functions that call each other; so far in this series, all our eBPF programs consist of just a single function that calls kernel functions. But can we call other eBPF functions? End of 2017, Daniel Borkman et al. introduced the ability to call other functions defined in eBPF:

It allows for better optimized code and finally allows to introduce the core bpf libraries that can be reused in different projects, since programs are no longer limited by single elf file. With function calls bpf can be compiled into multiple .o files.

bpf: introduce function calls by Alexei Starovoitov

Before this change, you had to inline the functions essentially. There is just one problem with this approach: Every new function call takes space on the stack for its call frame that contains its parameters and local variables:

The maximum stack size is limited to 512 bytes, so every call frame counts for larger eBPF programs. Modern compilers will, therefore, try to inline the function calls and save space. To reduce the required stack memory, we have essentially two options besides inlining: We can either use static variables or tail calls. Andrii Nakryiko describes the former:

Starting with Linux 5.2, d8eca5bbb2be (“bpf: implement lookup-free direct value access for maps”) adds support for BPF global (and static) variables, which we are going to use here to get rid of on-the-stack array.

BPF tips & tricks: the guide to bpf_trace_printk() and bpf_printk()

Declaring a variable as static, e.g. static int x, means that the value is stored as a global variable, existing once per program run. This is not a problem if a function doesn’t transitively call itself, which is true for all functions you would typically want to write in eBPF.

Tail Calls

Now to tail calls. If the function calls another function directly before returning (or as an argument to the return statement), then the call frames can be replaced. This is called a tail call and avoids growing the stack. In eBPF, it is possible to tail call one eBPF program (entry function that gets passed a context) from another program:

From ebpf.io‘s section on tail calls

A tail call is achieved by storing the other program in a program array, which maps a 4-byte int to an eBPF program. The kernel function bpf_tail_call(ctx, program_array, index) can then be used to call a specific program:

This special helper is used to trigger a “tail call”, or in other words, to jump into another eBPF program. The same stack frame is used (but values on stack and in registers for the caller are not accessible to the callee). This mechanism allows for program chaining, either for raising the maximum number of available eBPF instructions, or to execute given programs in conditional blocks. For security reasons, there is an upper limit to the number of successive tail calls that can be performed.

Upon call of this helper, the program attempts to jump into a program referenced at index index in prog_array_map, a special map of type BPF_MAP_TYPE_PROG_ARRAY, and passes ctx, a pointer to the context.

BPF-HELPERS(7)

This function only returns when it encounters an error, returning a negative error code.

Tail Call Example

Let’s create, as an example, an entry function that is triggered for every system call and tail calls another function using the stored ebpf programs for each system call number, based on the example in the Learning eBPF book:

BPF_PROG_ARRAY(syscall, 300);

int hello(struct bpf_raw_tracepoint_args *ctx) {
    // args[1] is here the syscall number
    int nr = ctx->args[1];
    // this is the BCC syntax for bpf_tail_call
    syscall.call(ctx, nr);
    // we only reach the print if the
    // syscall number is not associated
    // with a function
    bpf_trace_printk("Another syscall: %d", nr);
    return 0;
}

int hello_exec(void *ctx) {
    bpf_trace_printk("Executing a program");
    return 0;
}

int hello_timer(struct bpf_raw_tracepoint_args *ctx) {
    int nr = ctx->args[1];
    switch (nr) {
        case 222:
            bpf_trace_printk("Creating a timer");
            break;
        case 226:
            bpf_trace_printk("Deleting a timer");
            break;
        default:
            bpf_trace_printk("Some other timer operation");
            break;
    }
    return 0;
}

int ignore_nr(void *ctx) {
    return 0;
}

We can now store a function for every system call in the syscall program array, register the hello for every system call and tail call the specified function for every system call number.

You can find this example in the hello-ebpf repository. This includes all the Java code required to attach the eBPF program and log the result. I could just show you the example code, but let’s do something different this time:

Tail Example Application

I recently released the hello-ebpf library, which mainly consists of the bcc and annotation libraries, in Sonatype’s snapshot repository. Let’s use these releases to create our first application. This first application is a version of the HelloTail example from before.

We start by cloning my new sample-bcc-project, which we subsequently modify. This sample project contains essentially the following three parts:

  • src/main/java/Main.java: Main class for our Maven-based build
  • pom.xml: Maven pom that uses the snapshot repository to depend on the me.bechberger.bcc library. It also allows you to build a JAR with all dependencies included via mvn package.
  • run.sh: run the built JAR with the required flags “–enable-preview –enable-native-access=ALL-UNNAMED
  • README.md: Information on how to run the program and more.

We only have to change the Main class to develop our application, adding our system-call-logging-related code. Our application should be able only to log execve, and itimer-related system calls when passed the --skip-others flag on the command line. So, we start with implementing the argument parsing:

record Arguments(boolean skipOthers) {
    static Arguments parseArgs(String[] args) {
        boolean skipOthers = false;
        if (args.length > 0) {
            if (args.length == 1 && args[0].equals("--skip-others")) {
                skipOthers = true;
            } else {
                // print usage for all other arguments, this
                // includes --help
                System.err.println("""
                Usage: app [--skip-others]
                    
                   --skip-others: Only log execve and itimer system calls
                """);
                System.exit(1);
            }
        }
        return new Arguments(skipOthers);
    }
}

We then define the eBPF program, as well as some system calls that come up a lot, as static variables:

static final String EBPF_PROGRAM = """
            ...
            """;

static final int[] IGNORED_SYSCALLS = new int[]{
        21, 22, 25, 29, 56, 57, 63, 64, 66,
        72, 73, 79, 98, 101, 115, 131, 134,
        135, 139, 172, 233, 280, 291};

Now to the important part: The main and run methods that contain the central part of our application:

public static void main(String[] args) {
    run(Arguments.parseArgs(args));
}

static void run(Arguments args) {
    try (var b = BPF.builder(EBPF_PROGRAM).build()) {
        // attach to the tracepoint that is
        // called at the start of every system call
        b.attach_raw_tracepoint("sys_enter", "hello");
        
        // get the function ids of all defined functions
        var ignoreFn = b.load_raw_tracepoint_func("ignore_nr");
        var execFn = b.load_raw_tracepoint_func("hello_exec");
        var timerFn = b.load_raw_tracepoint_func("hello_timer");
        
        // obtain the program array
        var progArray = b.get_table("syscall", 
            BPFTable.ProgArray.createProvider());
        
        // map the system call execve to the hello_exec function
        progArray.set(Syscalls.getSyscall("execve").number(), 
                      execFn);
        
        // map the itimer system calls to the hello_timer function
        for (String syscall : new String[]{
                "timer_create", "timer_gettime",
                "timer_getoverrun", "timer_settime",
                "timer_delete"}) {
            progArray.set(Syscalls.getSyscall(syscall).number(), 
                          timerFn);
        }

        // ignore some system calls that come up a lot
        for (int i : IGNORED_SYSCALLS) {
            progArray.set(i, ignoreFn);
        }
        
        // print the trace using a custom formatter
        b.trace_print(f -> formatTrace(f, args.skipOthers));
    }
}

This code uses the Syscalls class from the bcc library to map system calls to their number. The only part left now is the custom formatter, which takes care of the –skip-others option:

static @Nullable String formatTrace(BPF.TraceFields f, 
  boolean skipOthers) {       
    String another = "Another syscall: ";                                          
    String line = f.line().replace("bpf_trace_printk: ", "");                      
    // replace other syscall with their names                                      
    if (line.contains(another)) {                                                  
        // skip these lines if --skip-others is passed                             
        if (skipOthers) {                                                          
            return null;                                                           
        }                                                                          
        var syscall =                                                              
                Syscalls.getSyscall(                                               
                        Integer.parseInt(                                          
                                line.substring(                                    
                                        line.indexOf(another) +                    
                                                another.length())));               
        return line.replace(another + syscall.number(),                            
                another + syscall.name());                                         
    }                                                                              
    return line;                                                                   
}                                                                                  

This gives us an application that we can build via mvn package, and run:

> sudo -s PATH=$PATH                                                   
> ./run.sh --skip-others                                               
     ps-26459   [031] ...2. 91897.197604: Executing a program          
    git-26551   [052] ...2. 91935.368240: Executing a program          
    git-26553   [031] ...2. 91935.373159: Executing a program          
    git-26555   [016] ...2. 91935.378132: Executing a program          
  <...>-26558   [053] ...2. 91935.383839: Executing a program          
   tail-26561   [004] ...2. 91935.388621: Executing a program          
    git-26562   [099] ...2. 91935.388970: Executing a program
   ...          
> ./run.sh                                                      
  <...>-3277    [122] ...2. 91946.796677: Another syscall: recvmsg     
   Xorg-3045    [121] ...2. 91946.796678: Another syscall: setitimer   
  <...>-26461   [074] ...2. 91946.796680: Another syscall: readlink    
   Xorg-3045    [121] ...2. 91946.796680: Another syscall: epoll_wait  
  <...>-3457    [068] ...2. 91946.796681: Another syscall: recvmsg     
  <...>-3277    [122] ...2. 91946.796682: Another syscall: recvmsg     
  <...>-26461   [074] ...2. 91946.796684: Another syscall: readlink    
  <...>-3277    [122] ...2. 91946.796685: Another syscall: recvmsg     
  <...>-3457    [068] ...2. 91946.796689: Another syscall: recvmsg     
  <...>-3277    [122] ...2. 91946.796690: Another syscall: recvmsg
  ...   

You can run this either on a Linux machine with Java 21 and libbcc installed or on Mac using the Lima VM:

> limactl start hello-ebpf.yaml
> limactl shell hello-ebpf
> sudo -s
> ./run.sh
# ...

More information and the whole implementation in the System Call Logger branch of the sample-bcc-project.

Conclusion

In this blog post, I showed you how to use tail calls and develop your first standalone eBPF application using the hello-ebpf library. Most of the bcc implementation was present two weeks ago when I wrote my previous blog post of this series, but now it’s slightly more polished. The hello-ebpf libaries’ releases are currently live in the snapshot repository.

Now, on to you: There are exercises at the end of chapter 2 of the Learning eBPF book. Can you implement them on your own? Clone the sample-bcc-project and give it a try. I’m happy to showcase any cool forks in my next blog post.

Thanks for joining me on this journey to create a proper Java API for eBPF. I’m looking forward to finishing porting the whole bcc API and starting with the next iteration of this project. I’ll keep you posted; see you in my next post.

This article is part of my work in the SapMachine team at SAP, making profiling and debugging easier for everyone.

Is JDWP’s onjcmd feature worth using?

A few months ago, I told you about the onjcmd feature in my blog post Level-up your Java Debugging Skills with on-demand Debugging (which is coming to JavaLand 2024). The short version is that adding onjcmd=y to the list of JDWP options allows you to delay accepting the incoming connection request in the JDWP agent until jcmd <JVM pid> VM.start_java_debugging is called.

The main idea is that the JDWP agent

  1. only listens on the debugging port after it is triggered, which could have some security benefits
  2. and that the JDWP agent causes less overhead while waiting, compared to just accepting connections from the beginning.

The first point is debatable; one can find arguments for and against it. But for the second point, we can run some benchmarks. After renewed discussions, I started benchmarking to conclude whether the onjcmd feature improves on-demand debugging performance. Spoiler alert: It doesn’t.

Benchmarks

As for the benchmarks, I chose to run the Renaissance benchmark suite (version 0.15.0):

Renaissance is a modern, open, and diversified benchmark suite for the JVM, aimed at testing JIT compilers, garbage collectors, profilers, analyzers and other tools.

Renaissance is a benchmarking suite that contains a range of modern workloads, comprising of various popular systems, frameworks and applications made for the JVM.

Renaissance benchmarks exercise a range of programming paradigms, including concurrent, parallel, functional and object-oriented programming.

RENAISSANCE.DEV

Renaissance typically runs the sub-benchmarks in multiple iterations. Still, I decided to run the sub-benchmarks just once per Renaissance run (via -r 1) and instead run Renaissance itself ten times using hyperfine to get a proper run-time distribution. I compared three different executions of Renaissance for this blog post:

  • without JDWP: Running Renaissance without any debugging enabled, to have an appropriate baseline, via java -jar renaissance.jar all -r 1
  • with JDWP: Running Renaissance in debugging mode, with the JDWP agent accepting debugging connections the whole time without suspending the JVM, via java -agentlib:jdwp=transport=dt_socket,server=y,suspend=n,address=*:5005 -jar renaissance.jar all -r 1
  • with onjcmd: Running Renaissance in debugging mode, with the JDWP agent accepting debugging connections only after the jcmd call without suspending the JVM, via java -agentlib:jdwp=transport=dt_socket,server=y,suspend=n,onjcmd=y,address=*:5005 -jar renaissance.jar all -r 1

Remember that we never start a debugging session or use jcmd, as we’re only interested in the performance of the JVM while waiting for a debugging connection in the JDWP agent.

Yes, I know that Renaissance uses different iteration numbers for the sub-benchmarks, but this should not affect the overall conclusions from the benchmark.

Results

Now to the results. For a current JDK 21 on my Ubuntu 23.10 machine with a ThreadRipper 3995WX CPU, hyperfine obtains the following benchmarks:

Benchmark 1: without JDWP
  Time (mean ± σ):     211.075 s ±  1.307 s    [User: 4413.810 s, System: 1438.235 s]
  Range (min … max):   209.667 s … 213.361 s    10 runs

Benchmark 2: with JDWP
  Time (mean ± σ):     218.985 s ±  1.924 s    [User: 4533.024 s, System: 1133.126 s]
  Range (min … max):   216.673 s … 222.249 s    10 runs

Benchmark 3: with onjcmd
  Time (mean ± σ):     219.469 s ±  1.185 s    [User: 4537.213 s, System: 1181.856 s]
  Range (min … max):   217.824 s … 221.316 s    10 runs

Summary
  "without JDWP" ran
    1.04 ± 0.01 times faster than "with JDWP"
    1.04 ± 0.01 times faster than "with onjcmd"

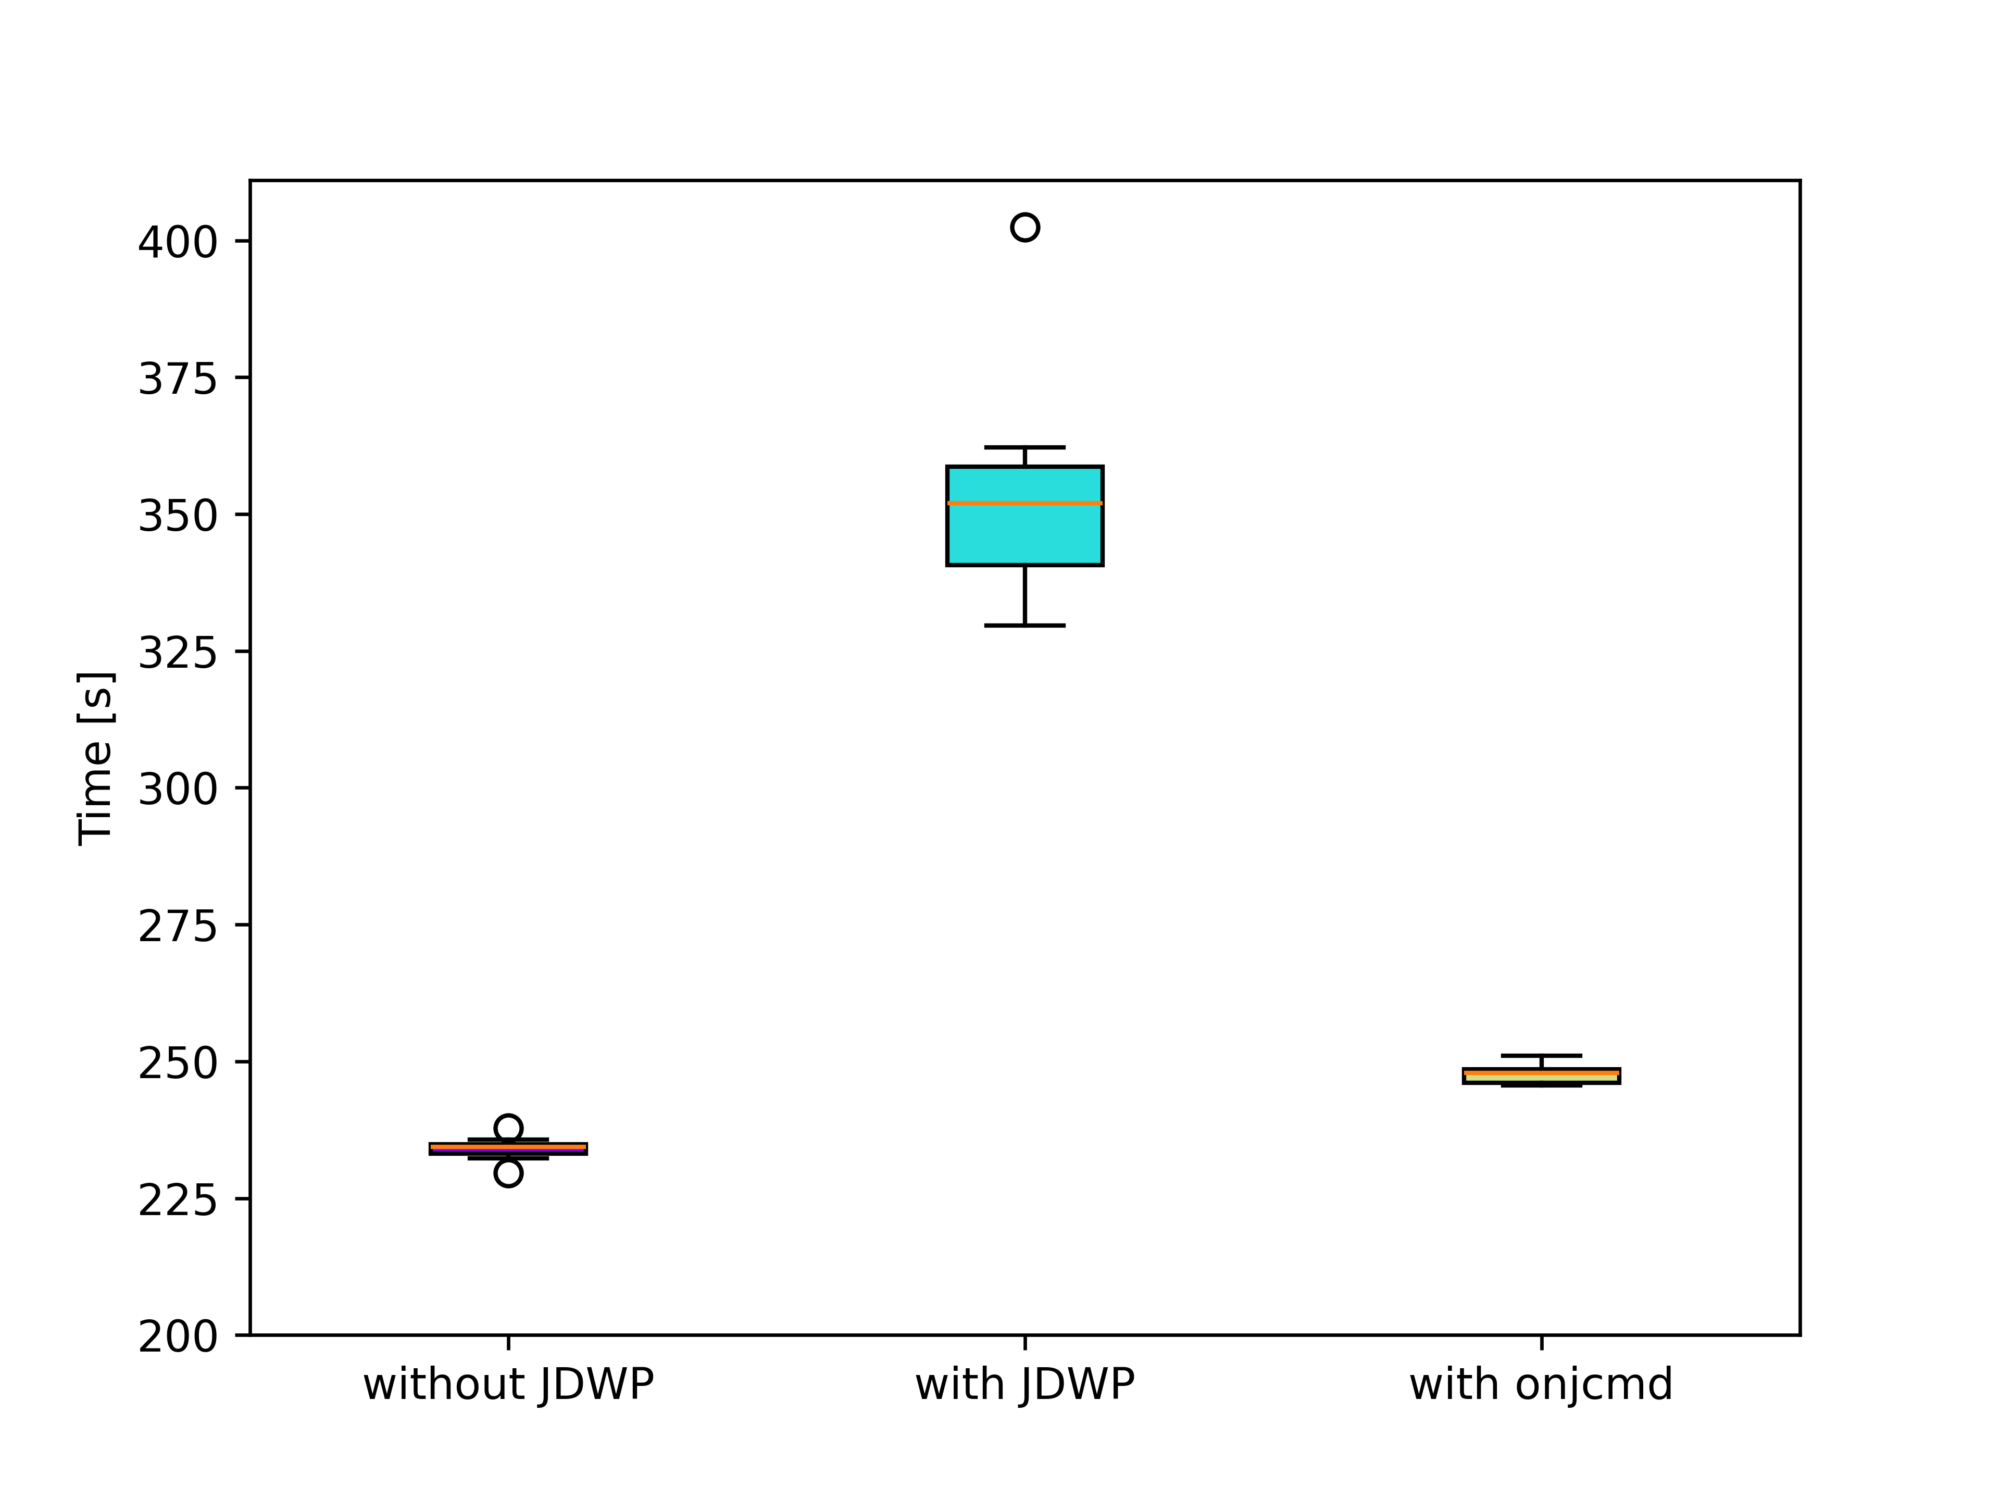
You can see that the run-time difference between “with JDWP” and “with onjcmd” is 0.5s, way below the standard deviations of both benchmarks. Plotting the benchmark results using box plots visualizes this fact:

Or, more analytically, Welch’s t-test doesn’t rule out the possibility of both benchmarks producing the same run-time distribution with p=0.5. There is, therefore, no measurable effect on the performance if we use the onjcmd feature. But what we do notice is that enabling the JDWP agent results in an increase in the run-time by 4%.

The question is then: Why has it been implemented in the JDK at all? Let’s run Renaissance on JDK 11.0.3, the first release supporting onjcmd.

Results on JDK 11.0.3

Here, using onjcmd results in a significant performance improvement of a factor of 1.5 (from 354 to 248 seconds) compared to running the JDWP agent without it:

Benchmark 1: without JDWP
  Time (mean ± σ):     234.011 s ±  2.182 s    [User: 5336.885 s, System: 706.926 s]
  Range (min … max):   229.605 s … 237.845 s    10 runs
 
Benchmark 2: with JDWP
  Time (mean ± σ):     353.572 s ± 20.300 s    [User: 4680.987 s, System: 643.978 s]
  Range (min … max):   329.610 s … 402.410 s    10 runs
 
Benchmark 3: with onjcmd
  Time (mean ± σ):     247.766 s ±  1.907 s    [User: 4690.555 s, System: 609.904 s]
  Range (min … max):   245.575 s … 251.026 s    10 runs
Summary
  "without JDWP" ran
    1.06 ± 0.01 times faster than "with onjcmd"
    1.51 ± 0.09 times faster than "with JDWP"

We excluded the finagle-chirper sub-benchmark here, as it causes the run-time to increase drastically. The sub-benchmark alone does not cause any problems, so the GC run possibly causes the performance hit before the sub-benchmark, which cleans up after the dotty sub-benchmark. Dotty is run directly before finagle-chirper.

Please be aware that the run sub-benchmarks on JDK 11 differ from the run on JDK 21, so don’t compare it to the results for JDK 21.

But what explains this difference?

Fixes since JDK 11.0.3

Between JDK 11.0.3 and JDK 21, there have been improvements to the OpenJDK, some of which drastically improved the performance of the JVM in debugging mode. Most notable is the fix for JDK-8227269 by Roman Kennke. The issue, reported by Egor Ushakov, reads as follows:

Slow class loading when running with JDWP

When debug mode is active (-agentlib:jdwp), an application spends a lot of time in JVM internals like Unsafe.defineAnonymousClass or Class.getDeclaredConstructors.Sometimes this happens on EDT and UI freezes occur.

If we look into the code, we’ll see that whenever a new class is loaded and an event about it is delivered, when a garbage collection has occurred, classTrack_processUnloads iterates over all loaded classes to see if any of them have been unloaded. This leads to O(classCount * gcCount) performance, which in case of frequent GCs (and they are frequent, especially the minor ones) is close to O(classCount^2). In IDEA, we have quite a lot of classes, especially counting all lambdas, so this results in quite significant overhead.

JDK-8227269

This change came into the JDK with 11.0.9. We see the 11.0.3 results with 11.0.8, but with 11.0.9, we see the results of the current JDK 11:

Benchmark 1: without JDWP
  Time (mean ± σ):     234.647 s ±  2.731 s    [User: 5331.145 s, System: 701.760 s]
  Range (min … max):   228.510 s … 238.323 s    10 runs
 
Benchmark 2: with JDWP
  Time (mean ± σ):     250.043 s ±  3.587 s    [User: 4628.578 s, System: 716.737 s]
  Range (min … max):   242.515 s … 254.456 s    10 runs
 
Benchmark 3: with onjcmd
  Time (mean ± σ):     249.689 s ±  1.765 s    [User: 4788.539 s, System: 729.207 s]
  Range (min … max):   246.324 s … 251.559 s    10 runs
 
Summary
  "without JDWP" ran
    1.06 ± 0.01 times faster than "with onjcmd"
    1.07 ± 0.02 times faster than "with JDWP"

This clearly shows the significant impact of the change. 11.0.3 came out on Apr 18, 2019, and 11.0.9 on Jul 15, 2020, so the onjcmd improved on-demand debugging for almost a year.

Want to try this out yourself? Get the binaries from SapMachine and run the benchmarks yourself. This kind of performance archaeology is quite rewarding, giving you insights into critical performance issues.

Conclusion

A few years ago, it was definitely a good idea to add the onjcmd feature to have usable on-demand debugging performance-wise. But nowadays, we can just start the JDWP agent to wait for a connection and connect to it whenever we want to, without any measurable performance penalty (in the Renaissance benchmark).

This shows us that it is always valuable to reevaluate if specific features are worth the maintenance cost. I hope this blog post gave you some insights into the performance of on-demand debugging. See you next week for the next installment in my hello-ebpf series.

This article is part of my work in the SapMachine team at SAP, making profiling and debugging easier for everyone.

Let’s create a Python Debugger together: FOSDEM Talk

A small addendum to the previous six parts of my journey down the Python debugger rabbit hole (part 1, part 2, part 3, part 4, part 5, and part 6).

I gave a talk on the topic of Python 3.12’s new monitoring and debugging API at FOSDEM’s Python Devroom:

Furthermore, I’m excited to announce my acceptance to PyCon Berlin this year. When I started my blog series last year, I would’ve never dreamed of speaking at a large Python conference. I’m probably the only OpenJDK developer there, but I’m happy to meet many new people from a different community.

This article is part of my work in the SapMachine team at SAP, making profiling and debugging easier for everyone.