The Inner Workings of Safepoints

A Java thread in the JVM regularly checks whether it should do extra work besides the execution of the bytecode. This work is done during so-called safepoints. There are two types of safepoints: local and global. At thread-local safepoints, also known as thread-local handshakes, only the current thread does some work and is therefore blocked from executing the application. At global safepoints, all Java threads are blocked and do some work. At these safepoints, the state of the thread (thread-local safepoints) or the JVM (global safepoints) is fixed. This allows the JVM to do activities like method deoptimizations or stop-the-world garbage collections, where the amount of concurrency should be limited.

But this blog post isn’t about what (global) safepoints are; for this, please refer to Nitsan Wakart’s and Seetha Wenner’s articles on this topic and for thread-local safepoints, which are a relatively recent addition to JEP 312. I’ll cover in this post the actual implementation of safepoints in the OpenJDK and present a related bug that I found along the way.

Update: FOSDEM talk

I gave a talk on the topic of this blog post at FOSDEM 2024’s Free Java Devroom:

Implementing Safepoint Checks

Global safepoints are implemented using thread-local safepoints by stopping the threads at thread-local safepoints till all threads reach a barrier (source code), so we only have thread-local checks. Therefore I’ll only cover thread-local safepoints here and call them “safepoints.”

The simplest option for implementing safepoint checks would be to add code like

if (thread->at_safepoint()) {
  SafepointMechanism::process();
}

to every location where a safepoint check should occur. The main problem is its performance. We either add lots of code or wrap it in a function and have a function call for every check. We can do better by exploiting the fact that the check often fails, so we can optimize for the fast path of “thread not at safepoint”. The OpenJDK does this by exploiting the page protection mechanisms of modern CPUs (source) in JIT compiled code:

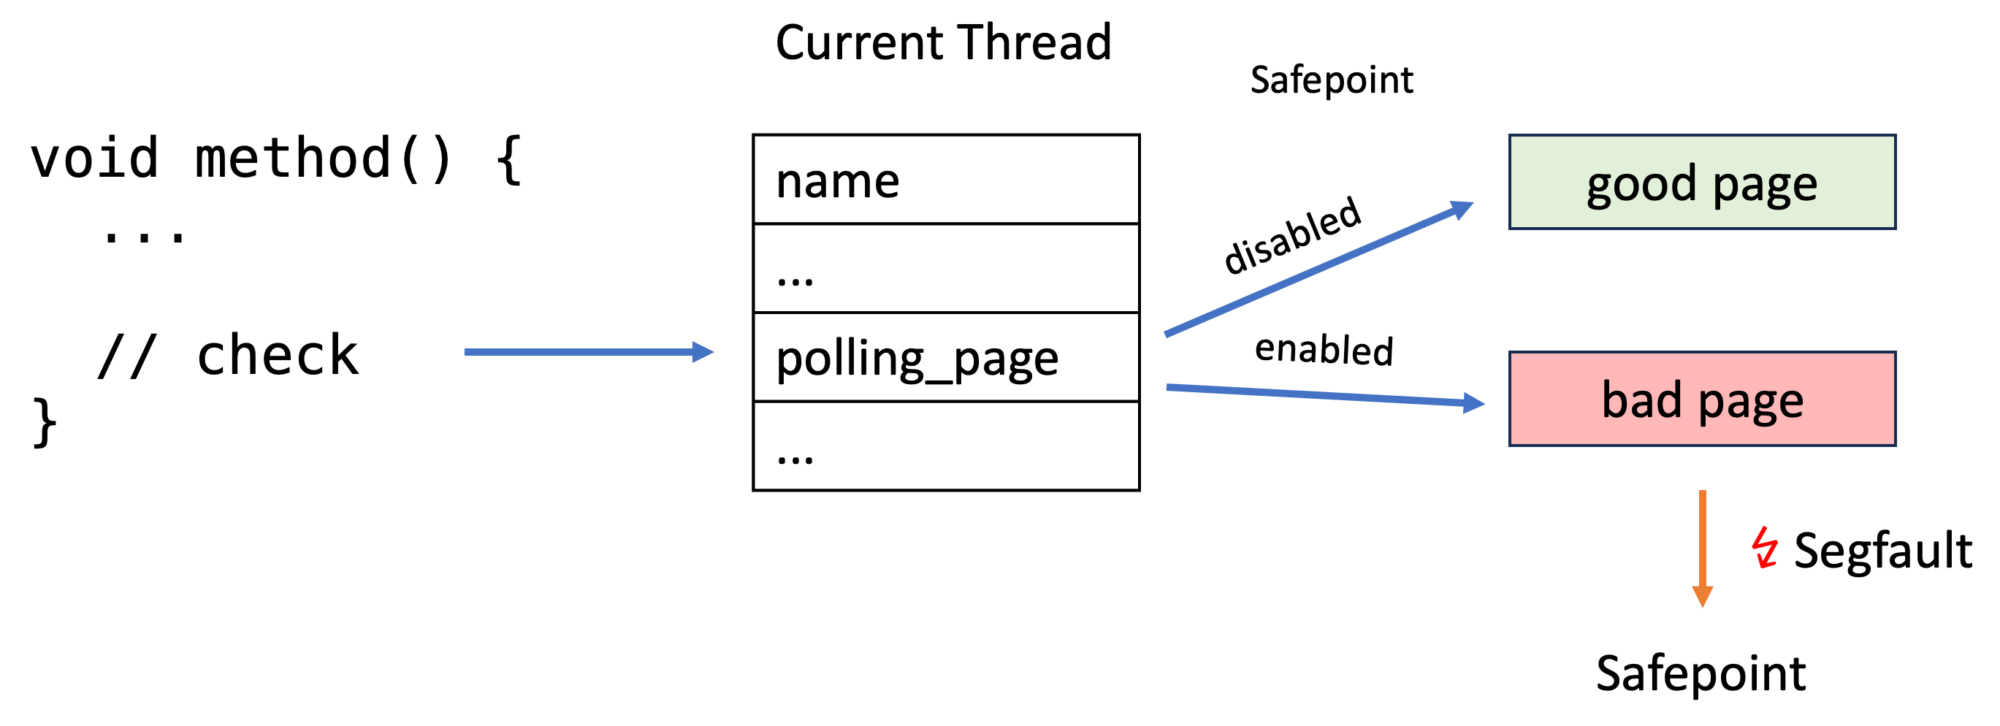
The JVM creates a good and a bad page/memory area for every thread before a thread executes any Java code (source):

char* bad_page  = polling_page;
char* good_page = polling_page + page_size;

os::protect_memory(bad_page,  page_size, os::MEM_PROT_NONE);
os::protect_memory(good_page, page_size, os::MEM_PROT_READ);
//...
_poll_page_armed_value    = 
  reinterpret_cast<uintptr_t>(bad_page);
_poll_page_disarmed_value = 
  reinterpret_cast<uintptr_t>(good_page);

The good page can be accessed without issues, but accessing the protected bad page causes an error. os::protect_memory uses the mprotect method under the hood:

mprotect() changes the access protections for the calling
process's memory pages [...].

If the calling process tries to access memory in a manner that
violates the protections, then the kernel generates a SIGSEGV
signal for the process.

prot is a combination of the following access flags: PROT_NONE or
a bitwise-or of the other values in the following list:

  PROT_NONE     The memory cannot be accessed at all.
  PROT_READ     The memory can be read.
  PROT_WRITE    The memory can be modified.
[...]

Now every thread has a field _polling_page which points to either the good page (safepoint check fails) or the bad page (safepoint check succeeds). The segfault handler of JVM then calls the safepoint handler code. Handling segfaults is quite expensive, but this is only used on the slow path; the fast path consists only of reading from the address that _polling_page points to.

In addition to simple safepoints, which trigger indiscriminate of the current program state, Erik Österlund added functionality to parametrize safepoints with JEP 376: The safepoint can be configured to cause a successful safepoint only if the current frame is older than the specified frame, based on the frame pointer. The frame pointer of the specified frame is called a watermark.

Keep in mind that stacks grow from higher to lower addresses. But how is this implemented? It is implemented by adding a _polling_word field next to the _poll_page field to every thread. This polling word specifies the watermark and is checked in the safepoint handler. The configured safepoints are used for incremental stack walking.

The cool thing is that (source) that when enabling the regular safepoint, one sets the watermark to 1 and for disarming it to ~1 (1111...10), so the fp > watermark is always true when the safepoint is enabled (fp > 1 is always true) and false when disabled (fp > 111...10 is always false). Therefore, we can use the same checks for both kinds of safepoints.

More on watermarks and how they can be used to reduce the latency of garbage collectors can be found in the video by Erik:

Bug with Interpreted Aarch64 Methods

The OpenJDK uses multiple compilation tiers; methods can be interpreted or compiled; see Mastering the Art of Controlling the JIT: Unlocking Reproducible Profiler Tests for more information. A common misconception is that “interpreted” means that the method is evaluated by a kind of interpreter loop that has the basic structure:

for (int i = 0; i < byteCode.length; i++) {
  switch (byteCode[i].op) {
    case OP_1:
    ...
  }
}

The bytecode is actually compiled using a straightforward TemplateInterpreter, which maps every bytecode instruction to a set of assembler instructions. The compilation is fast because there is no optimization, and the evaluation is faster than a traditional interpreter.

The TemplateInterpreter adds safepoint checks whenever required, like method returns. All return instructions are mapped to assembler instructions by the TemplateTable::_return(TosState state) method. On x86, it looks like (source):

void TemplateTable::_return(TosState state) {
  // ...
  if (_desc->bytecode() == Bytecodes::_return_register_finalizer){
     // ... // finalizers
  }

  if (_desc->bytecode() != Bytecodes::_return_register_finalizer){
    Label no_safepoint;
    NOT_PRODUCT(__ block_comment("Thread-local Safepoint poll"));
    // ...
    __ testb(Address(r15_thread, 
               JavaThread::polling_word_offset()), 
             SafepointMechanism::poll_bit());
    // ...
    __ jcc(Assembler::zero, no_safepoint);
    __ push(state);
    __ push_cont_fastpath();
    __ call_VM(noreg, CAST_FROM_FN_PTR(address,
                        InterpreterRuntime::at_safepoint));
    __ pop_cont_fastpath();
    __ pop(state);
    __ bind(no_safepoint);
  }
  // ...
  __ remove_activation(state, rbcp);

  __ jmp(rbcp);
}

This adds the safepoint check using the simple method without page faults (for some reason, I don’t know why), ensuring that a safepoint check is done at the return of every method.

We can therefore expect that when a safepoint is triggered in the interpreted_method in

interpreted_method();
compiled_method();

that the safepoint is handled at least at the end of the method; in our example, the method is too small to have any other safepoints. Yet on my M1 MacBook, the safepoint is only handled in the compiled_method. I found this while trying to fix a bug in safepoint-dependent serviceability code. The cause of the problem is that the TemplateTable::_return(TosState state) is missing the safepoint check generation on aarch64 (source):

void TemplateTable::_return(TosState state)
{
  // ...
  if (_desc->bytecode() == Bytecodes::_return_register_finalizer){
    // ... // finalizers
  }

  // Issue a StoreStore barrier after all stores but before return
  // from any constructor for any class with a final field. 
  // We don't know if this is a finalizer, so we always do so.
  if (_desc->bytecode() == Bytecodes::_return)
    __ membar(MacroAssembler::StoreStore);

  // ...
  __ remove_activation(state);
  __ ret(lr);
}

And no the remove_activation method doesn’t check for the safepoint, it only checks for the safepoint (and therefore whether a watermark is set) and calls the InterpreterRuntime::at_unwind method to deal with unwinding of a frame which is related to a watermark. It does not call any safepoint handler related methods.

The same issue is prevalent in the OpenJDK’s riscv and arm ports. The real-world implications of this bug are minor, as the interpreted methods without any inner safepoint checks (in loops, calls to compiled methods, …) seldom run long enough to matter.

I’m neither an expert on the TemplateInterpreter nor on the different architectures. Maybe there are valid reasons to omit this safepoint check on ARM. But if there are not, then it should be fixed; I propose adding something like the following directly before if (_desc->bytecode() == Bytecodes::_return) for aarch64 (source):

  if (_desc->bytecode() != Bytecodes::_return_register_finalizer){
    Label slow_path;
    Label fast_path;
    __ safepoint_poll(slow_path, true /* at_return */,
         false /* acquire */, false /* in_nmethod */);
    __ br(Assembler::AL, fast_path);
    __ bind(slow_path);
    __ call_VM(CAST_FROM_FN_PTR(address, 
         InterpreterRuntime::at_safepoint), rthread);
    __ bind(fast_path);
  }

Update: Thanks to Leela Mohan Venati on Twitter for spotting that at_safepoint has to be called using call_VM and not super_call_VM_leaf, because at_safepoint is defined using JRT_ENTRY.

I’m happy to hear the opinion of any experts on this topic, the related bug is JBS-8313419.

Conclusion

Understanding the implementation of safepoints can be helpful when working on the OpenJDK. This blog post showed the inner workings, focusing on a bug in the TemplateInterpreter related to the safepoints checks.

Thank you for being with me on this journey down a rabbit hole, and see you next week with a blog post on profiling APIs.

This post is part of my work in the SapMachine team at SAP, making profiling easier for everyone. Thanks to Richard Reingruber, Matthias Baesken, Jaroslav Bachorik, Lutz Schmitz, and Aleksey Shipilëv for their invaluable input.

jmethodIDs in Profiling: A Tale of Nightmares

jmethodIDs identify methods in many low-level C++ JVM API methods (JVMTI). These ids are used in debugging related methods like SetBreakpoint(jvmtiEnv*,jmethodID,jlocation) and, of course, in the two main profiling APIs in the OpenJDK, GetStackTrace, and AsyncGetCallTrace (ASGCT):

JVMTI has multiple helper methods to get the methods name, signature, declaring class, modifiers, and more for a given jmethodID. Using these IDs is, therefore, an essential part of developing profilers but also a source of sorrow:

Honestly, I don’t see a way to use jmethodID safely.

Jaroslav Bachorik, profiler developer

In this blog post, I will tell you about the problems of jmethodID that keep profiler writers awake at night and how I intend to remedy the situation for profiler writers in JEP 435.

Background

But first: What are jmethodIDs, and how are they implemented?

[A jmethodID] identifies a Java programming language method, initializer, or constructor. jmethodIDs returned by JVMTI functions and events may be safely stored. However, if the class is unloaded, they become invalid and must not be used.

JVMTI SPECIFICATION

In OpenJDK, they are defined as pointers to an anonymous struct (source). Every Java method is backed by an object of the Method class in the JDK. jmethodIDs are actually just pointing to a pointer that points to the related method object (source):

This indirection creates versatility: The jmethodID stays the same when methods are redefined (see Instrumenting Java Code to Find and Handle Unused Classes for an example of a Java agent which redefines classes).

This is not true for jclass, the jmethodID pendant for classes that points directly to a class object:

The jclass becomes invalid if the class is redefined.

jmethodIDs are allocated on demand because they can stay with the JVM till the defining class is unloaded. The indirections for all ids are stored in the jmethodID cache of the related class (source). This cache has a lock to guard its parallel access from different threads, and the cache is dynamically sized (similar to the ArrayList implementation) to conserve memory.

OpenJ9 also uses an indirection (source), but my understanding of the code base is too limited to make any further claims, so the rest of the blog post is focused on OpenJDK. Now over to the problems for profiler writers:

Problems

The fact that jmethodIDs are dynamically allocated in resizable caches causes major issues: Common profilers, like async-profiler, use AsyncGetCallTrace, as stated in the beginning. ASGCT is used inside signal handlers where obtaining a lock is unsupported. So the profiler has to ensure that every method that might appear in a trace (essentially every method) has an allocated jmethodID before the profiling starts. This leads to significant performance issues when attaching profilers to a running JVM. This is especially problematic in OpenJDK 8:

[…] the quadratic complexity of creating new jmethodIDs during class loading: for every added jmethodID, HotSpot runs a linear scan through the whole list of previously added jmethodIDs trying to find an empty slot, when there are usually none. In extreme cases, it took hours (!) to attach async-profiler to a running JVM that had hundreds thousands classes: https://github.com/async-profiler/async-profiler/issues/221

Andrei Pangin, developer of Async-Profiler

A jmethodID becomes invalid when its defining class is unloaded. Still, there is no way for a profiler to know when a jmethodID becomes invalid or even get notified when a class is unloaded. So processing a newly observed jmethodID and obtaining the name, signature, modifiers, and related class, should be done directly after obtaining the id. But this is impossible as all accessor methods allocate memory and thereby cannot be used in signal handlers directly after AsyncGetCallTrace invocations.

As far as I know, methods can be unloaded concurrently to
the native code executing JVMTI functions. This introduces a potential race
condition where the JVM unloads the methods during the check->use flow,
making it only a partial solution. To complicate matters further, no method
exists to confirm whether a jmethodID is valid.

Theoretically, we could monitor the CompiledMethodUnload event to track
the validity state, creating a constantly expanding set of unloaded
jmethodID values or a bloom filter, if one does not care about few
potential false positives. This strategy, however, doesn’t address the
potential race condition, and it could even exacerbate it due to possible
event delays. This delay might mistakenly validate a jmethodID value that
has already been unloaded, but for which the event hasn’t been delivered
yet.

Honestly, I don’t see a way to use jmethodID safely unless the code using
it suspends the entire JVM and doesn’t resume until it’s finished with that
jmethodID. Any other approach might lead to JVM crashes, as we’ve
observed with J9.

Jaroslav Bachorik ON ThE OpenJDK MailingList

(Concurrent) class unloading, therefore, makes using all profiling APIs inherently unsafe.

jclass ids suffer from the same problems, but ses, we could just process all jmethodIDs and jclass ids, whenever a class is loaded and store all information on all classes, but this would result in a severe performance penalty, as only a subset of all methods actually appears in the observed traces. This approach feels more like a hack.

While jmethodIDs are pretty helpful for other applications like writing debuggers, they are unsuitable for profilers. As I’m currently in the process of developing a new profiling API, I started looking into replacements for jmethodIDs that solve all the problems mentioned before:

Solution

My solution to all these problems is ASGST_Method and ASGST_Class, replacements for jmethodID and jclass, with signal-safe helper methods and a proper notification mechanism for class, unloads, and redefinitions.

The level of indirection that jmethodID offers is excellent, but directly mapping ASGST_Method to method objects removes the problematic dynamic jmethodID allocations. The main disadvantage is that class redefinitions cause a method to have a new ASGST_Method id and a new ASGST_Class id. We solve this the same way JFR solves it:

We use a class local id (idnum) for every method and a JVM internal class idnum, which are both redefinition invariant. The combination of class and method idnum (cmId) is then a unique id for a method. The problem with this approach is that mapping a cmId to an ASGST_Method or a method object is prohibitively expensive as it requires the JVM to check all methods of all classes. Yet this is not a problem in the narrow space of profiling, as a self-maintained mapping from a cmId to collected method information is enough.

The primary method for getting the method information, like name and signature, is ASGST_GetMethodInfo in my proposal:

// Method info
// You have to preallocate the strings yourself 
// and store the lengths in the appropriate fields, 
// the lengths are set to the respective
// string lengths by the VM, 
// be aware that strings are null-terminated
typedef struct {
  ASGST_Class klass;
  char* method_name;
  jint method_name_length;
  char* signature;
  jint signature_length;
  char* generic_signature;
  jint generic_signature_length;
  jint modifiers;
  jint idnum; // class local id, doesn't change with redefinitions
  jlong class_idnum; // class id that doesn't change
} ASGST_MethodInfo;

// Obtain the method information for a given ASGST_Method and 
// store it in the pre-allocated info struct.
// It stores the actual length in the *_len fields and 
// a null-terminated string in the string fields.
// A field is set to null if the information is not available.
//
// Signal safe
void ASGST_GetMethodInfo(ASGST_Method method,
                         ASGST_MethodInfo* info);

jint ASGST_GetMethodIdNum(ASGST_Method method);

The similar ASGST_Class related is ASGST_GetClassInfo:

// Class info, like the method info
typedef struct {
  char* class_name;
  jint class_name_length;
  char* generic_class_name;
  jint generic_class_name_length;
  jint modifiers;
  jlong idnum; // id, doesn't change with redefinitions
} ASGST_ClassInfo;

// Similar to GetMethodInfo
//
// Signal safe
void ASGST_GetClassInfo(ASGST_Class klass,
                        ASGST_ClassInfo* info);

jlong ASGST_GetClassIdNum(ASGST_Class klass);

Both methods return a subset of the information available through JVMTI methods. The only information missing that is required for profilers is the mapping from method byte-code index to line number:

typedef struct {
  jint start_bci;
  jint line_number;
} ASGST_MethodLineNumberEntry;

// Populates the method line number table, 
// mapping BCI to line number.
// Returns the number of written elements
//
// Signal safe
int ASGST_GetMethodLineNumberTable(ASGST_Method method, 
  ASGST_MethodLineNumberEntry* entries, int length); 

All the above methods are signal safe so the profiler can process the methods directly. Nonetheless, I propose conversion methods so that the profiler writer can use jmethodIDs and jclass ids whenever needed, albeit with the safety problems mentioned above:

jmethodID ASGST_MethodToJMethodID(ASGST_Method method);

ASGST_Method ASGST_JMethodIDToMethod(jmethodID methodID);

jclass ASGST_ClassToJClass(ASGST_Class klass);

ASGST_Class ASGST_JClassToClass(jclass klass);

The last part of my proposal deals with invalid class and method ids: I propose a call-back for class unloads, and redefinitions, which is called shortly before the class and the method ids become invalid. In this handler, the profiler can execute its own code, but no JVMTI methods and only the ASGST_* methods that are signal-safe.

Remember that the handler can be executed concurrently, as classes can be unloaded concurrently. Class unload handlers must have the following signature:

void ASGST_ClassUnloadHandler(ASGST_Class klass, 
  ASGST_Method *methods, int count, bool redefined, void* arg);

These handlers can be registered and deregistered:

// Register a handler to be called when class is unloaded
//
// not signal and safe point safe
void ASGST_RegisterClassUnloadHandler(
  ASGST_ClassUnloadHandler handler, void* arg);

// Deregister a handler to be called when a class is unloaded
// @returns true if handler was present
//
// not signal and safe point safe
bool ASGST_DeregisterClassUnloadHandler(
  ASGST_ClassUnloadHandler handler, void* arg);

The arg parameter is passed directly to the handler as context information. This is due to the non-existence of proper closures or lambdas in C.

You might wonder we my API would allow multiple handlers. This is because a JVM should support multiple profilers at once.

Conclusion

jmethodIDs are unusable for profiling and cause countless errors, as every profiler will tell you. In this blog post, I offered a solution I want to integrate into the new OpenJDK profiling API (JEP 435). My proposal provides the safety that profiler writers crave. If you have any opinions on this proposal, please let me know. You can find a draft implementation can be found on GitHub.

See you next week with a blog post on safe points and profiling.

This project is part of my work in the SapMachine team at SAP, making profiling easier for everyone. Thanks to Martin Dörr, Andrei Pangin, and especially Jaroslav Bachorik for their invaluable input on my proposal and jmethodIDs.

I could write a blog post, or …

My goal is to write a blog post every two weeks, it’s great to stick to a schedule and force yourself to publish pieces even if they are not perfect. This doesn’t mean that these blog posts are terrible, just that they could need a bit more polish or could cover a bit more of the topic. But I know many people that have dozens of half-finished blog posts in their pipeline, which aren’t just there and so they don’t publish anything for months. Having a rather strict schedule pushes me to create content early and often, helping me to finalize and write down my ideas on a regular basis.

But sometimes… Well sometimes I’m behind schedule (didn’t write a blog post this week and the week before) and I could force myself to write a blog post, or …

… just climb up a castle and enjoy being around friends, looking into the sunset. A blog post can wait a week, but life can’t:

Life is what happens to us while we are making other plans.

Allen Saunders, John Lennon

So go out, visit the world, have friends, and read my blog post on flame-graph construction mid-next week.

This blog post was not supported by SAP, just by my awesome friends who rented accommodation for 30 people near Falkenstein to have a nice weekend.