Redacting Sensitive Data from Java Flight Recorder Files

I few weeks ago, I showed you how to read and write JFR files programmatically. This week we’re using the covered basic-jfr-professor to create a fully fledged (yet still experimental) JFR and hserr file redaction tool called jfr-redact.

Duke the Java mascot redacting information on a sheet of paper using a black marker

TL;DR: Download jfr-redact from GitHub and redact sensitive information like user names, tokens, and keys from files via:

# Using the JAR directly
java -jar jfr-redact.jar redact recording.jfr

# Redact text files
java -jar jfr-redact.jar redact-text hs_err.log
Continue reading

Implement a new JStall Feature with Me

Or: How I use GitHub Copilot to go from feature to idea

A few weeks back, I introduced you to jstall (Quickly Inspect your Java Application with JStall), a tool that analyses what your JVM is currently doing. This week is the first time I’m bringing you in on the development and letting you peek behind the curtains to see how I go from idea to implemented feature. The feature I’ll implement the jvm-support analysis that checks that the JVM running your application is not outdated.

This is the first time I recorded my development process, so I hope you still liked it.

See you on another day for something command-line parser- or redaction-related.

This blog post is part of my work in the SapMachine team at SAP, making profiling easier for everyone.

Reading and Writing JFR Files Programmatically

Last week, I showed you the Fastest Way to get the Version of a Java Installation. This week, I’ll show you something completely different: how to interact with JFR data programmatically, showcasing a new library called basic-jfr-processor in the process.

While JFR is a great tool for profiling your application and gaining insights, the file format is, on purpose, not well documented or specified. One of the best sources of information is Gunnar Morling’s blog post on the topic, and of course, the OpenJDK source code.

But of course, there are ready-made APIs for reading JFR files and OpenJDK-adjacent libraries to write them. In this overview blog post, I’ll showcase the built-in Java JFR API, Jaroslav Bachorik’s jafar API, and the JMC JFR writer API, as well as my own basic-jfr-processor library based on the latter.

We start with the built-in API:

Continue reading

Quickly Inspect your Java Application with JStall

Welcome to the last blog post of the year. Last week, I discussed the limitations of custom JFR events. This week, I’ll also be covering a profiling-related topic and showcasing a tiny tool called JStall.

I hope I’m not the only one who sometimes wonders: “What is my Java application doing right now?” When you don’t see any output. Yes, you could perform a simple thread dump via jstack, but it is hard to understand which threads are actually consuming CPU and making any sort of progress. This is where my tiny tool called JStall comes in:

JStall is a small command-line tool for one-shot inspection of running JVMs using thread dumps and short, on-demand profiling. The tool essentially takes multiple thread dumps of your application and uses the per-thread cpu-time information to find the most CPU-time-consuming Java threads.

First, download the JStall executable from the GitHub releases page. Let us then start by finding the currently running JVMs:

> ./jstall
Usage: jstall <command> <pid|files> [options]

Available commands:
  status     - Show overall status (deadlocks + most active threads)
  deadlock   - Check for deadlocks
  most-work  - Show threads doing the most work
  flame      - Generate flame graph
  threads    - List all threads

Available JVMs:
  7153 ./jstall
  1223 <unknown>
  8136 ./renaissance-gpl-0.16.0.jar
  6138 org.jetbrains.idea.maven.server.RemoteMavenServer36
  5597 DeadlockDemo
  49294 com.intellij.idea.Main

This provides us with a list of options for the main status command, as well as a list of JVM processes and their corresponding main classes. Let’s start checking for deadlocking:

Continue reading

Don’t use Arrays or other Complex Types in Custom JFR Events

JDK Flight Recorder (JFR) provides support for custom events as a profiler. Around two years ago, I wrote a blog post on this very topic: Custom JFR Events: A Short Introduction. These custom events are beneficial because they enable us to record additional project-specific information alongside the standard JFR events, all in the same file. We can then view and process this information with the JFR tools. You can freely specify these events in Java.

There is only one tiny problem nobody talks about: Array support (and, in more general, the support of complex types).

Take the following event:

class ArrayEvent extends Event {
    
    @Label("String Array")
    String[] stringArray;
    
    @Label("Int Array")
    int[] intArray;
    
    @Label("Long Array")
    long[] longArray;
    
    @Label("Non array field")
    String nonArrayField = "default";
}

What would you expect to happen when we create the event using the following code?

ArrayEvent event = new ArrayEvent();
event.stringArray = new String[]{"one", "two", "three"};
event.intArray = new int[]{1, 2, 3, 4, 5};
event.longArray = new long[]{100L, 200L, 300L};
event.commit();
Continue reading

Making JFR Quack: Importing JFR files into DuckDB

In my previous post, I showed you how tricky it is to compare objects from the JFR Java API. You probably wondered why I wrote about this topic. Here is the reason: In this blog post, I’ll cover how to load JFR files into a DuckDB database to allow querying profiling data with simple SQL queries, all JFR views included.

This blog post will start a small series on making JFR quack.

TL;DR

You can now use a query tool (via GitHub) to transform JFR files into similarly sized DuckDB files:

> java -jar target/query.jar duckdb import jfr_files/recording.jfr duckdb.db
> duckdb duckdb.db "SELECT * FROM Events";
┌───────────────────────────────┬───────┐
│             name              │ count │
│            varchar            │ int32 │
├───────────────────────────────┼───────┤
│ GCPhaseParallel               │ 69426 │
│ ObjectAllocationSample        │  6273 │

Or run the queries directly, with the database file being cached (if you don’t pass --no-cache), directly supporting all built-in JFR views:

> java -jar target/query.jar query jfr_files/metal.jfr "hot-methods" 
Method                                                                                                   Samples Percent
-------------------------------------------------------------------------------------------------------- ------- -------
java.util.concurrent.ForkJoinPool.deactivate(ForkJoinPool.WorkQueue, int)                                   1066   8.09%
scala.collection.immutable.RedBlackTree$.lookup(RedBlackTree.Tree, Object, Ordering)                         695   5.27%
akka.actor.dungeon.Children.initChild(ActorRef)                                                              678   5.14%

This view is implemented as:

CREATE VIEW "hot-methods" AS
SELECT
  (c.javaName || '.' || m.name || m.descriptor) AS "Method",
  COUNT(*) AS "Samples",
  format_percentage(COUNT(*) / (SELECT COUNT(*) FROM ExecutionSample)) AS "Percent"
FROM ExecutionSample es
JOIN Method m ON es.stackTrace$topMethod = m._id
JOIN Class c ON m.type = c._id
GROUP BY es.stackTrace$topApplicationMethod, c.javaName, m.name, m.descriptor
ORDER BY COUNT(*) DESC
LIMIT 25
Continue reading

JFR and Equality: A tale of many objects

In the last blog post, I showed you how to silence JFR’s startup messages. This week’s blog post is also related to JFR, and no, it’s not about the JFR Events website, which got a simple search bar. It’s a short blog post on comparing objects from JFR recordings in Java and why this is slightly trickier than you might have expected.

Example

Getting a JFR recording is simple; just use the RecordingStream API. We do this in the following to record an execution trace of a tight loop using JFR and store it in a list:

List<RecordedEvent> events = new ArrayList<>();
// Know when to stop the loop
AtomicBoolean running = new AtomicBoolean(true);
// We obtain one hundred execution samples 
// that have all the same stack trace
final long currentThreadId = Thread.currentThread().threadId();
try (RecordingStream rs = new RecordingStream()) {
    rs.enable("jdk.ExecutionSample").with("period", "1ms");
    rs.onEvent("jdk.ExecutionSample", event -> {
        if (event.getThread("sampledThread")
                 .getJavaThreadId() != currentThreadId) {
            return; // don't record other threads
        }
        events.add(event);
        if (events.size() >= 100) {
            // we can signal to stop
            running.set(false);
        }
    });
    rs.startAsync();
    int i = 0;
    while (running.get()) { // some busy loop to produce sample
        for (int j = 0; j < 100000; j++) {
            i += j;
        }
    }
    rs.stop();
}
Continue reading

Silencing JFR’s Startup Message

TD;DR: -Xlog:jfr+startup=error is your friend.

Ever wondered why JFR emits something like

[0.172s][info][jfr,startup] Started recording 1. No limit specified, using maxsize=250MB as default.
[0.172s][info][jfr,startup] 
[0.172s][info][jfr,startup] Use jcmd 29448 JFR.dump name=1 to copy recording data to file.

when starting the Flight Recorder with -XX:StartFlightRecorder? Even though the default logging level is warning, not info?

This is what this week’s blog post is all about. After I showed you last week how to waste CPU like a Professional, this week I’ll show you how to silence JFR. Back to the problem:

Continue reading

Java 25’s new CPU-Time Profiler: The Implementation (2)

I developed, together with others, the new CPU-time profiler for Java, which is now included in JDK 25. A few weeks ago, I covered the profiler’s user-facing aspects, including the event types, configuration, and rationale, alongside the foundations of safepoint-based stack walking in JFR (see Taming the Bias: Unbiased Safepoint-Based Stack Walking). If you haven’t read those yet, I recommend starting there. In this week’s blog post, I’ll dive into the implementation of the new CPU-time profiler.

It was a remarkable coincidence that safepoint-based stack walking made it into JDK 25. Thanks to that, I could build on top of it without needing to re-implement:

  • The actual stack walking given a sampling request
  • Integration with the safepoint handler

Of course, I worked on this before, as described in Taming the Bias: Unbiased Safepoint-Based Stack Walking. But Erik’s solution for JDK 25 was much more complete and profited from his decades of experience with JFR. In March 2025, whether the new stack walker would get into JDK 25 was still unclear. So I came up with other ideas (which I’m glad I didn’t need). You can find that early brain-dump in Profiling idea (unsorted from March 2025).

In this post, I’ll focus on the core components of the new profiler, excluding the stack walking and safepoint handler. Hopefully, this won’t be the last article in the series; I’m already researching the next one.

Main Components

There are a few main components of the implementation that come together to form the profiler:

Continue reading

Profiling idea (unsorted from March 2025)

This is my actual collection of ideas from March 2025, when it was unclear whether the updated JFR sampling at safepoints made it into JDK 25. It eventually did, so I scrapped the ideas. But it offers the reader an interesting, unfiltered look into my ideas and thoughts at the time, probably only useful for people who are really into profiling and the OpenJDK. Just be aware that it is therefore a document of its time (March 2025) and doesn’t reflect the actual current implementation. Also, don’t expect any deeper explanations.

Well, I warned you…

An Experimental Front-End for JFR Queries

Ever wondered how the views of the jfr tool are implemented? There are views like hot-methods which gives the most used methods, or cpu-load-samples that gives you the system load over time that you can directly use on the command line:

> jfr view cpu-load-samples recording.jfr

                                     CPU Load

Time                         JVM User           JVM System           Machine Total
------------------ ------------------ -------------------- -----------------------
14:33:29                        8,25%                0,08%                  29,65%
14:33:30                        8,25%                0,00%                  29,69%
14:33:31                        8,33%                0,08%                  25,42%
14:33:32                        8,25%                0,08%                  27,71%
14:33:33                        8,25%                0,08%                  24,64%
14:33:34                        8,33%                0,00%                  30,67%
...

This is helpful when glancing at JFR files and trying to roughly understand their contents, without loading the files directly into more powerful, but also more resource-hungry, JFR viewers.

In this short blog post, I’ll show you how the views work under the hood using JFR queries and how to use the queries with my new experimental JFR query tool.

I didn’t forget the promised blog post on implementing the new CPU-time profiler in JDK 25; it’ll come soon.

Under the hood, JFR views use a built-in query language to define all views in the view.ini file. The above is, for example, defined as:

[environment.cpu-load-samples]
label = "CPU Load"
table = "SELECT startTime, jvmUser, jvmSystem, machineTotal FROM CPULoad"

With my new query tool (GitHub), we can plot this as:

Continue reading

Java 25’s new CPU-Time Profiler (1)

This is the first part of my series; the other parts are

Back to the blog post:

More than three years in the making, with a concerted effort starting last year, my CPU-time profiler landed in Java with OpenJDK 25. It’s an experimental new profiler/method sampler that helps you find performance issues in your code, having distinct advantages over the current sampler. This is what this week’s and next week’s blog posts are all about. This week, I will cover why we need a new profiler and what information it provides; next week, I’ll cover the technical internals that go beyond what’s written in the JEP. I will quote the JEP 509 quite a lot, thanks to Ron Pressler; it reads like a well-written blog post in and of itself.

Before I show you its details, I want to focus on what the current default method profiler in JFR does:

Continue reading

Taming the Bias: Unbiased* Safepoint-Based Stack Walking in JFR

Two years ago, I still planned to implement a new version of AsyncGetCallTrace in Java. This plan didn’t materialize, but Erik Österlund had the idea to fully walk the stack at safepoints during the discussions. Walking stacks only at safepoints normally would incur a safepoint-bias (see The Inner Workings of Safepoints), but when you record some program state in signal handlers, you can prevent this. I wrote about this idea and its basic implementation in Taming the Bias: Unbiased Safepoint-Based Stack Walking. I’ll revisit this topic in this week’s short blog post because Markus Grönlund took Erik’s idea and started implementing it for the standard JFR method sampler:

Continue reading

A Glance into JFR Class and Method Tagging

If you’re here for eBPF content, this blog post is not for you. I recommend reading an article on a concurrency fuzzing scheduler at LWN.

Ever wonder how the JDK Flight Recorder (JFR) keeps track of the classes and methods it has collected for stack traces and more? In this short blog post, I’ll explore JFR tagging and how it works in the OpenJDK.

Tags

JFR files consist of self-contained chunks. Every chunk contains:

The maximum chunk size is usually 12MB, but you can configure it:

java -XX:FlightRecorderOptions:maxchunksize=1M

Whenever JFR collects methods or classes, it has to somehow tell the JFR writer which entities have been used so that their mapping can be written out. Each entity also has to have a tracing ID that can be used in the events that reference it.

This is where JFR tags come in. Every class, module, and package entity has a 64-bit value called _trace_id (e.g., classes). Which consists of both the ID and the tag. Every method has an _orig_method_idnum, essentially its ID and a trace flag, which is essentially the tag.

In a world without any concurrency, the tag could just be a single bit, telling us whether an entity is used. But in reality, an entity can be used in the new chunk while we’re writing out the old chunk. So, we need to have two distinctive periods (0 and 1) and toggle between them whenever we write a chunk.

Tagging

We can visualize the whole life cycle of a tag for a given entity:

In this example, the entity, a class, is brought into JFR by the method sampler (link) while walking another thread’s stack. This causes the class to be tagged and enqueued in the internal entity queue (and is therefore known to the JFR writer) if it hasn’t been tagged before (source):

inline void JfrTraceIdLoadBarrier::load_barrier(const Klass* klass) {
  SET_METHOD_AND_CLASS_USED_THIS_EPOCH(klass);
  assert(METHOD_AND_CLASS_USED_THIS_EPOCH(klass), "invariant");
  enqueue(klass);
  JfrTraceIdEpoch::set_changed_tag_state();
}

inline traceid JfrTraceIdLoadBarrier::load(const Klass* klass) {
  assert(klass != nullptr, "invariant");
  if (should_tag(klass)) {
    load_barrier(klass);
  }
  assert(METHOD_AND_CLASS_USED_THIS_EPOCH(klass), "invariant");
  return TRACE_ID(klass);
}

This shows that tagging also prevents entities from being duplicated in a chunk.

Then, when a chunk is written out. First, a safepoint is requested to initialize the next period (the next chunk) and the period to be toggled so that the subsequent use of an entity now belongs to the new period and chunk. Then, the entity is written out, and its tag for the previous period is reset (code). This allows the aforementioned concurrency.

But how does it ensure that the tagged classes aren’t unloaded before they are emitted? By writing out the classes when any class is unloaded. This is simple yet effective and doesn’t need any change in the GC.

Conclusion

Tagging is used in JFR to record classes properly, methods, and other entities while also preventing them from accidentally being garbage collected before they are written out. This is a simple but memory-effective solution. It works well in the context of concurrency but assumes entities are used in the event creation directly when tagging them. It is not supported to tag the entities and then push them into the queue to later create events asynchronously. This would probably require something akin to reference counting.

Thanks for coming this far in a blog post on a profiling-related topic. I chose this topic because I wanted to know more about tagging and plan to do more of these short OpenJDK-specific posts.

P.S.: I gave three talks at FOSDEM, on fuzzing schedulers, sched-ext, and profiling.

Using AI to Create JFR Event Descriptions

JFR (JDK Flight Recorder) is the default profiler for OpenJDK (see my other blog posts for more information). What makes JFR stand out from the other profilers is the ability to log many, many different events that contain lots of information, like information on class loading, JIT compilation, and garbage collection. You can see a list of all available events on my JFR Event Collection website:

This website gives an overview of the events, with descriptions from the OpenJDK, their properties, examples, configurations, and the JDK versions in which every event is present. However, few descriptions are available, and the available texts are mostly single sentences.

TL:DR: I used GPT3.5 to create a description for every event by giving it the part of the OpenJDK source code that creates the event.

For most events, I state the lack of a description, coupled with a request that the knowledgeable reader might contribute one:

But as you can see, there is not really any progress in creating documentation. So, I have two options left:

  1. Ask knowledgeable JDK developers to add descriptions: It’s time-consuming, and it would only be added in the next release
  2. Write the descriptions myself directly for the website: This is pretty time-consuming, with over 150 events per JDK version.
  3. Task AI to interpret the code that creates each event in the JDK source code.

With 1. and 2. infeasible, I started working on the AI approach, implementing it in my JFR event collector tool that collects the information displayed on the website.

I tried to use local AI models for this project but failed, so I started using GPT3.5-turbo and testing it on the OpenAI ChatGPT website. The main structure of my endeavor is as follows:

For every event, I first collect all usages and creations in the OpenJDK source, and then I construct a prompt of the following form that includes the surrounding context of the source locations:

Explain the JFR event <event> concisely so that the reader, proficient in JFR, knows the meaning and relevance of the event to profiling and its fields, without giving code snippets or referencing the code directly, take the following code as the context of its usage and keep it short and structured
(and in markdown format, so format it properly to make it readable, using bullet points for field lists, but nothing else):
<context>

Now some information about the event:
Fields:
<fields>
It is <flags: experimental, internal>

Don’t mention implementation details, like methods, but explain the meaning of the event and how to use it for profiling.
Keep field names lowercase and in backticks.
Don’t use headings.
Don’t repeat yourself.
Keep it short.

For example, I asked ChatGPT the following for the ReservedStackActivation event:

Explain the JFR event ReservedStackActivation […]:

file: src/hotspot/share/runtime/sharedRuntime.cpp

// ... for brevity

frame SharedRuntime::look_for_reserved_stack_annotated_method(JavaThread* current, frame fr) {
  ResourceMark rm(current);
  // ...
   if (found) {
      activation = fr;
      warning("Potentially dangerous stack overflow in "
              "ReservedStackAccess annotated method %s [%d]",
              method->name_and_sig_as_C_string(), count++);
      EventReservedStackActivation event;
      if (event.should_commit()) {
        event.set_method(method);
        event.commit();
      }
    }
  }
  return activation;
}

// ...
The code context is from the JDK repository on GitHub.

I then pass this prompt to GPT-3.5 and obtain the result:

The ReservedStackActivation event in JFR signifies a potentially dangerous stack overflow in a Java method that has been annotated with ReservedStackAccess. It is used for profiling purposes to identify methods that may be causing stack overflows.

The relevant field for this event is:

  • method: Represents the Java method where the potential stack overflow occurred.

My prompt and the code used to find the usage contexts, simple regular expressions without C++ parsing, is quite simplistic, but the results are somewhat usable.

But this event has also a description:

Activation of Reserved Stack Area caused by stack overflow with ReservedStackAccess annotated method in call stack

Why did I choose this event, then? Because it allows you to compare the LLM generated and the OpenJDK developer’s written description. Keep in mind that the LLM did not get passed the event description. The generated version is similar, yet more text.

You can find my implementation on GitHub (GPLv2.0 licensed) and the generated documentation on the JFR Event Collection:

Conclusion

I’m unsure whether I like or dislike the results of this experiment: It’s, on the one hand, great to generate descriptions for events that didn’t have any, using the code as the source of truth. But does it really give new insights, or is it just bloated text? I honestly don’t know whether the website needs it. Therefore, I am currently just generating it for JDK 21 and might remove the feature in the future. The AI can’t replace the insights you get by reading articles on specific events, like Gunnar Morling’s recent post on the NativeMemory events.

Do you have any opinions on this? Feel free to use the usual channels to voice your opinion, and consider improving the JFR documentation if you can.

See you next week with a blog post on something completely different yet slightly related to Panama and the reason for my work behind last week’s From C to Java Code using Panama article. Consider this as my Christmas present to my readers.

This article is part of my work in the SapMachine team at SAP, making profiling and debugging easier for everyone. Thanks to Vedran Lerenc for helping me with the LLM part of this project.

Profiling Maven Projects with my IntelliJ Profiler Plugin

Or: I just released version 0.0.11 with a cool new feature that I can’t wait to tell you about…

According to the recent JetBrains survey, most people use Maven as their build system and build Spring Boot applications with Java. Yet my profiling plugin for IntelliJ only supports profiling pure Java run configuration. Configurations where the JVM gets passed the main class to run. This is great for tiny examples where you directly right-click on the main method and profile the whole application using the context menu:

But this is not great when you’re using the Maven build system and usually run your application using the exec goal, or, god forbid, use Spring Boot or Quarkus-related goals. Support for these goals has been requested multiple times, and last week, I came around to implementing it (while also two other bugs). So now you can profile your Spring Boot, like the Spring pet-clinic, application running with spring-boot:run:

Giving you a profile like:

Or your Quarkus application running with quarkus:dev:

Giving you a profile like:

This works specifically by using the options of these goals, which allows the profiler plugin to pass profiling-specific JVM options. If the plugin doesn’t detect a directly supported plugin, it passes the JVM options via the MAVEN_OPTS environment variable. This should work with the exec goals and others.

Gradle script support has also been requested, but despite searching the whole internet till the night, I didn’t find any way to add JVM options to the JVM that Gradle runs for the Spring Boot or run tasks without modifying the build.gradle file itself (see Baeldung).

I left when it was dark and rode out into the night with my bike. Visiting other lost souls in the pursuit of sweet potato curry.

Only Quarku’s quarkusDev task has the proper options so that I can pass the JVM options. So, for now, I only have basic Quarkus support but nothing else. Maybe one of my readers knows how I could still provide profiling support for non-Quarkus projects.

You can configure the options that the plugin uses for specific task prefixes yourself in the .profileconfig.json file:

{
    "additionalGradleTargets": [
        {
            // example for Quarkus
            "targetPrefix": "quarkus",
            "optionForVmArgs": "-Djvm.args",
            "description": "Example quarkus config, adding profiling arguments via -Djvm.args option to the Gradle task run"
        }
    ],
    "additionalMavenTargets": [
        {   // example for Quarkus
            "targetPrefix": "quarkus:",
            "optionForVmArgs": "-Djvm.args",
            "description": "Example quarkus config, adding profiling arguments via -Djvm.args option to the Maven goal run"
        }
    ]
}

This update has been the first one with new features since April. The new features should make life easier for profiling both real-world and toy applications. If you have any other feature requests, feel free to create an issue on GitHub and, ideally, try to create a pull request. I’m happy to help you get started.

See you next week on some topics I have not yet decided on. I have far more ideas than time…

This article is part of my work in the SapMachine team at SAP, making profiling and debugging easier for everyone. Thanks to the issue reporters and all the other people who tried my plugin.

Custom Events in the Blocky World: Using JFR in Minecraft

Java Flight Recorder (JFR) is one of the main open-source profilers for Java, and the only one built directly into the OpenJDK. You can find an introduction to Java profiling in my InfoQ Unleash the Power of Open-Source Profilers article and additional information and presentation on my Profiling Talks page. Furthermore, I wrote an introduction to custom JFR events: Custom JFR Events: A Short Introduction. JFR and custom events are pretty helpful when profiling applications, this blog post gives you an example from the real world.

I was searching for some JFR-related settings on the internet when I stumbled upon the /jfr command that exists in Minecraft:

This, of course, intrigued me, especially as Minecraft apparently adds some custom JFR events:

So I had to check it out. I downloaded and started the Java server, got a demo account, and connected to my local instance. This works with a demo account when you launch the demo world, enable the cheat mode in the settings, kick yourself via “/kick @p,” and then select your own server. I found this via this bug report.

You then must ensure that you have OP privileges and add them, if not via the Minecraft server shell. Then, you can type /jfr start in the chat (launch it by typing T) to start the recording and /jfr stop to stop it.

You see that it’s my first time “playing” Minecraft, and I’m great at getting attacked. It’s probably also my last time.

Minecraft stores the JFR file in the debug folder in the working directory of your server, both as a JFR file and as a JSON file. You can view the JFR file in a JFR viewer of your choice, like JMC or my IntelliJ JFR plugin (web view of the file, JFR file itself), and explore the custom JFR events:

This lets you get insights into the chunk generation and specific traffic patterns of the Minecraft server.

But what does the event specification look like? We could disassemble the Minecraft JAR and potentially get into legal trouble, or we could just use the jfr utility with its metadata command and get an approximation of the event definition from the JFR metadata:

jfr metadata debug/server-2023-11-17-155349.jfr | \
    grep minecraft --after-context=40

The ChunkGeneration event looks as follows:

@Name("minecraft.ChunkGeneration")
@Label("Chunk Generation")
@Category({"Minecraft", "World Generation"})
class ChunkGeneration extends jdk.jfr.Event {
  @Label("Start Time")
  @Timestamp("TICKS")
  long startTime;

  @Label("Duration")
  @Timespan("TICKS")
  long duration;

  @Label("Event Thread")
  @Description("Thread in which event was committed in")
  Thread eventThread;

  @Label("Stack Trace")
  @Description("Stack Trace starting from the method the event was committed in")
  StackTrace stackTrace;

  @Label("First Block X World Position")
  int worldPosX;

  @Label("First Block Z World Position")
  int worldPosZ;

  @Label("Chunk X Position")
  int chunkPosX;

  @Label("Chunk Z Position")
  int chunkPosZ;

  @Label("Status")
  String status;

  @Label("Level")
  String level;
}

You can find all defined events here. The actual implementation of these events is only slightly larger because some events accumulate data over a period of time.

I’m, of course, not the first OpenJDK developer who stumbled upon these custom events. Erik Gahlin even found them shortly after their addition in 2021 and promptly created an issue to recommend improvements (see MC-236873):

Conclusion

In my previous blog post, I showed you how to create custom JFR events for a small sample application. Seeing custom events in Minecraft shows you that custom events are used in the wild by applications used by millions of users, helping developers improve the performance of their applications.

If you’re looking for more information on custom JFR events, I would recommend reading my previous blog post Custom JFR Events: A Short Introduction and Gunnar Morlings Monitoring REST APIs with Custom JDK Flight Recorder Events article. See you in a couple of days with a new blog post on JFR event configuration.

This article is part of my work in the SapMachine team at SAP, making profiling and debugging easier for everyone.

Custom JFR Events: A Short Introduction

JDK Flight Recorder (JFR) is one of the two prominent open-source profilers for the OpenJDK (besides async-profiler). It offers many features (see Profiling Talks) and the ability to observe lots of information by recording over one hundred different events. If you want to know more about the existing events, visit my JFR Event Collection website (related blog post):

Besides these built-in events, JFR allows you to implement your events to record custom information directly in your profiling file.

Let’s start with a small example to motivate this. Consider for a moment that we want to run the next big thing after Software-as-a-Service: Math-as-a-Service, a service that provides customers with the freshest Fibonacci numbers and more.

We develop this service using Javalin:

public static void main(String[] args) throws Exception {
    // create a server with 4 threads in the thread pool                                                                               
    Javalin.create(conf -> {                                                  
            conf.jetty.server(() ->                                           
                new Server(new QueuedThreadPool(4))                           
            );                                                                
            })                                                                
            .get("/fib/{fib}", ctx -> {                                       
                handleRequest(ctx, newSessionId());                           
            })                                                                
            .start(7070);                                                     
    System.in.read();                                                         
}                                                                             
                                                                              
static void handleRequest(Context ctx, int sessionId) {                       
    int n = Integer.parseInt(ctx.pathParam("fib"));
    // log the current session and n                           
    System.out.printf("Handle session %d n = %d\n", sessionId, n);            
    // compute and return the n-th fibonacci number                                                        
    ctx.result("fibonacci: " + fib(n));                                                                                                 
}                                                                             
                                                                              
public static int fib(int n) {                                                
    if (n <= 1) {                                                             
        return n;                                                             
    }                                                                         
    return fib(n - 1) + fib(n - 2);                                           
}                                                                                                                                                     

This is a pretty standard tiny web endpoint, minus all the user and session handling. It lets the customer query the n-th Fibonacci number by querying /fib/{n}. Our built-in logging prints n and the session ID on standard out, but what if we want to store it directly in our JFR profile while continuously profiling our application?

This is where custom JFR events come in handy:

public class SessionEvent extends jdk.jfr.Event {
    int sessionId;
    int n;

    public SessionEvent(int sessionId, int n) {
        this.sessionId = sessionId;
        this.n = n;
    }
}

The custom event class extends the jdk.jfr.Event class and simply define a few fields for the custom data. These fields can be annotated with @Label("Human readable label") and @Description("Longer description") to document them.

We can now use this event class to record the relevant data in the handleRequest method:

static void handleRequest(Context ctx, int sessionId) {            
    int n = Integer.parseInt(ctx.pathParam("fib"));                
    System.out.printf("Handle session %d n = %d\n", sessionId, n);
    // create event 
    var event = new SessionEvent(sessionId, n);
    // add start and stacktrace                   
    event.begin();                                                 
    ctx.result("fibonacci: " + fib(n));
    // add end and store                          
    event.commit();                                                
}                                                                  

This small addition records the timing and duration of each request, as well as n and the session ID in the JFR profile. The sample code, including a request generator, can be found on GitHub. After we ran the server, we can view the recorded events in a JFR viewer, like JDK Mission Control or my JFR viewer (online view):

This was my short introduction to custom JFR events; if you want to learn more, I highly recommend Gunnar Morlings Monitoring REST APIs with Custom JDK Flight Recorder Events article. Come back next week for a real-world example of custom JFR events.

This article is part of my work in the SapMachine team at SAP, making profiling and debugging easier for everyone.

Putting JFR into Context

Have you ever wanted to bring your JFR events into context? Adding information on sessions, user IDs, and more can improve your ability to make sense of all the events in your profile. Currently, we can only add context by creating custom JFR events, as I presented in my Profiling Talks:

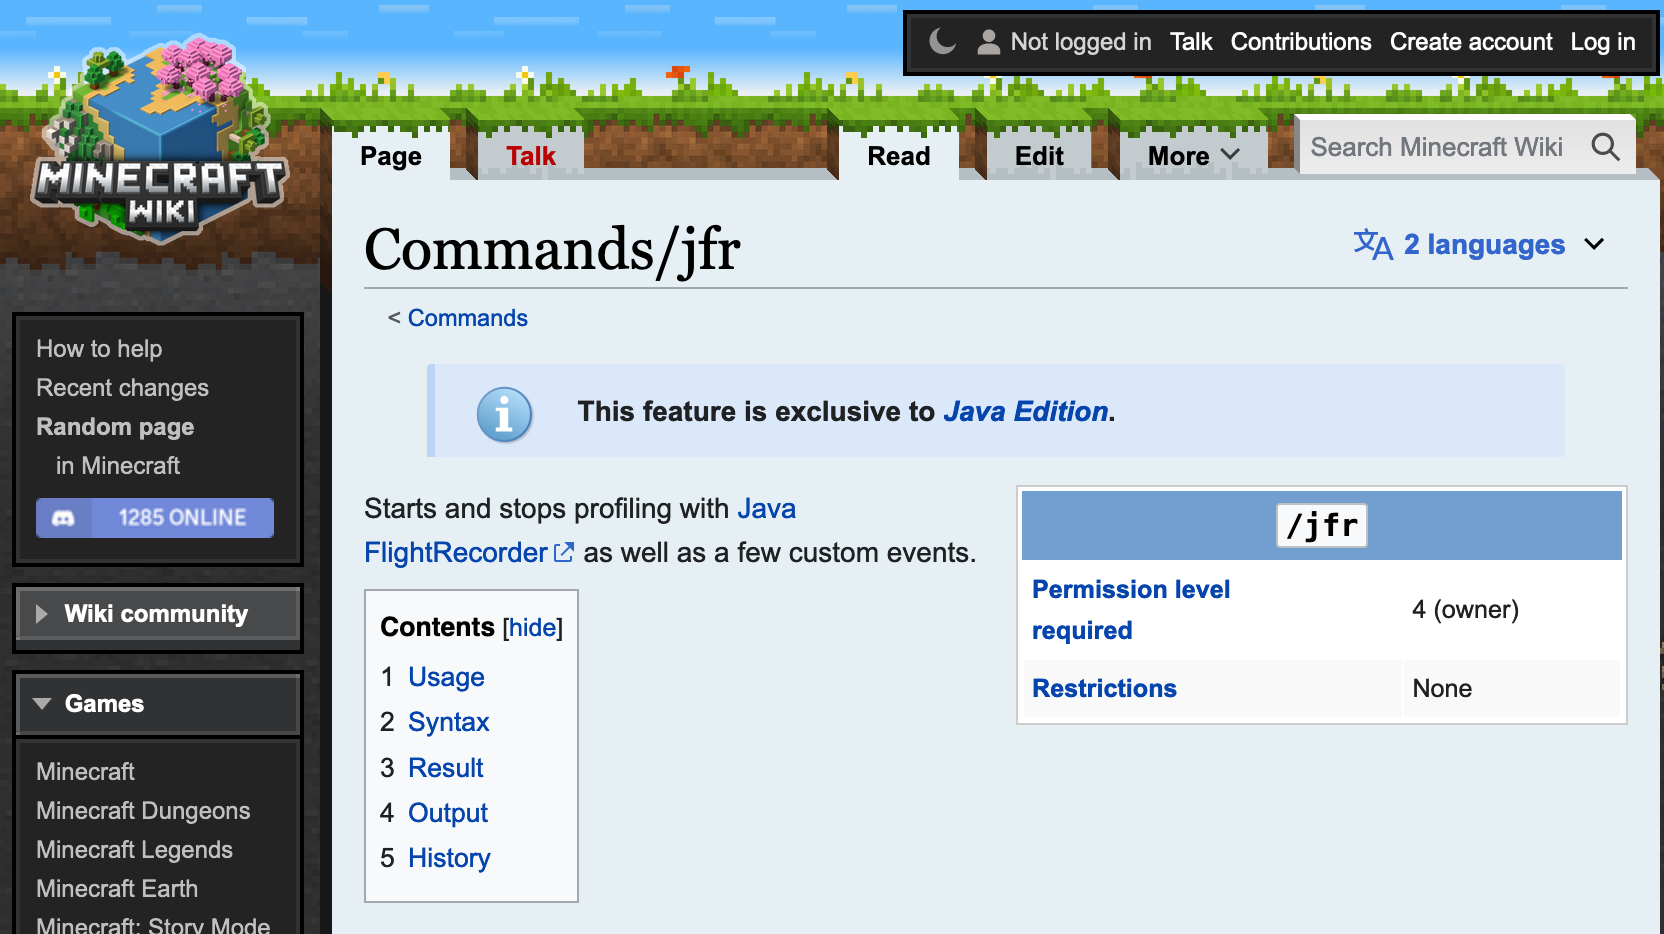
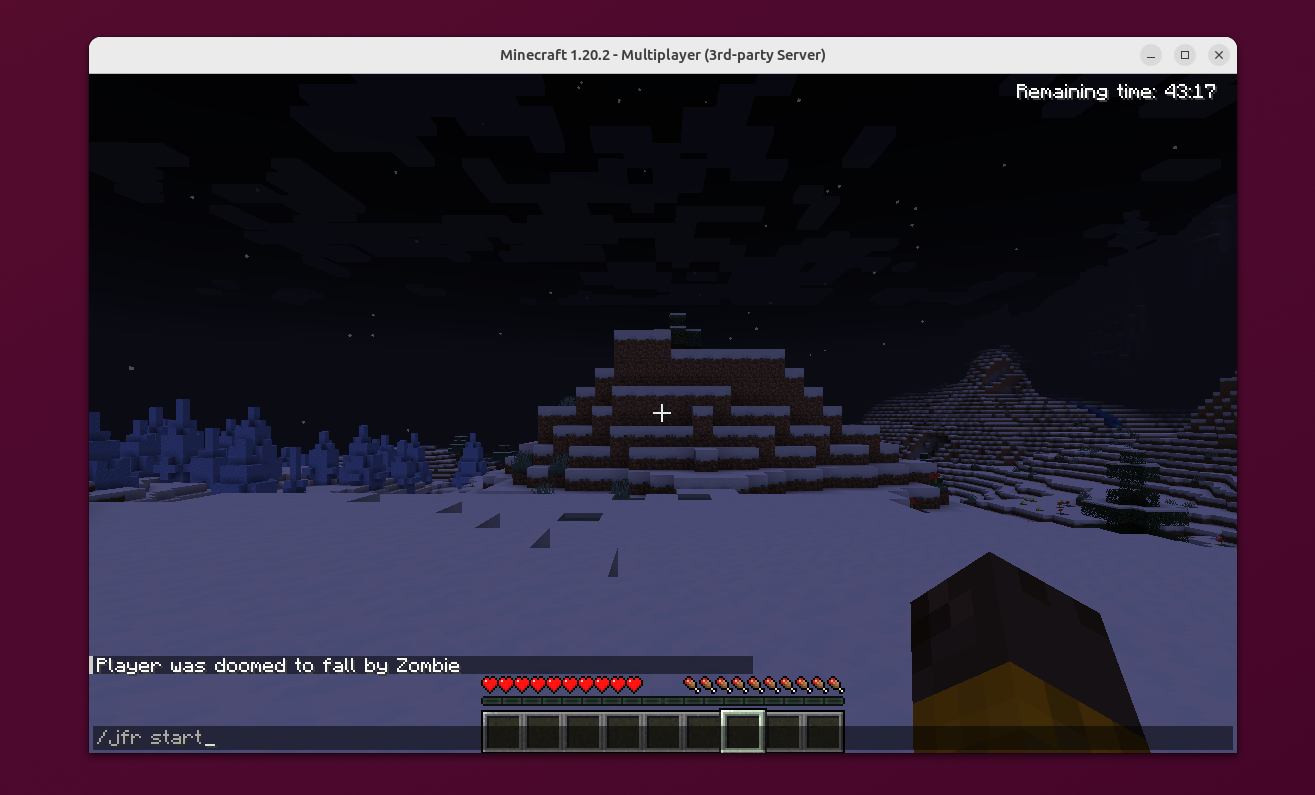
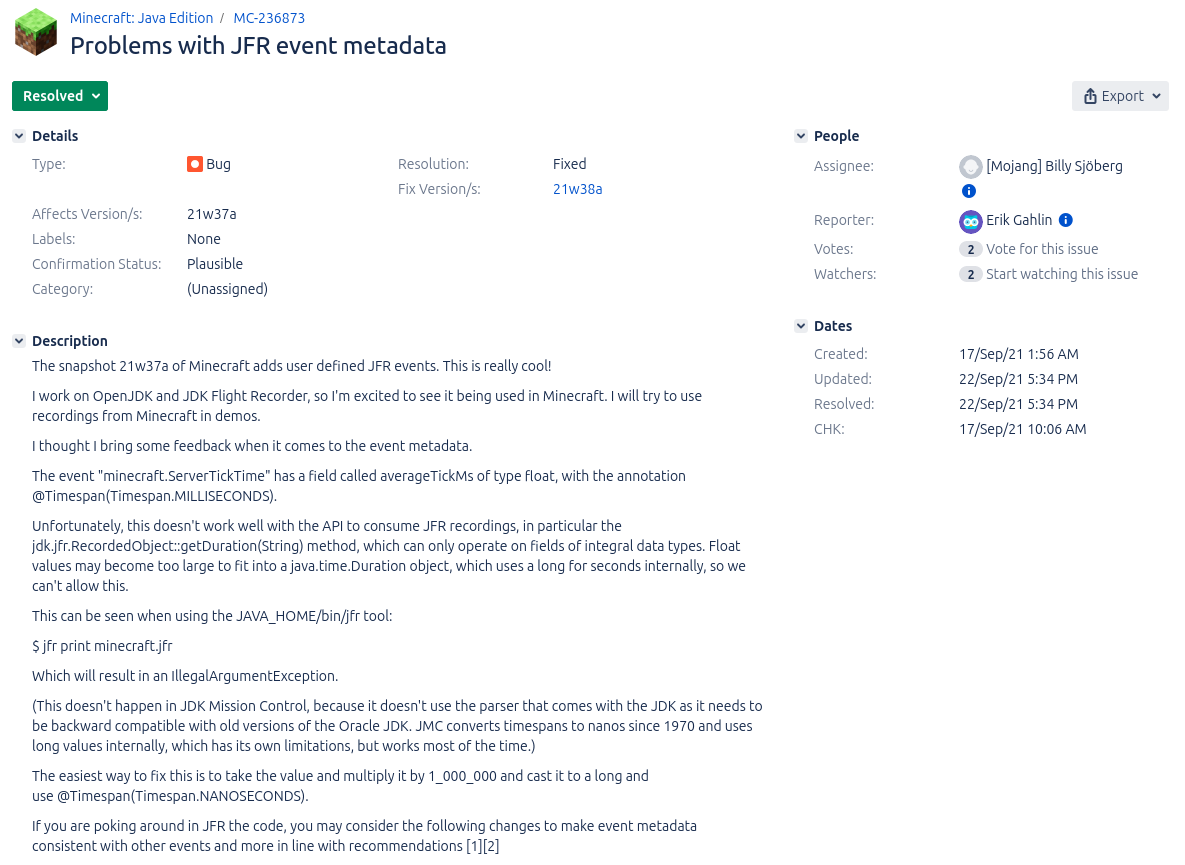
We can use these custom events (see Custom JFR Events: A Short Introduction and Custom Events in the Blocky World: Using JFR in Minecraft) to store away the information and later relate them to all the other events by using the event’s time, duration, and thread. This works out-of-the-box but has one major problem: Relating events is quite fuzzy, as time stamps are not as accurate (see JFR Timestamps and System.nanoTime), and we do all of this in post-processing.

But couldn’t we just attach some context to every JFR event we’re interested in? Not yet, but Jaroslav Bachorik from DataDog is working on it. Recently, he wrote three blog posts (1, 2, 3). The following is a different take on his idea, showing how to use it in a small file server example.

The main idea of Jaroslav’s approach is to store a context in thread-local memory and attach it to every JFR event as configured. But before I dive into the custom context, I want to show you the example program, which you can find, as always, MIT-licensed on GitHub.

Example

We create a simple file server via Javalin, which allows a user to

  • Register (URL schema register/{user})
  • Store data in a file (store/{user}/{file}/{content})
  • Retrieve file content (load/{user}/{file})
  • Delete files (delete/{user}/{file})

The URLs are simple to use, and we don’t bother about error handling, user authentication, or large files, as this would complicate our example. I leave it as an exercise for the inclined reader. The following is the most essential part of the application: the server declaration:

FileStorage storage = new FileStorage();                                                               
try (Javalin lin = Javalin.create(conf -> {                                                            
            conf.jetty.server(() ->                                                                    
                    new Server(new QueuedThreadPool(4))                                                
            );                                                                                         
        })                                                                                             
        .exception(Exception.class, (e, ctx) -> {                                                      
            ctx.status(500);                                                                           
            ctx.result("Error: " + e.getMessage());                                                    
            e.printStackTrace();                                                                       
        })                                                                                             
        .get("/register/{user}", ctx -> {                                                              
            String user = ctx.pathParam("user");                                                       
            storage.register(user);                                                                    
            ctx.result("registered");                                                                  
        })                                                                                             
        .get("/store/{user}/{file}/{content}", ctx -> {                                                
            String user = ctx.pathParam("user");                                                       
            String file = ctx.pathParam("file");                                                       
            storage.store(user, file, ctx.pathParam("content"));                                       
            ctx.result("stored");                                                                      
        })                                                                                             
        .get("/load/{user}/{file}", ctx -> {                                                           
            String user = ctx.pathParam("user");                                                       
            String file = ctx.pathParam("file");                                                       
            ctx.result(storage.load(user, file));                                                      
        })                                                                                             
        .get("/delete/{user}/{file}", ctx -> {                                                         
            String user = ctx.pathParam("user");                                                       
            String file = ctx.pathParam("file");                                                       
            storage.delete(user, file);                                                                
            ctx.result("deleted");                                                                     
        })) {                                                                                          
    lin.start(port);                                                                                   
    Thread.sleep(100000000);                                                                           
} catch (InterruptedException ignored) {                                                               
}                                                                                                      

This example runs on Jaroslav’s OpenJDK fork (commit 6ea2b4f), so if you want to run it in its complete form, please build the fork and make sure that you’re PATH and JAVA_HOME environment variables are set accordingly.

You can build the server using mvn package and
start it, listening on the port 1000, via:

java -jar target/jfr-context-example.jar 1000

You can then use it via your browser or curl:

# start the server
java -XX:StartFlightRecording=filename=flight.jfr,settings=config.jfc \
-jar target/jfr-context-example.jar 1000 &
pid=$!

# register a user
curl http://localhost:1000/register/moe

# store a file
curl http://localhost:1000/store/moe/hello_file/Hello

# load the file
curl http://localhost:1000/load/moe/hello_file
-> Hello

# delete the file
curl http://localhost:1000/delete/moe/hello_file

kill $pid

# this results in the flight.jfr file

To make testing easier, I created the test.sh script, which starts the server, registers a few users and stores, loads, and deletes a few files, creating a JFR file along the way. We're using a custom JFR configuration to enable the IO events without any threshold. This is not recommended for production but is required in our toy example to get any such event:

<?xml version="1.0" encoding="UTF-8"?>

<configuration version="2.0" label="Custom" description="Custom config for the example"
  provider="Johannes Bechberger">
    <event name="jdk.FileRead" withContext="true">
        <setting name="enabled">true</setting>
        <setting name="stackTrace">true</setting>
        <setting name="threshold" control="file-threshold">0 ms</setting>
    </event>

    <event name="jdk.FileWrite" withContext="true">
        <setting name="enabled">true</setting>
        <setting name="stackTrace">true</setting>
        <setting name="threshold" control="file-threshold">0 ms</setting>
    </event>
</configuration>

We can use the jfr tool to easily print all the jdk.FileRead events from the created flight.jfr file in JSON format:

jfr print --events jdk.FileRead --json flight.jfr

This prints a list of events like:

{
  "type": "jdk.FileRead", 
  "values": {
    "startTime": "2023-10-18T14:31:56.369071625+02:00", 
    "duration": "PT0.000013042S", 
    "eventThread": {
      "osName": "qtp2119992687-32", 
      ...
    }, 
    "stackTrace": {
      "truncated": false, 
      "frames": [...]
    }, 
    "path": "\/var\/folders\/nd\/b8fyk_lx25b1ndyj4kmb2hk403cmxz\/T\/tmp13266469351066000997\/moe\/test_1", 
    "bytesRead": 8, 
    "endOfFile": false
  }
}

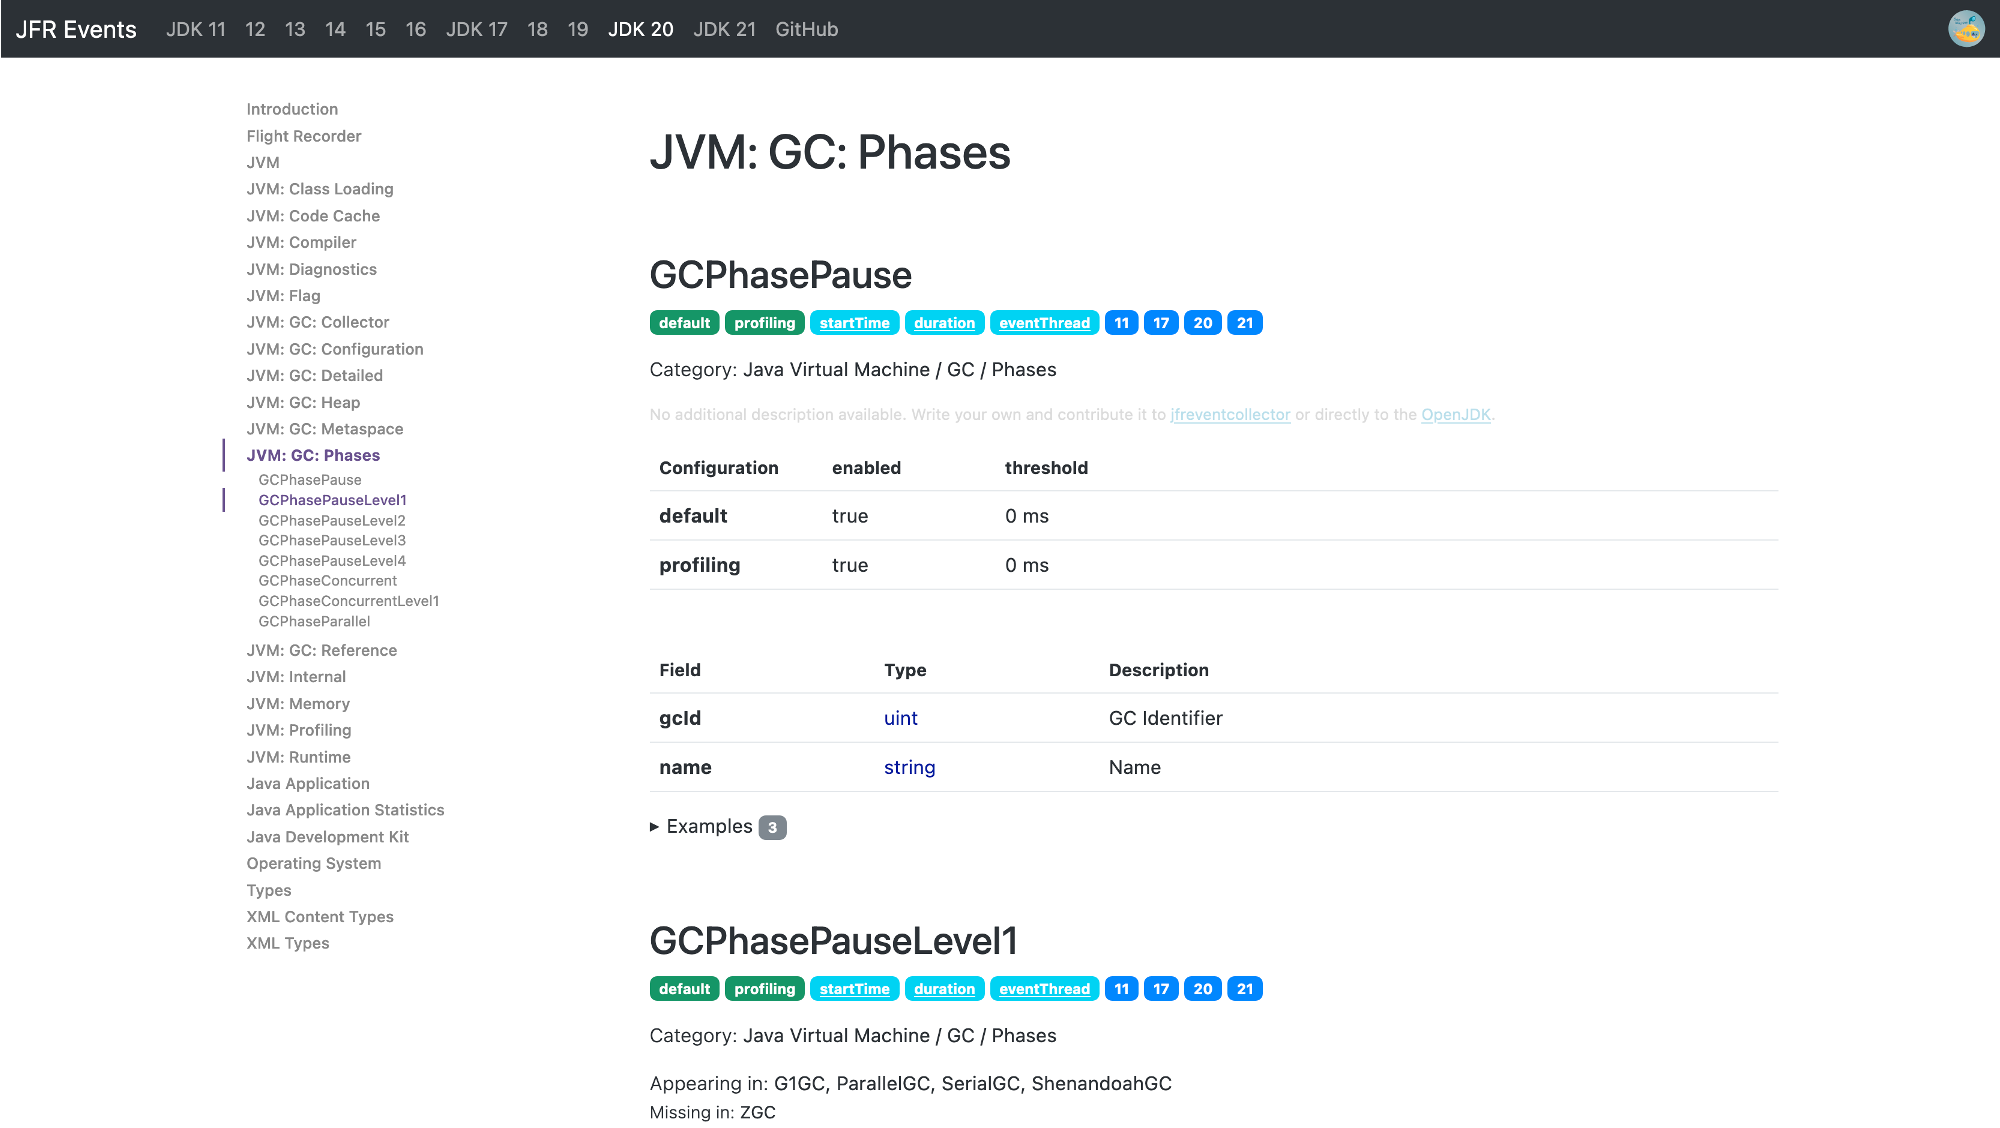
You can find more information on this and other events in my JFR Event Collection:

There are, of course, other events, but in our file server example, we’re only interested in file events for now (this might change as Jaroslav adds more features to his fork).

Now, we can start bringing the events into context.

Adding Custom Context

Before we can add the context, we have to define it, as described in Jaroslav’s blog post. We create a context that stores the current user, action, trace ID, and optional file:

@Name("tracer-context")
@Description("Tracer context type tuple")
public class TracerContextType extends ContextType implements AutoCloseable {

    private static final AtomicLong traceIdCounter = new AtomicLong(0);

    // attributes are defined as plain public fields annotated by at least @Name annotation
    @Name("user")
    @Description("Registered user")
    public String user;

    @Name("action")
    @Description("Action: register, store, load, delete")
    public String action;

    @Name("file")
    @Description("File if passed")
    public String file;

    // currently no primitives allowed here
    @Name("trace")
    public String traceId;

    public TracerContextType(String user, String action, String file) {
        this.user = user;
        this.action = action;
        this.file = file;
        this.traceId = "" + traceIdCounter.incrementAndGet();
        this.set();
    }

    public TracerContextType(String user, String action) {
        this(user, action,"");
    }

    @Override
    public void close() throws Exception {
        unset();
    }
}

A context has to be set and then later unset, which can be cumbersome in the face of exceptions. Implementing the AutoClosable interface solves this by allowing us to wrap code in a try-with-resources statement:

try (var t = new TracerContextType(/* ... */)) {
    // ...
}

All JFR events with enabled context that happen in the body of the statement are associated with the TracerContextType instance. We can use the code of all request handlers in our server with such a construct, e.g.:

.get("/store/{user}/{file}/{content}", ctx -> {                 
    String user = ctx.pathParam("user");                        
    String file = ctx.pathParam("file");                        
    try (var t = new TracerContextType(user, "store", file)) {  
        storage.store(user, file, ctx.pathParam("content"));    
        ctx.result("stored");                                   
    }                                                           
})                                                              

One last thing before we can analyze the annotated events: JFR has to know about your context before the recording starts. We do this by creating a registration class registered as a service.

@AutoService(ContextType.Registration.class)
public class TraceContextTypeRegistration implements ContextType.Registration {

    @Override
    public Stream<Class<? extends ContextType>> types() {
        return Stream.of(TracerContextType.class);
    }
}

We use the auto-service project by Google to automatically create the required build files (read more in this blog post by Pedro Rijo.

Using the Custom Context

After adding the context, we can see it in the jdk.FileRead events:

{
  "type": "jdk.FileRead", 
  "values": {
    "startTime": "2023-10-18T14:31:56.369071625+02:00", 
    "duration": "PT0.000013042S", 
    "eventThread": {
      "osName": "qtp2119992687-32", 
      ...
    }, 
    "stackTrace": {
      "truncated": false, 
      "frames": [...]
    }, 
    "tracer-context_user": "moe", 
    "tracer-context_action": "load", 
    "tracer-context_file": "test_1", 
    "tracer-context_trace": "114", 
    "path": "\/var\/folders\/nd\/b8fyk_lx25b1ndyj4kmb2hk403cmxz\/T\/tmp13266469351066000997\/moe\/test_1", 
    "bytesRead": 8, 
    "endOfFile": false
  }
}

We clearly see the stored context information (tracer-context_*).

Using the jq tool, we can analyze the events, like calculating how many bytes the server has read for each user:

➜ jfr print --events jdk.FileRead --json flight.jfr |
  jq -r '
    .recording.events
    | group_by(.values."tracer-context_user")
    | map({
      user: .[0].values."tracer-context_user",
      bytesRead: (map(.values.bytesRead) | add)
    })
   | map([.user, .bytesRead])
   | ["User", "Bytes Read"]
   , .[]
   | @tsv
 '
User    Bytes Read
        3390101
bob     80
curly   100
frank   100
joe     80
john    90
larry   100
mary    90
moe     80
sally   100
sue     80

The empty user is for all the bytes read unrelated to any specific user (like class files), which is quite helpful.

Conclusion

This small example is just a glimpse of what is possible with JFR contexts. Jaroslav’s prototypical implementation is still limited; it, e.g., doesn’t support contexts at method sampling events, but it is already a significant improvement over the status quo. I’ll be creating follow-up blog posts as the prototype evolves and matures.

Thanks for coming so far, and see you next week for another blog post and maybe at a meet-up or conference (see Talks).

This article is part of my work in the SapMachine team at SAP, making profiling and debugging easier for everyone.

Level-up your Java Debugging Skills with on-demand Debugging

Debugging is one of the most common tasks in software development, so one would assume that all features of debuggers have ample coverage in tutorials and guides. Yet there are three hidden gems of the Java Debugging (JDWP) agent that allow you to delay the start of the debugging session till

  • you gave orders via jcmd (onjcmd=y option)
  • the program threw a specific exception (onthrow=<exception>)
  • the program threw an uncaught exception (onuncaught=y)

Before I tell you more about the specific options, I want to start with the basics of how to apply them:

Option Application

When you debug remotely in your IDE (IntelliJ IDEA in my case), the “Debug Configurations” dialog tells you which options you should pass to your remote JVM:

Just append more options by adding them to the -agentlib option, or by setting the _JAVA_JDWP_OPTIONS environment variable, which is comma-appended to the options.

All options only work correctly in the server mode (server=y) of the JDWP agent (suspend=y or suspend=n seem to exhibit the same behavior with onjcmd).

I’m now showing you how the three hidden gems work:

JCmd triggered debugging

There are often cases where the code that you want to debug is executed later in your program’s run or after a specific issue appears. So don’t waste time running the debugging session from the start of your program, but use the onjcmd=y option to tell the JDWP agent to wait with the debugging session till it is triggered via jcmd:

 ➜ java "-agentlib:jdwp=transport=dt_socket,server=y,suspend=y,address=*:5005,onjcmd=y" src/test/java/OnThrowAndJCmd.java &
 ➜ echo $! # get pid
 # wait some time and then start debugging on demand
 ➜ jcmd $! VM.start_java_debugging
jcmd 97145 VM.start_java_debugging
97145:
Debugging has been started.
Transport : dt_socket
Address : *:5005

jps is your friend if you want to find the process id of an already running JVM.

I created a sample class in my java-dbg repository on GitHub with a small sample program for this article. To use JCmd triggered with our IDE, we first have to create a remote debug configuration (see previous section); we can then start the sample program in the shell and trigger the start of the debugging session. Then, we start the remote debug configuration in the IDE and debug our program:

A similar feature long existed in the SAPJVM. In 2019 Christoph Langer from SAP decided to add it to the OpenJDK, where it was implemented in JDK 12 and has been there ever since. It is one of the many significant contributions of the SapMachine team.

Disclaimer: I’m part of this magnificent team, albeit not in 2019.

Exception triggered debugging

Far older than jcmd triggered are exception-triggered debugging sessions. There are two types:

  1. The throwing of a specific exception (byte-code or normal name, inner classes with $) can start the debugging session by using onthrow=<exception>. This is especially nice if you want to debug the cause of this specific exception. This feature can easily be used in combination with your favorite IDE.
  2. The existence of an uncaught exception can trigger the start of a debugging session by using onuncaught=y. The debugging context is your outermost main method, but it’s still helpful if you want to inspect the exception or the state of your application. A problem is that you cannot use the debuggers from IntelliJ IDEA or NetBeans to explore the context; you have to use the command line debugger jdb instead.

Due to historical reasons, you also have to supply a command that is executed when the debugging session starts via the launch option, but setting it to exit works just fine.

Using both trigger types is similar to the JCmd triggered debugging:

 ➜ java "-agentlib:jdwp=transport=dt_socket,server=y,suspend=y,address=*:5005,onthrow=Ex,launch=exit" src/test/java/OnThrowAndJCmd.java
# or
 ➜ java "-agentlib:jdwp=transport=dt_socket,server=y,suspend=y,address=*:5005,onuncaught=y,launch=exit" src/test/java/OnThrowAndJCmd.java

If you’re okay with using jdb, you can also use the launch option to call a script that starts jdb in a new tmux session, in our case, tmux_jdb.sh:

#!/bin/sh
tmux new-session -d -s jdb -- jdb -attach $2

We run our application using the JDWP agent with the onthrow=Ex,launch=sh tmux_jdb.sh option to start the jdb the first time the Ex exception is thrown and attach to the tmux session:

➜ java "-agentlib:jdwp=transport=dt_socket,server=y,suspend=y,address=*:5005,onthrow=Ex,launch=sh tmux_jdb.sh" src/test/java/OnThrowAndJCmd.java
# in another console after the exception is thrown
➜ tmux attach -t jdb

Where we can explore the current state of the application:

Debugging a specific exception has never been easier.

jdb and the JDWP on* options aren’t as widely used as graphical debuggers, so you might still find some bugs. I don’t know whether the stack trace in the second-to-last screenshot is a bug. Feel free to comment if you know the answer.

How to discover these features

You can either be like me and just drop into the JDK source and look into the debugInit.c file, the official documentation, or you use help option, which prints the following with JDK 21:

➜ java "-agentlib:jdwp=help"
               Java Debugger JDWP Agent Library
               --------------------------------

  (See the "VM Invocation Options" section of the JPDA
   "Connection and Invocation Details" document for more information.)

jdwp usage: java -agentlib:jdwp=[help]|[<option>=<value>, ...]

Option Name and Value            Description                       Default
---------------------            -----------                       -------
suspend=y|n                      wait on startup?                  y
transport=<name>                 transport spec                    none
address=<listen/attach address>  transport spec                    ""
server=y|n                       listen for debugger?              n
launch=<command line>            run debugger on event             none
onthrow=<exception name>         debug on throw                    none
onuncaught=y|n                   debug on any uncaught?            n
onjcmd=y|n                       start debug via jcmd?             n
timeout=<timeout value>          for listen/attach in milliseconds n
includevirtualthreads=y|n        List of all threads includes virtual threads as well as platform threads.
                                                                   n
mutf8=y|n                        output modified utf-8             n
quiet=y|n                        control over terminal messages    n

Obsolete Options
----------------
strict=y|n
stdalloc=y|n

Examples
--------
  - Using sockets connect to a debugger at a specific address:
    java -agentlib:jdwp=transport=dt_socket,address=localhost:8000 ...
  - Using sockets listen for a debugger to attach:
    java -agentlib:jdwp=transport=dt_socket,server=y,suspend=y ...

Notes
-----
  - A timeout value of 0 (the default) is no timeout.

Warnings
--------
  - The older -Xrunjdwp interface can still be used, but will be removed in
    a future release, for example:
        java -Xrunjdwp:[help]|[<option>=<value>, ...]

Of course, this only gives you a glance at the options, so reading the source code still revealed much of what I had before.

Conclusion

Hidden gems are everywhere in the Java ecosystem, even in widely used tools like debugging agents. Especially onthrow and onjcmd can improve the performance of on-demand debugging, as this allows us to trigger the start of the debugging session from outside the debugger.

I hope you can apply your newly gained knowledge the next time you have a complex problem to debug. Still curious about debugging? Come back next week for another blog post.

This article is part of my work in the SapMachine team at SAP, making profiling and debugging easier for everyone. Thanks to Thomas Darimont, with whom I discovered the hidden features while preparing for my talks on Java Debugging. I wrote this article on the train to Devoxx Belgium.