
I’m keenly interested in everything related to profiling on the JVM, especially if it is related to AsyncGetCallTrace, this tiny unofficial API that powers most profilers out there, heck I’m even in the process of adding an improved version to the OpenJDK, AsyncGetStackTrace.
During the discussions on the related JDK enhancement proposal and PRs fixing AsyncGetCallTrace bugs, one thing often arises: Why is AsyncGetCallTrace always called in the signal handler on top of the stack that we want to walk (like in my Writing a Profiler from Scratch series)?

JDK Flight Recorder (JFR) does not do this; it instead walks the stack in the sampler thread while pausing the sampled thread (implemented with a SuspendedThreadTask).

Update after talks on the JEP: The recommended way to use AsyncGetStackTrace will be to call it in a separate thread.
Advantages
Walking the thread in a sampler thread has multiple advantages: Only a few instructions run in the signal handler: the handler is either just busy waiting for the stack walking to finish, or the thread is stopped entirely. Most of the code runs in the sampler thread, walking one thread after another. This makes the code easier to debug and reason about, and the stack-walking code is less likely to mess up the stack of the sampled thread when something goes terribly wrong. These are part of the reasons why the JFR code silently ignores segmentation faults during stack walking:
One important difference to consider is that in JFR, in contrast to AGCT, there is only a single thread, the ThreadSampler thread, that is wrapped in the CrashProtection. Stack walking is different in JFR compared to AGCT, in that it is done by a different thread, during a point where the target is suspended. Originally, this thread sampler thread was not even part of the VM, although now it is a NonJavaThread. It has been trimmed to not involve malloc(), raii, and other hard-to-recover-from constructs, from the moment it has another thread suspended. Over the years, some transitive malloc() calls has snuck in, but it was eventually found due to rare deadlocking. Thomas brings a good point about crashes needing to be recoverable.
MarKUS Grönlund In A Comment on OpenJDK PR 8225
I digress here from the main topic of this article, but I think that the next comment of Markus Grönlund on the PR is interesting because it shows how pressures from the outside can lead to band-aid fixes that are never removed:
For additional context, I should add that the CrashProtection mechanism was mainly put in place as a result of having to deliver JFR from JRockit into Hotspot under a deadline, upholding feature-parity. The stack walking code was in really bad shape back then. Over the years, it has been hardened and improved much, and I have not seen any reported issues about JFR crashes in many years (we log when crashing in production).
An important difference is that AGCT allows more thread states compared to JFR, so there can be issues in that area that are not seen in JFR.
MarKUS Grönlund In A Comment on OpenJDK PR 8225
Back to the main topic: It is important to note that even when we walk a thread in a separate thread, we still have to make sure that we only use signal-safe methods while the sampled thread is waiting (thanks to Lukas Werling for pointing this out). The sampled thread might, for example, hold locks for malloc, so our sampled thread cannot use malloc without risking a dead-lock.
Disadvantages
There are, of course, disadvantages: Sampling in a signal handler is more straightforward, as we’re running in the context of the sampled thread and get passed the ucontext (with stack pointer, …) directly. It is more accurate, as we can trigger the sampling of the threads precisely at the time that we want (disregarding thread scheduling), and faster, as we do not busy wait in any thread.
We’re running on the same CPU core, which benefits caching, especially on NUMA CPUs (thanks to Francesco Nigro for pointing this out). Although the performance is rarely an issue with the stack-walking as its runtime is in the tens of microseconds, even if we include the whole signal processing.
Another major disadvantage is related to CPU time and perf-event-related profiling: The commonly used itimer (it has major problems, according to Felix Geisendörfer) and perf APIs send signals to threads in certain intervals. When we walk the stack in a separate thread, the triggered signal handlers must trigger the sampler thread to sample the specific thread.
This can be implemented by pushing the current thread id in a queue, and the sampler thread stops the sampled thread when it’s ready and walks the stack as before or by waiting in the signal handler until the sampler thread has finished walking the stack. The former is less performant because it sends an additional signal, and the latter is only significant if the walk requests of all threads are evenly distributed.
This problem can be lessened when we choose a different way of accessing the perf data: We can read the perf events in a loop and then just use the technique from wall-clock profiling. This is a significant modification of the inner workings of the profiler, and it is not possible with itimer-based profiling.
What is the real reason?
Walking in a separate thread has more advantages than disadvantages, especially when wall-clock profiling or valuing stability over slight performance gains. So why don’t tools like async-profiler implement their sampling this way? It’s because AsyncGetCallTrace currently doesn’t support it. This is the starting point of my small experiment: Could I modify the OpenJDK with just a few changes to add support for out-of-thread walking with AsyncGetCallTrace (subsequently proposing this for AsyncGetStackTrace too)?
Modifying AsyncGetCallTrace
Let us first take a look at the API to refresh our knowledge:
void AsyncGetCallTrace(ASGCT_CallTrace *trace, jint depth,
                       void* ucontext)
// Arguments:
//
//   trace    - trace data structure to be filled by the VM.
//   depth    - depth of the call stack trace.
//   ucontext - ucontext_t of the LWP
//
// ASGCT_CallTrace:
//   typedef struct {
//       JNIEnv *env_id;
//       jint num_frames;
//       ASGCT_CallFrame *frames;
//   } ASGCT_CallTrace;
//
// Fields:
//   env_id     - ID of thread which executed this trace.
//   num_frames - number of frames in the trace.
//                (< 0 indicates the frame is not walkable).
//   frames     - the ASGCT_CallFrames that make up this trace.
//                Callee followed by callers.
//
//  ASGCT_CallFrame:
//    typedef struct {
//        jint lineno;
//        jmethodID method_id;
//    } ASGCT_CallFrame;
If you’re new to AsyncGetCallTrace (and my blog), consider reading my Writing a Profiler from Scratch: Introduction article.
So we already pass an identifier of the current thread (env_id) to the API, which should point to the walked thread :
// This is safe now as the thread has not terminated
// and so no VM exit check occurs.
assert(thread ==
         JavaThread::thread_from_jni_environment(trace->env_id),
       "AsyncGetCallTrace must be called by " +
       "the current interrupted thread");
This is the only usage of the passed thread identifier, and why I considered removing it in AsyncGetStackTrace altogether. AsyncGetCallTrace uses the current thread instead:
Thread* raw_thread = Thread::current_or_null_safe();
The assertion above is only enabled in debug builds of the OpenJDK, which are rarely profiled. Therefore, the thread identifier is often ignored and is probably a historic relic. We can use this identifier to obtain the thread that the API user wants to profile and only use the current thread when the thread identifier is null (source):
Thread* raw_thread;
if (trace->env_id == nullptr) {
  raw_thread = Thread::current_or_null_safe();
} else {
  raw_thread =
    JavaThread::thread_from_jni_environment_raw(trace->env_id);
}
We can thereby support the new feature without modifying the API itself, only changing the behavior if the thread identifier does not reference the current thread.
The implementation can be found in my OpenJDK fork. This is still a prototype, but it works well enough for testing and benchmarking.
Modifying async-profiler
At the beginning of the article, I already told you how JFR walks the stack in a different thread. We are implementing similar code into async-profiler, restricting us to wall-clock profiling, as its implementation requires fewer modifications.
Before our changes, async-profiler would signal selected threads in a loop via
OS::sendSignalToThread(thread_id, SIGVTALRM)
(source) and records the sample directly in the signal handler (source):
void WallClock::signalHandler(
  int signo,
  siginfo_t* siginfo,
  void* ucontext) {
    ExecutionEvent event;
    event._thread_state = _sample_idle_threads ?
      getThreadState(ucontext) : THREAD_UNKNOWN;
    Profiler::instance()->recordSample(ucontext, _interval,
                                       EXECUTION_SAMPLE, &event);
}
The Profiler::recordSample the method does more than just call AsyncGetCallTrace; it also obtains C/C++ frames. However, this is insignificant for our modifications, as the additional stack walking is only related to the ucontext, not the thread.
We now modify this code so that we still send a signal to the sampled thread but only set a global ucontext and thread identifier (struct Data) in the signal handler, blocking till we finished walking the stack in the sampler thread, walking the stack in the latter (source):
struct Data {
    void* ucontext;
    JNIEnv* jni;
};

std::atomic<int> _thread_id;
std::atomic<Data*> _thread_data;

bool WallClock::walkStack(int thread_id) {
    // set the current thread
    _thread_id = thread_id;
    _thread_data = nullptr;

    // send the signal to the sampled thread
    if (!OS::sendSignalToThread(thread_id, SIGVTALRM)) {
        _thread_id = -1;
        return false;
    }
    // wait till the signal handler has set the ucontext and jni
    if (!waitWhile([&](){ return _thread_data == nullptr;},
                   10 * 1000 * 1000)) {
        _thread_id = -1;
        return false;
    }
    Data *data = _thread_data.load();
    // walk the stack
    ExecutionEvent event;
    event._thread_state = _sample_idle_threads ?
      getThreadState(data->ucontext) : THREAD_UNKNOWN;
    u64 ret = Profiler::instance()->recordSample(data->ucontext,
      _interval, EXECUTION_SAMPLE, &event, data->jni);

    // reset the thread_data, triggering the signal handler
    _thread_data = nullptr;
    return ret != 0;
}

void WallClock::signalHandler(
  int signo,
  siginfo_t* siginfo,
  void* ucontext) {
    // check that we are in the thread we are supposed to be
    if (OS::threadId() != _thread_id) {
        return;
    }

    Data data{
       ucontext,
       // Get a JNIEnv if it is deamed to be safe
       VMThread::current() == nullptr ? nullptr : VM::jni()
    };

    Data* expected = nullptr;
    if (!_thread_data.compare_exchange_strong(expected, &data)) {
        // another signal handler invocation
        // is already in progress
        return;
    }
    // wait for the stack to be walked, and block the thread
    // from executing
    // we do not timeout here, as this leads to difficult bugs
    waitWhile([&](){ return _thread_data != nullptr;});
}
The signal handler only stores the ucontext and thread identifier if it is run in the thread currently walked and uses compare_exchange_strong to ensure that the _thread_data is only set once. This prevents stalled signal handlers from concurrently modifying the global variables.
_thread_data.compare_exchange_strong(expected, &data) is equivalent to atomically executing:
if (_thread_data == expected) {
    _thread_data = &data;
    return true;
} else {
    expected = _thread_data;
    return false;
}
This ensures that the _thread_data is only set if it is null. Such operations are the base of many lock-free data structures; you can find more on this topic in the Wikipedia article on Compare-and-Swap (a synonym for compare-and-exchange).
Coming back to the signal handler implementation: The waitWhile method is a helper method that busy waits until the passed predicate does return false or the optional timeout is exhausted, ensuring that the profiler does not hang if something goes wrong.
The implementation uses the _thread_data variable to implement its synchronization protocol:

You can find the implementation in my async-profiler fork, but as with my OpenJDK fork: It’s only a rough implementation.
The implemented approach works fine with async-profiler, but it has a minor flaw: We depend on an implementation detail of the current iteration of OpenJDK. It is only safe to get the JNIEnv in a signal handler if the JVM has allocated a thread-local Thread object for the signaled thread:
JDK-8132510: it’s not safe to call GetEnv() inside a signal handler since JDK 9, so we do it only for threads already registered in ThreadLocalStorage
async-profiler source code
This issue was first discovered when Krzysztof Ślusarski (of “Async-Profiler – manual by use cases” fame) reported a related issue in the async-profiler bug tracker.
For a deeper dive, consider reading the comment of David Holmes to the references JDK issue:
The code underpinning __thread use is not async-signal-safe, which is not really a surprise as pthread_get/setspecific are not designated async-signal-safe either.
The problem, in glibc, is that first access of a TLS variable can trigger allocation [1]. This contrasts with using pthread_getspecific which is benign and so effectively async-signal-safe.
So if a thread is executing in malloc and it takes a signal, and the signal handler tries to use TLS (it shouldn’t but it does and has gotten away with it with pthread_getspecific), then we can crash or get a deadlock.
Excerpt FROm DAdvid HOlme’s COMMENT on issue JDK-8132510
We check this condition in our signal handler implementation with the line
VMThread::current() == nullptr ? nullptr : VM::jni()
with VMThread::current() being implemented as:
VMThread* VMThread::current() {
    return (VMThread*)pthread_getspecific(
      (pthread_key_t)_tls_index /* -1 */);
}
This implementation detail is not an issue for async-profiler as it might make assumptions. Still, it is undoubtedly a problem for the general approach I want to propose for my new AsyncGetStackTrace API.
Modifying AsyncGetCallTrace (2nd approach)
We want to identify the thread using something different from JNIEnv. The OS thread id seems to be a good fit. It has three significant advantages:
- It can be obtained independently from the JVM, depending on the OS rather than the JVM.
- Our
walkStackmethod already gets passed the thread id, so we don’t have to pass it from the signal handler to the sampler thread. - The mapping from thread id to
Threadhappens outside the signal handler in the AsyncGetCallTrace call, and the API sets theenv_idfield to the appropriate JNIEnv.
We have to add a new parameter os_thread_id to the API to facilitate this change (source):
// ...
//   os_thread_id - OS thread id of the thread which executed
//                  this trace, or -1 if the current thread
//                  should be used.
// ...
// Fields:
//   env_id     - ID of thread which executed this trace,
//                the API sets this field if it is NULL.
// ...
void AsyncGetCallTrace(ASGCT_CallTrace *trace, jint depth,
  void* ucontext, jlong os_thread_id)
The implementation can be found in my OpenJDK fork, but be aware that it is not yet optimized for performance as it iterates over the whole thread list for every call to find the Thread which matches the passed OS thread id.
Modifying async-profiler (2nd approach)
The modification to async-profiler is quite similar to the first approach. The only difference is that we’re not dealing with JNIEnv anymore. This makes the signal handler implementation slightly simpler (source):
void WallClock::signalHandler(
  int signo,
  siginfo_t* siginfo,
  void* ucontext) {
    // check that we are in the thread we are supposed to be
    if (OS::threadId() != _thread_id) {
        return;
    }
    void* expected = nullptr;
    if (!_ucontext.compare_exchange_strong(expected, ucontext)) {
        // another signal handler invocation
        // is already in progress
        return;
    }
    // wait for the stack to be walked, and block the thread
    // from executing
    // we do not timeout here, as this leads to difficult bugs
    waitWhile([&](){ return _ucontext != nullptr;});
}
You can find the full implementation in my async-profiler fork.
Now to the fun part (the experiment): Two drawbacks of the two previously discussed approaches are that one thread waits busily, and the other cannot execute all non-signal-safe code during that period. So the obvious next question is:
Could we walk a thread without stopping it?
In other words: Could we omit the busy waiting? An unnamed person suggested this.
The short answer is: It’s a terrible idea. The sampled thread modifies the stack while we’re walking its stack. It might even terminate while we’re in the middle of its previously valid stack. So this is a terrible idea when you don’t take many precautions.
The only advantage is that we can use non-signal-safe methods during stack walking. The performance of the profiling will not be significantly improved, as the signal sending and handling overhead is a magnitude larger than the stack walking itself for small traces. Performance-wise, it could only make sense for huge (1000 and more frames) traces.
Our central assumption is: The profiler takes some time to transition out of the signal handler of the sampled thread. Possibly longer than it takes to walk the topmost frames, which are most likely to change during the execution, in AsyncGetCallTrace.
But: Timing with signals is hard to predict (see this answer on StackExchange), and if the assumption fails, the resulting trace is either bogus or the stack walking leads to “interesting” segmentation faults. I accidentally tested this when I initially implemented the signal handler in my async-profiler and made an error. I saw error messages in places that I had not seen before.
So the results could be imprecise / sometimes incorrect. But we’re already sampling, so approximations are good enough.
The JVM might crash during the stack walking because the ucontext might be invalid and the thread stack changes (so that the stack pointer in the ucontext points to an invalid value and more), but we should be able to reduce the crashes by using enough precautions in AsyncGetCallTrace and testing it properly (I already implemented tests with random ucontexts in the draft for AsyncGetStackTrace).
The other option is to catch any segmentation faults that occur inside AsyncGetCallTrace. We can do this because we walk the stack in a separate thread (and JFR does it as well, as I’ve written at the beginning of this post). We can implement this by leveraging the ThreadCrashProtection clas,s which has, quite rightfully, some disclaimers:
/*
 * Crash protection for the JfrSampler thread. Wrap the callback
 * with a sigsetjmp and in case of a SIGSEGV/SIGBUS we siglongjmp
 * back.
 * To be able to use this - don't take locks, don't rely on
 * destructors, don't make OS library calls, don't allocate
 * memory, don't print, don't call code that could leave
 * the heap / memory in an inconsistent state, or anything
 * else where we are not in control if we suddenly jump out.
 */
class ThreadCrashProtection : public StackObj {
public:
  // ...
  bool call(CrashProtectionCallback& cb);
  // ...
};
We wrap the call to the actual AsyncGetCallTrace implementation of our second approach in this handler (source):
void AsyncGetCallTrace(ASGCT_CallTrace *trace, jint depth,
 void* ucontext, jlong os_thread_id) {
  trace->num_frames = ticks_unknown_state;
  AsyncGetCallTraceCallBack cb(trace, depth, ucontext,
                               os_thread_id);
  ThreadCrashProtection crash_protection;
  if (!crash_protection.call(cb)) {
    fprintf(stderr, "AsyncGetCallTrace: catched crash\n");
    if (trace->num_frames >= 0) {
      trace->num_frames = ticks_unknown_state;
    }
  }
}
This prevents all crashes related to walking the stack from crashing the JVM, which is also helpful for the AsyncGetCallTrace usage of the previous part of this article. The only difference is that crashes in the stack walking are considered a bug in a normal use case but are expected in this use case where we don’t stop the sampled thread.
Back to this peculiar case: The implementation in async-profiler is slightly more complex than just removing the busy waiting at the end. First, we must copy the ucontext in the signal handler because the ucontext pointer only points to a valid ucontext while the thread is stopped. Furthermore, we have to disable the native stack walking in the async-profiler, as it isn’t wrapped in code that catches crashes. We also have, for unknown reasons, to set the safemode option of async-profiler to 0.
The implementation of the signal handler is simple (just remove the wait from the previous version). It results in the following sequence diagram:

You can find the implementation on GitHub, albeit with known concurrency problems, but these are out-of-scope for this blog post and related to copying the ucontext atomically.
And now to the important question: How often did AsyncGetCallTrace crash? In the renaissance finagle-http benchmark (with a sampling interval of 10ms), it crashed in 592 of around 808000 calls, a crash rate of 0.07% and far better than expected.
The main problem can be seen when we look at the flame graphs (set the environment variable SKIP_WAIT to enable the modification):

Which looks not too dissimilar to the flame graph with busy waiting:
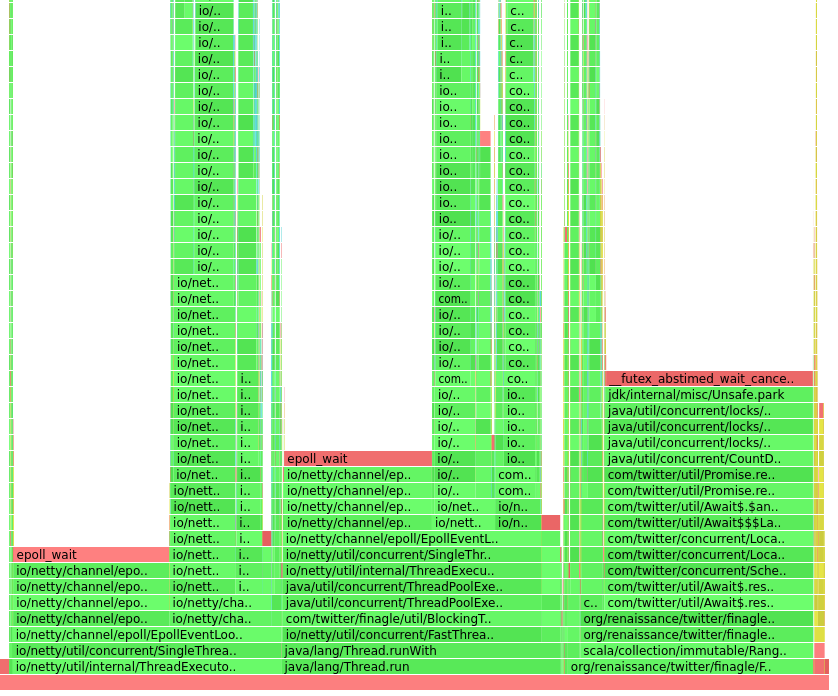
Many traces (the left part of the graph) are broken and do not appear in the second flame graph. Many of these traces seem to be aborted:

But this was an interesting experiment, and the implementation seems to be possible, albeit creating a safe and accurate profiler would be hard and probably not worthwhile: Catching the segmentation faults seems to be quite expensive: The runtime for the renaissance finagle-http benchmark is 83 seconds for the version with busy waiting and 84 seconds without, despite producing worse results.
Evaluation
We can now compare the performance of the original with the two prototypical implementations and the experimental implementation in a preliminary evaluation. I like using the benchmarks of the renaissance suite (version 0.14.2). For this example, I used the primarily single core, dotty benchmark with an interval of 1ms and 10ms:
java -agentpath:./build/lib/libasyncProfiler.so=start,\
                interval=INTERVAL,event=wall,\
                flamegraph,file=flame.html \
     -XX:+UnlockDiagnosticVMOptions -XX:DebugNonSafepoints \
     -jar renaissance.jar BENCHMARK
The shorter interval will make the performance impact of changes to the profiling more impactful. I’m profiling with my Threadripper 3995WX on Ubuntu using hyperfine (one warm-up run and ten measured runs each). The standard deviation is less than 0.4% in the following diagram, which shows the wall-clock time:

The number of obtained samples is roughly the same overall profiler runs, except for the experimental implementation, which produces around 12% fewer samples. All approaches seem to have a comparable overhead when considering wall-clock time. It’s different considering the user-time:

This shows that there is a significant user-time performance penalty when not using the original approach. This is expected, as we’re engaging two threads into one during the sampling of a specific threadTherefore, the wall-clock timings might.
The wall-clock timings might therefore be affected by my CPU having enough cores so that the sampler and all other threads run fully concurrently.
I tried to evaluate all approaches with a benchmark that utilizes all CPU (finagle-http), but my two new approaches have apparently severe shortcomings, as they produced only around a quarter of the samples compared to the original async-profiler and OpenJDK combination. This is worth fixing, but out-of-scope for this blog post, which already took more than a week to write.
Conclusion
This was the serious part of the experiment: Using AsyncGetCallTrace in a separate thread is possible with minor modifications and offers many advantages (as discussed before). It especially provides a more secure approach to profiling while not affecting performance if you’re system is not yet saturated: A typical trade-off between security and performance. I think that it should be up to the experienced performance engineer two decide and profilers should offer both when my JEP eventually makes the out-of-thread walking available on stock OpenJDKs.
The implementations in both the OpenJDK and async-profiler also show how to quickly implement, test and evaluate different approaches with widely used benchmarks.
Conclusion
The initial question, “Couldn’t we just use AsyncGetCallTrace in a separate thread?” can be answered with a resounding “Yes!”. Sampling in separate threads has advantages, but we have to block the sampled thread during stack walking; omitting this leads to broken traces.
If you have anything to add or found a flaw in my approaches or my implementations, or any other suggestions, please let me know 🙂
I hope this article gave you a glimpse into my current work and the future of low-level Java profiling APis.
This blog post is part of my work in the SapMachine team at SAP, making profiling easier for everyone.


