Writing a Profiler in 240 Lines of Pure Java

A few months back, I started writing a profiler from scratch, and the code since became the base of my profiler validation tools. The only problem with this project: I wanted to write a proper non-safepoint-biased profiler from scratch. This is a noble effort, but it requires lots C/C++/Unix programming which is finicky, and not everyone can read C/C++ code.

For people unfamiliar with safepoint bias: A safepoint is a point in time where the JVM has a known defined state, and all threads have stopped. The JVM itself needs safepoints to do major garbage collections, Class definitions, method deoptimizations, and more. Threads are regularly checking whether they should get into a safepoint, for example, at method entry, exit, or loop backjumps. A profiler that only profiles at a safepoint have an inherent bias because it only includes frames from the locations inside methods where Threads check for a safepoint. The only advantage is that the stack-walking at safepoints is slightly less error-prone, as there are fewer mutations of heap and stack. For more information, consider reading the excellent article Java Safepoint and Async Profiling by Seetha Wenner, the more technical one by JP Bempel, or the classic article Safepoints: Meaning, Side Effects and Overheads by Nitsan Wakart. To conclude: Safepoint-biased profilers don’t give you a holistic view of your application, but can still be helpful to analyze major performance issues where you look at the bigger picture.

People on the hackernews thread on this blog post pointed out that the code has potentially some concurrency and publication issues. I’ll fixed the code in the GitHub repository, but kept the old code here. The modifications are minor.

This blog post aims to develop a tiny Java profiler in pure Java code that everyone can understand. Profilers are not rocket science, and ignoring safepoint-bias, we can write a usable profiler that outputs a flame graph in just 240 lines of code.

You can find the whole project on GitHub. Feel free to use it as a base for your adventures (and if you do, feel free to write me on Twitter, where I regularly post on profiling-related topics).

We implement the profiler in a daemon thread started by a Java agent. This allows us to start and run the profiler alongside the Java program we want to profile. The main parts of the profiler are:

  • Main: Entry point of the Java agent and starter of the profiling thread
  • Options: Parses and stores the agent options
  • Profiler: Contains the profiling loop
  • Store: Stores and outputs the collected results

Main Class

We start by implementing the agent entry points:

public class Main {
    public static void agentmain(String agentArgs) {
        premain(agentArgs);
    }

    public static void premain(String agentArgs) {
        Main main = new Main();
        main.run(new Options(agentArgs));
    }

    private void run(Options options) {
        Thread t = new Thread(new Profiler(options));
        t.setDaemon(true);
        t.setName("Profiler");
        t.start();
    }
}

The premain is called when the agent is attached to the JVM at the start. This is typical because the user passed the -javagent to the JVM. In our example, this means that the user runs Java with

java -javaagent:./target/tiny_profiler.jar=agentArgs ...

But there is also the possibility that the user attaches the agent at runtime. In this case, the JVM calls the method agentmain. To learn more about Java agent, visit the JDK documentation.

Please be aware that we have to set the Premain-Class and the Agent-Class attributes in the MANIFEST file of our resulting JAR file.

Our Java agent parses the agent arguments to get the options. The options are modeled and parsed by the Options class:

public class Options {
    /** interval option */
    private Duration interval = Duration.ofMillis(10);

    /** flamegraph option */
    private Optional<Path> flamePath;

    /** table option */
    private boolean printMethodTable = true;
    ...
}

The exciting part of the Main class is its run method: The Profiler class implements the Runnable interface so that we can create a thread directly:

Thread t = new Thread(new Profiler(options));

We then mark the profiler thread as a daemon thread; this means that the JVM does terminate at the end of the profiled application even when the profiler thread is running:

t.setDaemon(true);

No, we’re almost finished; we only have to start the thread. Before we do this, we name the thread, this is not required, but it makes debugging easier.

t.setName("Profiler");
t.start();

Profiler Class

The actual sampling takes place in the Profiler class:

public class Profiler implements Runnable {
    private final Options options;
    private final Store store;

    public Profiler(Options options) {
        this.options = options;
        this.store = new Store(options.getFlamePath());
        Runtime.getRuntime().addShutdownHook(new Thread(this::onEnd));
    }

    private static void sleep(Duration duration) {
        // ...
    }

    @Override
    public void run() {
        while (true) {
            Duration start = Duration.ofNanos(System.nanoTime());
            sample();
            Duration duration = Duration.ofNanos(System.nanoTime())
                                        .minus(start);
            Duration sleep = options.getInterval().minus(duration);
            sleep(sleep);
        }
    }

    private void sample() {
        Thread.getAllStackTraces().forEach(
          (thread, stackTraceElements) -> {
            if (!thread.isDaemon()) { 
                // exclude daemon threads
                store.addSample(stackTraceElements);
            }
        });
    }

    private void onEnd() {
        if (options.printMethodTable()) {
            store.printMethodTable();
        }
        store.storeFlameGraphIfNeeded();
    }

We start by looking at the constructor. The interesting part is

Runtime.getRuntime().addShutdownHook(new Thread(this::onEnd));

which causes the JVM to call the Profiler::onEnd when it shuts down. This is important as the profiler thread is silently aborted, and we still want to print the captured results. You can read more on shutdown hooks in the Java documentation.

After this, we take a look at the profiling loop in the run method:

while (true) {
    Duration start = Duration.ofNanos(System.nanoTime());
    sample();
    Duration duration = Duration.ofNanos(System.nanoTime())
                                .minus(start);
    Duration sleep = options.getInterval().minus(duration);
    sleep(sleep);
}

This calls the sample method and sleeps the required time afterward, to ensure that the sample method is called every interval (typically 10 ms).

The core sampling takes place in this sample method:

Thread.getAllStackTraces().forEach(
  (thread, stackTraceElements) -> {
    if (!thread.isDaemon()) { 
        // exclude daemon threads
        store.addSample(stackTraceElements);
    }
});

We use here the Thread::getAllStackTraces method to obtain the stack traces of all threads. This triggers a safepoint and is why this profiler is safepoint-biased. Taking the stack traces of a subset of threads would not make sense, as there is no method in the JDK for this. Calling Thread::getStackTrace on a subset of threads would trigger many safepoints, not just one, resulting in a more significant performance penalty than obtaining the traces for all threads.

The result of Thread::getAllStackTraces is filtered so that we don’t include daemon threads (like the Profiler thread or unused Fork-Join-Pool threads). We pass the appropriate traces to the Store, which deals with the post-processing.

Store Class

This is the last class of this profiler and also the by far most significant, post-processing, storing, and outputting of the collected information:

package me.bechberger;

import java.io.BufferedOutputStream;
import java.io.OutputStream;
import java.io.PrintStream;
import java.nio.file.Path;
import java.util.HashMap;
import java.util.List;
import java.util.Map;
import java.util.Optional;
import java.util.stream.Stream;

/**
 * store of the traces
 */
public class Store {

    /** too large and browsers can't display it anymore */
    private final int MAX_FLAMEGRAPH_DEPTH = 100;

    private static class Node {
        // ...
    }

    private final Optional<Path> flamePath;
    private final Map<String, Long> methodOnTopSampleCount = 
        new HashMap<>();
    private final Map<String, Long> methodSampleCount = 
        new HashMap<>();

    private long totalSampleCount = 0;

    /**
     * trace tree node, only populated if flamePath is present
     */
    private final Node rootNode = new Node("root");

    public Store(Optional<Path> flamePath) {
        this.flamePath = flamePath;
    }

    private String flattenStackTraceElement(
      StackTraceElement stackTraceElement) {
        // call intern to safe some memory
        return (stackTraceElement.getClassName() + "." + 
            stackTraceElement.getMethodName()).intern();
    }

    private void updateMethodTables(String method, boolean onTop) {
        methodSampleCount.put(method, 
            methodSampleCount.getOrDefault(method, 0L) + 1);
        if (onTop) {
            methodOnTopSampleCount.put(method, 
                methodOnTopSampleCount.getOrDefault(method, 0L) + 1);
        }
    }

    private void updateMethodTables(List<String> trace) {
        for (int i = 0; i < trace.size(); i++) {
            String method = trace.get(i);
            updateMethodTables(method, i == 0);
        }
    }

    public void addSample(StackTraceElement[] stackTraceElements) {
        List<String> trace = 
            Stream.of(stackTraceElements)
                   .map(this::flattenStackTraceElement)
                   .toList();
        updateMethodTables(trace);
        if (flamePath.isPresent()) {
            rootNode.addTrace(trace);
        }
        totalSampleCount++;
    }

    // the only reason this requires Java 17 :P
    private record MethodTableEntry(
        String method, 
        long sampleCount, 
        long onTopSampleCount) {
    }

    private void printMethodTable(PrintStream s, 
      List<MethodTableEntry> sortedEntries) {
        // ...
    }

    public void printMethodTable() {
        // sort methods by sample count
        // the print a table
        // ...
    }

    public void storeFlameGraphIfNeeded() {
        // ...
    }
}

The Profiler calls the addSample method which flattens the stack trace elements and stores them in the trace tree (for the flame graph) and counts the traces that any method is part of.

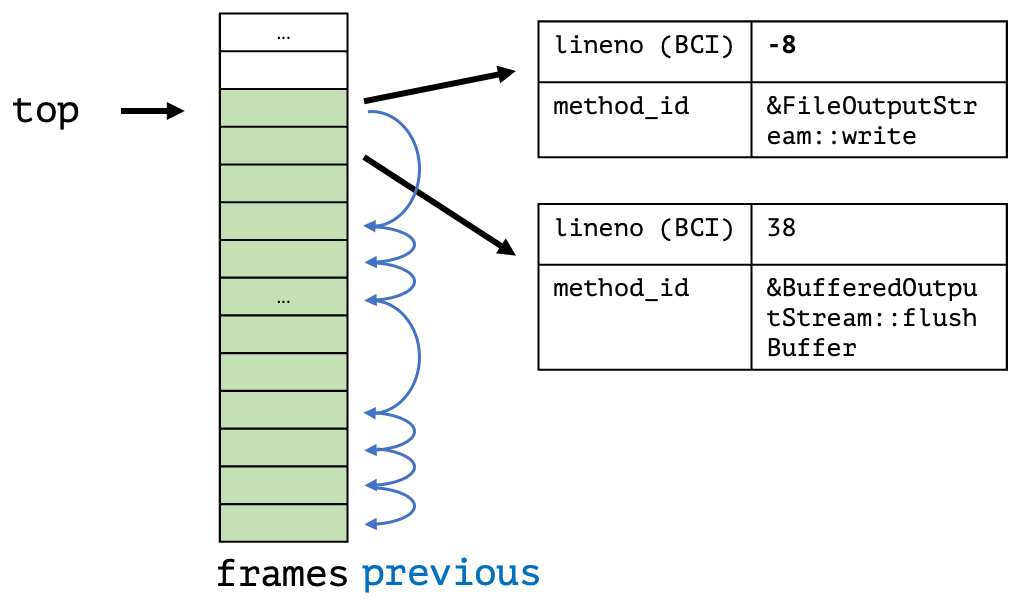
The interesting part is the trace tree modeled by the Node class. The idea is that every trace A -> B -> C (A calls B, B calls C, [C, B, A]) when returned by the JVM) can be represented as a root node with a child node A with child B with child C, so that every captured trace is a path from the root node to a leaf. We count how many times a node is part of the trace. This can then be used to output the tree data structure for d3-flame-graph which we use to create nice flamegraphs like:

Flame graph produced by the profiler for the renaissance dotty benchmark

Keep in my mind that the actual Node class is as follows:

private static class Node {                                                                                                                                                                                              
    private final String method;                                                                                                                                                                                         
    private final Map<String, Node> children = new HashMap<>();                                                                                                                                                          
    private long samples = 0;                                                                                                                                                                                            
                                                                                                                                                                                                                         
    public Node(String method) {                                                                                                                                                                                         
        this.method = method;                                                                                                                                                                                            
    }                                                                                                                                                                                                                    
                                                                                                                                                                                                                         
    private Node getChild(String method) {                                                                                                                                                                               
        return children.computeIfAbsent(method, Node::new);                                                                                                                                                              
    }                                                                                                                                                                                                                    
                                                                                                                                                                                                                         
    private void addTrace(List<String> trace, int end) {                                                                                                                                                                 
        samples++;                                                                                                                                                                                                       
        if (end > 0) {                                                                                                                                                                                      
            getChild(trace.get(end)).addTrace(trace, end - 1);                                                                                                                                                           
        }                                                                                                                                                                                                                
    }                                                                                                                                                                                                                    
                                                                                                                                                                                                                         
    public void addTrace(List<String> trace) {                                                                                                                                                                           
        addTrace(trace, trace.size() - 1);                                                                                                                                                                               
    }                                                                                                                                                                                                                    
                                                                                                                                                                                                                         
    /**                                                                                                                                                                                                                  
     * Write in d3-flamegraph format                                                                                                                                                                                     
     */                                                                                                                                                                                                                  
    private void writeAsJson(PrintStream s, int maxDepth) {                                                                                                                                                              
        s.printf("{ \"name\": \"%s\", \"value\": %d, \"children\": [", 
                 method, samples);                                                                                                                                 
        if (maxDepth > 1) {                                                                                                                                                                                              
            for (Node child : children.values()) {                                                                                                                                                                       
                child.writeAsJson(s, maxDepth - 1);                                                                                                                                                                      
                s.print(",");                                                                                                                                                                                            
            }                                                                                                                                                                                                            
        }                                                                                                                                                                                                                
        s.print("]}");                                                                                                                                                                                                   
    }                                                                                                                                                                                                                    
                                                                                                                                                                                                                         
    public void writeAsHTML(PrintStream s, int maxDepth) {                                                                                                                                                               
        s.print("""                                                                                                                                                                                                      
                <head>                                                                                                                                                                                                   
                  <link rel="stylesheet" 
                   type="text/css" 
                   href="https://cdn.jsdelivr.net/npm/d3-flame-graph@4.1.3/dist/d3-flamegraph.css">                                                                                
                </head>                                                                                                                                                                                                  
                <body>                                                                                                                                                                                                   
                  <div id="chart"></div>                                                                                                                                                                                 
                  <script type="text/javascript" 
                   src="https://d3js.org/d3.v7.js"></script>                                                                                                                               
                  <script type="text/javascript" 
                   src="https://cdn.jsdelivr.net/npm/d3-flame-graph@4.1.3/dist/d3-flamegraph.min.js"></script>                                                                             
                  <script type="text/javascript">                                                                                                                                                                        
                  var chart = flamegraph().width(window.innerWidth);                                                                                                                                                     
                  d3.select("#chart").datum(""");                                                                                                                                                                        
        writeAsJson(s, maxDepth);                                                                                                                                                                                        
        s.print("""                                                                                                                                                                                                      
                ).call(chart);                                                                                                                                                                                           
                  window.onresize = 
                      () => chart.width(window.innerWidth);                                                                                                                                                
                  </script>                                                                                                                                                                                              
                </body>                                                                                                                                                                                                  
                """);                                                                                                                                                                                                    
    }                                                                                                                                                                                                                    
}                                                                                                                                                                                                                        
                                                                                                                                                                                                                         

Tiny-Profiler

I named the final profiler tiny-profiler and its sources are on GitHub (MIT licensed). The profiler should work on any platform with a JDK 17 or newer. The usage is fairly simple:

# build it
mvn package

# run your program and print the table of methods sorted by their sample count
# and the flame graph, taking a sample every 10ms
java -javaagent:target/tiny-profiler.jar=flamegraph=flame.html ...

You can easily run it on the renaissance benchmark and create the flame graph shown earlier:

# download a benchmark
> test -e renaissance.jar || wget https://github.com/renaissance-benchmarks/renaissance/releases/download/v0.14.2/renaissance-gpl-0.14.2.jar -O renaissance.jar

> java -javaagent:./target/tiny_profiler.jar=flamegraph=flame.html -jar renaissance.jar dotty
...
===== method table ======
Total samples: 11217
Method                                      Samples Percentage  On top Percentage
dotty.tools.dotc.typer.Typer.typed            59499     530.44       2       0.02
dotty.tools.dotc.typer.Typer.typedUnadapted   31050     276.81       7       0.06
scala.runtime.function.JProcedure1.apply      24283     216.48      13       0.12
dotty.tools.dotc.Driver.process               19012     169.49       0       0.00
dotty.tools.dotc.typer.Typer.typedUnnamed$1   18774     167.37       7       0.06
dotty.tools.dotc.typer.Typer.typedExpr        18072     161.11       0       0.00
scala.collection.immutable.List.foreach       16271     145.06       3       0.03
...                                                                              

The overhead for this example is around 2% on my MacBook Pro 13″ for a 10ms interval, which makes the profiler usable when you ignore the safepoint-bias.

Conclusion

Writing a Java profiler in 240 lines of pure Java is possible and the resulting profiler could even be used to analyze performance problems. This profiler is not designed to replace real profilers like async-profiler, but it demystifies the inner workings of simple profilers.

I hope you enjoyed this code-heavy blog post. As always I’m happy for any feedback, issue, or PR. Come back next week for my next blog post on profiling.

This blog post is part of my work in the SapMachine team at SAP, making profiling easier for everyone. Significant parts of this post have been written below the English channel…

Validating Java Profiling APIs

In my last post, I covered a correctness bug in the fundamental Java profiling API AsyncGetCallTrace that I found just by chance. Now the question is: Could we find such bugs automatically? Potentially uncovering more bugs or being more confident in the absence of errors. I already wrote code to test the stability of the profiling APIs, testing for the absence of fatal errors, in my jdk-profiling-tester project. Such tools are invaluable when modifying the API implementation or adding a new API. This post will cover a new prototypical tool called trace_validation and its foundational concepts. I focus here on the AsyncGetCallTrace and GetStackTrace API, but due to the similarity in the code, JFR should have similar correctness properties.

The tool took far longer to bring to a usable(ish) state, this is why I didn’t write a blog post last week. I hope to be on schedule again next week.

AsyncGetCallTrace and GetStackTrace

A short recap from my blog series “Writing a Profiler from Scratch”: Both APIs return the stack trace for a given thread at a given point in time (A called B, which in turn called C, …):

AsyncGetCallTrace

The only difference is that AsyncGetCallTrace (ASGCT) returns the stack trace at any point in the execution of the program and GetStackTrace (GST) only at specific safe points, where the state of the JVM is defined. GetStackTrace is the only official API to obtain stack traces but has precision problems. Both don’t have more than a few basic tests in the OpenJDK.

Correctness

But when is the result of a profiling API deemed to be correct? If it matches the execution of the program.

This is hard to check if we don’t modify the JVM itself in general. But it is relatively simple to check for small test cases, where the most run-time is spent in a single method. We can then just check directly in the source code whether the stack trace makes sense. We come back to this answer soon.

The basic idea for automation is to compare the returns of the profiling API automatically to the returns of an oracle. But we sadly don’t have an oracle for the asynchronous AsyncGetCallTrace yet, but we can create one by weakening our correctness definition and building up our oracle in multiple stages.

Weakening the correctness definition

In practice, we don’t need the profiling APIs to return the correct result in 100% of all cases and for all frames in the trace. Typical profilers are sampling profilers and therefore approximate the result anyway. This makes the correctness definition easier to test, as it let’s us make the trade-off between feasibility and precision.

Layered oracle

The idea is now to build our oracle in different layers. Starting with basic assumptions and writing tests to verify that the layer above is probably correct too. Leading us to our combined test of asynchronous AsyncGetCallTrace. This has the advantage that every check is relatively simple, which is important, because the whole oracle depends on how much we trust the basic assumptions and the tests that verify that a layer is correct. I describe the layers and checks in the following:

Different layers of trace_validation

Ground layer

We start with the most basic assumption as our ground layer: An approximation of the stack traces can be obtained by instrumenting the byte code at runtime. The idea is to push at every entry of a method the method and its class (the frame) onto a stack and to pop it at every exit:

class A {
 void methodB() {
   // ...
 }
}

Is transformed into:

class A {
 void methodB() {
   trace.push("A", "methodB");
   // ...
   trace.pop();
 }
}

The instrumentation agent modifies the bytecode at runtime, so every exit of the method is recorded. I used the great Javassist library for the heavy lifting. We record all of this information in thread-local stacks.

This does not capture all methods, because we cannot modify native methods which are implemented in C++, but it covers most of the methods. This is what I meant by an approximation before. A problem with this is the cost of the instrumentation. We can make a trade-off between precision and usefulness by only instrumenting a portion of methods.

We can ask the stack data structure for an approximation of the current stack trace in the middle of every method. These traces are by construction correct, especially when we implement the stack data structure in native code, only exposing the Trace::push and Trace::pop methods. This limits the code reordering by the JVM.

GetStackTrace layer

This API is, as I described above, the official API to get the stack traces and it is not limited to basic stack walking, as it walks only when the JVM state is defined. One could therefore assume that it returns the correct frames. This is what I did in my previous blog post. But we should test this assumption: We can create a native Trace::check which calls GetStackTrace and checks that all frames from Trace are present and in the correct order. Calls to this method are inserted after the call to Trace::push at the beginning of methods.

There are usually more frames present in the return of GetStackTrace, but it is safe to assume that the correctness attributes approximately hold true for the whole GetStackTrace too. One could of course check the correctness of GetStackTrace at different parts of the methods. I think that this is probably unnecessary, as common Java programs call methods every few bytecode instructions.

This layer gives us now the ability to get the frames consisting of method id and location at safe points.

Safe point AsyncGetCallTrace layer

We can now use the previous layer and the fact that the result of both APIs has almost the same format, to check that AsyncGetCallTrace returns the correct result at safe points. Both APIs should yield the same results there. The check here is as simple as calling both APIs in the Trace::check method and comparing their results (omitting the location info as this is less stable). This has of course the same caveats as in the previous layer, but this is acceptable in my opinion.

If you’re curious: The main difference between the frames of both APIs is the magic number that ASGCT and GST use to denote native methods in the location field.

Async AsyncGetCallTrace layer

Our goal is to convince ourselves that AsyncGetCallTrace is safe at non safepoints under the assumption that AsyncGetCallTrace is safe at safe points (here the beginning of methods). The solution consists of two parts: The trace stack which contains the current stack trace and the sample loop which calls AsyncGetCallTrace asynchronously and compares the returns with the trace stack.

The trace stack datastructure allows to push and pop stack traces on method entry and exit. It consists of a large frames array which contains the current frames: index 0 has the bottom frame and index top contains the top most frame (the reverse order compared to AsyncGetCallTrace). The array is large enough, here 1024 entries, to be able to store stack traces of all relevant sizes. It is augmented by a previous array which contains the index of the top frame of most recent transitive caller frame of the current top frame.

Trace stack data structure used to store the stack of stack traces

We assume here that the caller trace is a sub trace of the current trace, with only the caller frame differing in the location (lineno here). This is due to the caller frame location being the beginning of the method where we obtained the trace. The calls to other methods have different locations. We mark the top frame location therefore with a magic number to state that this information changes during the execution of the method.

This allows us to store the stack of stack traces in a compact manner. We create such a data structure per thread in thread local storage. This allows us to obtain a possibly full sub trace at every point of the execution, with only the top frame location of the sub trace differing. We can use this to check the correctness of AsyncGetCallTrace at arbitrary points in time:

We create a loop in a separate thread which sends a signal to a randomly chosen running Java thread and use the signal handler to call AsyncGetCallTrace for the Java thread and to obtain a copy of the current trace stack. We then check that the result is as expected. Be aware of the synchronization.

With this we can be reasonably certain that AsyncGetCallTrace is correct enough, when all layer tests run successfully on a representative benchmark like renaissance. An prototypical implementation of all of this is my trace_validation project: It runs with the current head of the OpenJDK without any problems, except for an error rate of 0.003% percent for the last check (depending on the settings, but also with two caveats: the last check still has the problem of sometimes hanging, but I’ll hope to fix it in the next few weeks and I only tested it on Linux x86.

There is another possible way to implement the last check which I didn’t implement (yet), but which is still interesting to explore:

Variant of the Async AsyncGetCallTrace check

We can base this layer on top of the GetStackTrace layer too by exploiting the fact that GetStackTrace blocks at non safe points until a safe point is reached and then obtain the stack trace (see JBS). Like with the other variant of the check, we create a sample loop in a separate thread, pick a random Java thread, send it a signal, and then call AsyncGetCallTrace in the signal handler. But directly after sending the signal, we call GetStackTrace, to obtain a stack trace at the next safe point. The stack trace should be roughly the same as the AsyncGetCallTrace trace, as the time delay between their calls is minimal. We can compare both traces and thereby make an approximate check.

The advantage is that we don’t do any instrumentation with this approach and only record the stack traces that we really need. The main disadvantage is that it is more approximate as the time between timing of AsyncGetCallTrace and GetStackTrace is not obvious and certainly implementation and load specific. I did not yet test it, but might do so in the future because the setup should be simple enough to add it to the OpenJDK as a test case.

Update 20th March: I implemented this variant (and it will be soon the basis of a JTREG test) and found an error related to custom class loaders.

Update 21st March: I implemented the reduced version in a stand-alone agent that can be found on GitHub.

Conclusion

I’ve shown you in this article how we can test the correctness of AsyncGetCallTrace automatically using a multi level oracle. The implementation differs slightly and is more complicated then expected, because of the percularities of writing an instrumentation agent with a native agent and a native library.

I’m now fairly certain that AsyncGetCallTrace is correct enough and hope you’re too. Please try out the underlying project and come forward with any issues or suggestions.

This blog post is part of my work in the SapMachine team at SAP, making profiling easier for everyone.