A short primer on Java debugging internals

I wanted to write about a small side project this week: A few months back, I got carried away with understanding how Java debugging works. The following is an hors d’oeuvre, a small post in between my series on profiling, on the Java Platform Debugging Architecture.

All Java debuggers use the Java Debug Wire Protocol (JDWP) to communicate with the JVM, usually using the Java Debug Interface (JDI) abstraction Layer. The protocol can be used to remote debug, but the JVM and the debugger are commonly on the same machine. Therefore, the design did not take latency into account, and it requires sending many small messages, but this is a topic for another blog post. The actual architecture of debuggers differs slightly:

The architecture of the IntelliJ and the VSCode Java debuggers

The IntelliJ debugger calls the JDI interface directly. The VSCode debugger, in contrast, uses its own protocol called Debug Adapter Protocol, which is for debugging what the Language Server Protocol is for code editing, to quote the DAP page:

The idea behind the Debug Adapter Protocol (DAP) is to abstract the way how the debugging support of development tools communicates with debuggers or runtimes into a protocol. Since it is unrealistic to assume that existing debuggers or runtimes adopt this protocol any time soon, we rather assume that an intermediary component – a so called Debug Adapter – adapts an existing debugger or runtime to the Debug Adapter Protocol.

Debug Adapter Protocol

But the JVM does not implement this protocol (although it would certainly have its benefits, so if you’re looking for a project during the winter holidays…), so VSCode communicates with a so-called Java Debug Server, which is based on the Eclipse debugger, which translates between DAP and JDWP.

Back to the JDWP protocol: JDWP knows four different types of packets.

  • Handshake: The string JDWP-Handshake is sent from the Debugger (client) to the JDWP Agent/JVM (Server) and back. This initiates the debugging session.
  • Request: A request from the client to the server, like SetBreakpoint
  • Reply: The response to the request
  • Event: A collection of events of the same kind that happened in the JVM, like ClassPrepare, sent from the JVM to the Debugger to notify it of something, like the preparation of a specific class.

I wrote a small logger which intercepts the JDWP requests, replies, and events, synthesizing them into JDWP programs in a small language. These programs may start with a cause, which probably started the sequence of requests. This allows us to understand better how the debugger interacts with the JVM. For the purpose of this blog post, we only consider a small hello world program:

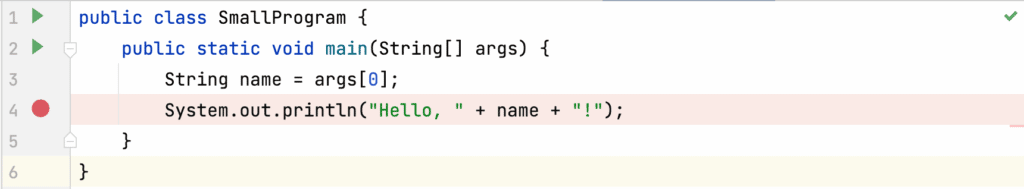
We put a break-point on line 4 using the IntelliJ debugger and run this debugging session with my logger. I’ll go into all the sent and received packets in this post, but just to give you the gist of the communication, here is the simplified sequence diagram:

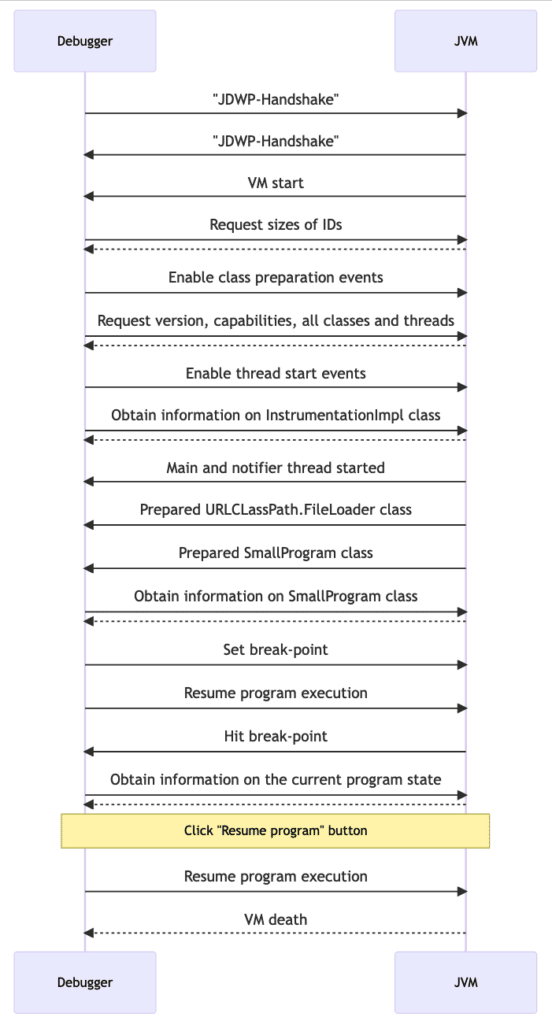
The debugging session starts with the JVM informing the debugger of the start and the debugger then requesting the sizes of the different IDs used in this session (e.g., that a method ID is 8 bytes wide, …):

((= cause (events Event Composite ("suspendPolicy")=(wrap "byte" 2) ("events" 0 "kind")=(wrap "string" "VMStart") ("events" 0 "requestID")=(wrap "int" 0) ("events" 0 "thread")=(wrap "thread" 1)))
  (= var0 (request VirtualMachine IDSizes)))

// the reply to the IDSizes request is
IDSizesReply(fieldIDSize=IntValue(8), methodIDSize=IntValue(8), objectIDSize=IntValue(8), referenceTypeIDSize=IntValue(8), frameIDSize=IntValue(8))

Typically one starts the debugging session with suspend=y, so that the JVM stops its execution till the debugger is ready. The debugger starts by requesting to get events for every class preparation and thread starts, some information on the debugging capabilities of the JVM and information on the loaded classes, the sun.instrument.InstrumentationImpl class in particular:

((= cause (request EventRequest Set ("eventKind")=(wrap "byte" 8) ("suspendPolicy")=(wrap "byte" 0)))
  (= var0 (request EventRequest Set ("eventKind")=(wrap "byte" 8) ("suspendPolicy")=(wrap "byte" 0)))
  (= var1 (request VirtualMachine Version))
  (= var2 (request VirtualMachine Capabilities))
  (= var3 (request VirtualMachine CapabilitiesNew))
  (= var4 (request VirtualMachine AllClassesWithGeneric)))
((= cause (request VirtualMachine TopLevelThreadGroups))
  (= var0 (request VirtualMachine TopLevelThreadGroups)))
((= cause (request EventRequest Set ("eventKind")=(wrap "byte" 6) ("suspendPolicy")=(wrap "byte" 0)))
  (= var0 (request EventRequest Set ("eventKind")=(wrap "byte" 6) ("suspendPolicy")=(wrap "byte" 0)))
  (= var1 (request ReferenceType SourceDebugExtension ("refType")=(wrap "klass" 456)))
  (= var2 (request ReferenceType MethodsWithGeneric ("refType")=(wrap "klass" 456)))
  (for iter0 (get var2 "declared") 
    (= var3 (request Method LineTable ("methodID")=(get iter0 "methodID") ("refType")=(wrap "klass" 456)))))

InstrumentationImpl implements the Instrumentation interface:

This class provides services needed to instrument Java programming language code. Instrumentation is the addition of byte-codes to methods for the purpose of gathering data to be utilized by tools. Since the changes are purely additive, these tools do not modify application state or behavior. Examples of such benign tools include monitoring agents, profilers, coverage analyzers, and event loggers.

https://docs.oracle.com/

The debugger uses the AllClassesWithGeneric request (line 6) to obtain a mapping of class names to class IDs (line 8) which the debugger then used to get the class ID of the InstrumentationImpl and obtain information on this class. This is a typical pattern for JDI when the debugger requests any information on a class.

The JVM then sends two ThreadStart events for the main and the JVM internal notification thread:

((= cause (events Event Composite ("suspendPolicy")=(wrap "byte" 0) ("events" 0 "kind")=(wrap "string" "ThreadStart") ("events" 0 "requestID")=(wrap "int" 4) ("events" 0 "thread")=(wrap "thread" 1097)))
)
((= cause (events Event Composite ("suspendPolicy")=(wrap "byte" 0) ("events" 0 "kind")=(wrap "string" "ThreadStart") ("events" 0 "requestID")=(wrap "int" 4) ("events" 0 "thread")=(wrap "thread" 1)))
)

The notification thread is:

[...] new NotificationThread that is visible to the external view and offloads the ServiceThread from sending low memory and other notifications that could result in Java calls ( GC and diagnostic commands notifications) by moving these activities in this new NotificationThread.
https://mail.openjdk.org/pipermail/jmx-dev/2019-August/001061.html

The JVM also sends the ClassPrepare event for the URLCLassPath.FileLoader class:

((= cause (events Event Composite ("suspendPolicy")=(wrap "byte" 0) ("events" 0 "kind")=(wrap "string" "ClassPrepare") ("events" 0 "refTypeTag")=(wrap "byte" 1) ("events" 0 "requestID")=(wrap "int" 2) ("events" 0 "signature")=(wrap "string" "Ljdk/internal/loader/URLClassPath$FileLoader$1;") ("events" 0 "status")=(wrap "int" 7) ("events" 0 "thread")=(wrap "thread" 1) ("events" 0 "typeID")=(wrap "klass" 1099)))
)

Which is a “Nested class used to represent a loader of classes and resources from a file URL that refers to a directory.” used internally during the loading of classes from files.

But then, finally, the JVM loaded the SmallProgram class and sends a ClassPrepare event. This causes the debugger to obtain information on the class:

((= cause (events Event Composite ("suspendPolicy")=(wrap "byte" 1) ("events" 0 "kind")=(wrap "string" "ClassPrepare") ("events" 0 "refTypeTag")=(wrap "byte" 1) ("events" 0 "requestID")=(wrap "int" 34) ("events" 0 "signature")=(wrap "string" "LSmallProgram;") ("events" 0 "status")=(wrap "int" 3) ("events" 0 "thread")=(wrap "thread" 1) ("events" 0 "typeID")=(wrap "klass" 1100) ("events" 1 "kind")=(wrap "string" "ClassPrepare") ("events" 1 "refTypeTag")=(wrap "byte" 1) ("events" 1 "requestID")=(wrap "int" 2) ("events" 1 "signature")=(wrap "string" "LSmallProgram;") ("events" 1 "status")=(wrap "int" 3) ("events" 1 "thread")=(wrap "thread" 1) ("events" 1 "typeID")=(wrap "klass" 1100)))
  (= var0 (request ReferenceType SourceFile ("refType")=(get cause "events" 0 "typeID")))
  (= var1 (request ReferenceType SourceDebugExtension ("refType")=(get cause "events" 0 "typeID")))
  (= var2 (request ReferenceType MethodsWithGeneric ("refType")=(get cause "events" 0 "typeID")))
  (for iter0 (get var2 "declared") 
    (= var3 (request Method LineTable ("methodID")=(get iter0 "methodID") ("refType")=(get cause "events" 0 "typeID")))))

The debugger then sets the break-point using the mappings obtained before…

((= cause (request EventRequest Set ("eventKind")=(wrap "byte" 2) ("suspendPolicy")=(wrap "byte" 2) ("modifiers" 0 "kind")=(wrap "string" "LocationOnly") ("modifiers" 0 "loc" "codeIndex")=(wrap "long" 4) ("modifiers" 0 "loc" "declaringType")=(wrap "class-type" 1100) ("modifiers" 0 "loc" "methodRef")=(wrap "method" 105553134992648)))
  (= var0 (request EventRequest Set ("eventKind")=(wrap "byte" 2) ("suspendPolicy")=(wrap "byte" 2) ("modifiers" 0 "kind")=(wrap "string" "LocationOnly") ("modifiers" 0 "loc" "codeIndex")=(wrap "long" 4) ("modifiers" 0 "loc" "declaringType")=(wrap "class-type" 1100) ("modifiers" 0 "loc" "methodRef")=(wrap "method" 105553134992648))))

… and requests the resuming of the program execution. The JVM then hits the break-point and requests lots of information: Information on the transitive superclasses, the current thread, the current stack trace, and every local variable in the currently executed method:

((= cause (events Event Composite ("suspendPolicy")=(wrap "byte" 2) ("events" 0 "kind")=(wrap "string" "Breakpoint") ("events" 0 "requestID")=(wrap "int" 35) ("events" 0 "thread")=(wrap "thread" 1) ("events" 0 "location" "codeIndex")=(wrap "long" 4) ("events" 0 "location" "declaringType")=(wrap "class-type" 1100) ("events" 0 "location" "methodRef")=(wrap "method" 105553134992648)))
  (rec recursion0 1000 var3 (request ClassType Superclass ("clazz")=(get cause "events" 0 "location" "declaringType"))
    (reccall var6 recursion0 ("clazz")=(get var3 "superclass"))
    (= var4 (request ReferenceType Interfaces ("refType")=(get var3 "superclass")))
    (= var5 (request ReferenceType FieldsWithGeneric ("refType")=(get var3 "superclass"))))
  (= var0 (request ReferenceType Interfaces ("refType")=(get cause "events" 0 "location" "declaringType")))
  (= var1 (request ReferenceType FieldsWithGeneric ("refType")=(get cause "events" 0 "location" "declaringType")))
  (= var2 (request ReferenceType ConstantPool ("refType")=(get cause "events" 0 "location" "declaringType")))
  (= var5 (request ThreadReference Name ("thread")=(get cause "events" 0 "thread")))
  (= var6 (request ThreadReference Status ("thread")=(get cause "events" 0 "thread")))
  (= var7 (request ThreadReference ThreadGroup ("thread")=(get cause "events" 0 "thread")))
  (= var8 (request ThreadReference FrameCount ("thread")=(get cause "events" 0 "thread")))
  (= var9 (request ThreadReference Frames ("length")=(get var8 "frameCount") ("startFrame")=(wrap "int" 0) ("thread")=(get cause "events" 0 "thread")))
  (= var10 (request ThreadGroupReference Name ("group")=(get var7 "group")))
  (= var11 (request Method Bytecodes ("methodID")=(get cause "events" 0 "location" "methodRef") ("refType")=(get var9 "frames" 0 "location" "declaringType")))
  (= var12 (request Method IsObsolete ("methodID")=(get cause "events" 0 "location" "methodRef") ("refType")=(get var9 "frames" 0 "location" "declaringType")))
  (= var13 (request Method VariableTableWithGeneric ("methodID")=(get cause "events" 0 "location" "methodRef") ("refType")=(get var9 "frames" 0 "location" "declaringType")))
  (= var15 (request StackFrame GetValues ("frame")=(get var9 "frames" 0 "frameID") ("thread")=(get cause "events" 0 "thread") ("slots" 0 "sigbyte")=(wrap "byte" 91) ("slots" 0 "slot")=(wrap "int" 0)))
  (= var14 (request StackFrame GetValues ("frame")=(get var9 "frames" 0 "frameID") ("thread")=(get cause "events" 0 "thread") ("slots" 0 "sigbyte")=(getTagForValue (get var9 "frames" 0 "frameID")) ("slots" 0 "slot")=(wrap "int" 1)))
  (= var16 (request ObjectReference ReferenceType ("object")=(get var14 "values" 0)))
  (= var17 (request ObjectReference ReferenceType ("object")=(get var15 "values" 0)))
  (= var18 (request ArrayReference Length ("arrayObject")=(get var15 "values" 0)))
  (= var19 (request ReferenceType SourceFile ("refType")=(get var16 "typeID")))
  (= var21 (request ReferenceType Interfaces ("refType")=(get var16 "typeID")))
  (= var22 (request ReferenceType SourceDebugExtension ("refType")=(get var16 "typeID")))
  (= var23 (request ClassType Superclass ("clazz")=(get var16 "typeID")))
  (= var24 (request ArrayReference GetValues ("arrayObject")=(get var15 "values" 0) ("firstIndex")=(wrap "int" 0) ("length")=(get var18 "arrayLength")))
  (for iter1 (get var21 "interfaces") 
    (= var22 (request ReferenceType Interfaces ("refType")=iter1)))
  (= var25 (request StringReference Value ("stringObject")=(get var24 "values" 0))))

This allows the debugger to show us the following:

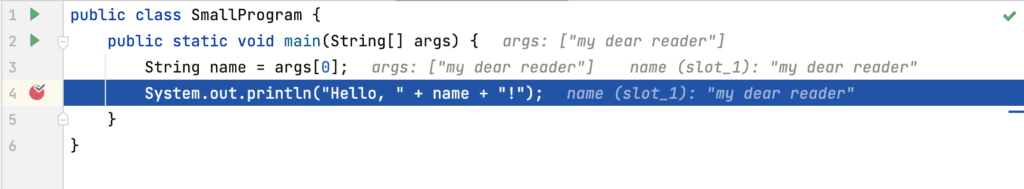
We then press the “Resume Program” button in the IDE. This causes the debugger to send a resume request. This is the last significant communication between the debugger and JVM that we see in our logs, there should at least be a VM death event, but our Java agent-based logger cannot record this.

You can find the transcript of the communication on GitHub. The logger tool is not yet public, but I hope to publish it in the next year. Although it still contains bugs, it is only usable for understanding JDWP and as a basis for other tools.

Thanks for reading this article till here. My next post will be part of the “Writing a profiler from scratch” series again.

This blog post is part of my work in the SapMachine team at SAP, making profiling easier for everyone.

Writing a Profiler from Scratch: Introduction

Async-profiler is undoubtedly one of the most used open-source Java profilers out there. Its most commonly used feature is sampling a given Java program’s stack traces and visualizing them as a flame graph. I would recommend reading the excellent async-profiler manual by Krzysztof Ślusarski or taking a look at my profiling playlist on YouTube if you’re new to this tool. After using the async-profiler for a while, you might wonder: How does this tool work? And, of course, if you’re someone like me: Could I write a stripped-down version to learn how it really works? I did this a few years back in university when I wanted to understand how LR(1) parser generators work: Turns out it is a lot of work, but my parser generator can output GIFs.

This blog series will take you with me on this journey, where we start with a small tool and see where curiosity leads us. It’s helpful if you know some C/C++ and have profiled Java using async-profiler before, which helps you better understand my code snippets and the profiling Jargon.

All the code will present on GitHub, and I’m happy for any suggestions, bug reports, and comments either under this blog post or on GitHub.

The aim of this series is

  • to understand how a sampling profiler works
  • to write a simple profiler, and possibly related tools, based on the AsyncGetCallTrace API
  • to have some good tooling which I use in OpenJDK tests, to make the used APIs safer and more reliable

The aim is not to write anything vaguely production ready: async-profiler has too many features to count and is battle-tested.

Come with me on this journey of knowledge, starting with a simple tool that just counts how many times AsyncGetCallTrace could not trace the stack.

The fundamental API that we will be relying on is the AsyncGetCallTrace API of the OpenJDK: This API can be used to obtain the stack trace (which methods are on the stack) for a given thread at any time. This makes it quite useful for writing accurate profilers. The API was introduced in November 2002 for Sun Studio. However, Sun removed it in January 2003 and demoted it to an internal API, but most profiling applications still use it. The following part of this post is inspired by Nitsan Wakart’s post, The Pros and Cons of AsyncGetCallTrace Profilers.

The AsyncGetCallTrace API is defined in the forte.cpp file:

typedef struct {
  jint lineno;         // BCI in the source file, or < 0 for native methods
  jmethodID method_id; // method executed in this frame
} ASGCT_CallFrame;

typedef struct {
  JNIEnv *env_id;   // Env where trace was recorded
  jint num_frames;  // number of frames in this trace, < 0 gives us an error code
  ASGCT_CallFrame *frames; // recorded frames 
} ASGCT_CallTrace; 

void AsyncGetCallTrace(ASGCT_CallTrace *trace, // pre-allocated trace to fill
                       jint depth,             // max number of frames to walk
                       void* ucontext);        // signal context

One typically uses this API by pinging a thread using a signal, stopping the thread, and invoking the signal handler, which in turn calls AsyncGetCallTrace with the execution context of the stopped thread (the ucontext) so that AsyncGetCallTrace can walk the thread, skipping all C/C++ frames on the stack and only storing the native (from native methods) and Java frames in the frames array. The signal handler has to process the trace, but this is for another post. We will just store the number of times that AsyncGetCallTrace was successful and unsuccessful.

Be aware that we cannot allocate any memory outside the stack in a signal handler. For this reason, we have to preallocate the data structures for AsyncGetCallTrace. There are a few C library functions that are guaranteed to be signal safe. To learn more about signals, consider reading Introduction To Unix Signals Programming, or similar sources. But don’t be confused with the terms thread and process. In Unix (Mac OS, Linux, BSD), threads are processes that share the same address space. Every (non-virtual/Loom) thread in Java is backed by an OS thread.

As an example of calling AsyncGetCallTrace, consider profiling the following Java code:

public class BasicSample {

    public void waitForever() throws InterruptedException {
        System.out.print("Waiting forever...");
        for (int i = 0; i < 100; i++) {
            Thread.sleep(10);
            System.out.print(".");
        }
        System.out.println("done");
    }

    public static void main(String[] args) throws InterruptedException {
        new BasicSample().waitForever();
    }
}

During profiling, we call AsyncGetCallTrace often, but let’s visualize a trace when the JVM runs one of the println lines.

AsyncGetCallTrace on a small example, using the demo code for JEP 435

Interrupting a thread at any point and running some code can have stability implications. If you’re interested in these when using AsyncGetCallTrace, head over to the async-profiler manual, where I co-wrote the section on this topic. This small sample tool seems to be quite good at triggering a specific fault in JDK 19+36, run the tool of this blog post yourself to find it.

The signal handler in our small example is the following:

std::atomic<size_t> failedTraces = 0;
std::atomic<size_t> totalTraces = 0;

static void signalHandler(int signo, siginfo_t* siginfo, void* ucontext) {
  const int MAX_DEPTH = 512; // max number of frames to capture
  static ASGCT_CallFrame frames[MAX_DEPTH];
  ASGCT_CallTrace trace;
  trace.frames = frames;
  trace.num_frames = 0;
  trace.env_id = env; // we obtained this via the OnVMInit hook
  
  // call AsyncGetCallTrace
  asgct(&trace, MAX_DEPTH, ucontext);

  // process the results
  totalTraces++;
  if (trace.num_frames < 0) {
    failedTraces++;
  }
}

We use atomic variables here to increment the two counting variables in parallel. We cannot use any locks as creating locks is not signal-safe.

You see in line 13 that we cannot call AsyncGetCallTrace directly, as it is not exported in any JVM header. So we have to obtain the pointer to this function via dlsym at the beginning, which is a bit brittle:

static void initASGCT() {
  asgct = reinterpret_cast<ASGCTType>(dlsym(RTLD_DEFAULT, "AsyncGetCallTrace"));
  if (asgct == NULL) {
    fprintf(stderr, "=== ASGCT not found ===\n");
    exit(1);
  }
}

Additionally, we have to copy the declarations for ASGCT_CallFrame, ASGCT_CallTrace, and AsyncGetCallTrace into our project.

After writing a signal handler, we must use some mechanism to create signals. There are multiple ways, like perf or using a thread that signals all threads every few milliseconds, but we’ll use the most straightforward option which is a timer:

static bool startITimerSampler() {
  time_t sec = interval_ns / 1000000000;
  suseconds_t usec = (interval_ns % 1000000000) / 1000;
  struct itimerval tv = {{sec, usec}, {sec, usec}};

  // ...

  if (setitimer(ITIMER_PROF, &tv, NULL) != 0) {
    return false;
  }
  return true;
}

Our code uses the timers in PROF mode: “A profiling timer that counts both processor time used by the process, and processor time spent in system calls on behalf of the process. This timer sends a SIGPROF signal to the process when it expires.” (see gnu.org) The result is roughly similar to the CPU event of the async-profiler. It is inaccurate, but we’ll tackle this problem in another blog post.

You can find the final code in the GitHub repo as libSmallProfiler.cpp. It includes all the boiler-plate code for JVMTI agents that I omitted in this blog post for brevity. Feel free to file issues or PRs with improvements or suggestions there. When we finally run the tool with a JVM and the example Java program, we get the following output via java -agentpath:cpp/libSmallProfiler.dylib=interval=0.001s -cp samples BasicSample:

Waiting forever.......................................................................................................done
Failed traces:          5
Total traces:          15
Failed ratio:       33.33%

This tool might seem to be rather useless, but one can adjust its sampling interval by specifying the interval option: This makes it quite helpful in testing the stack walking code of AsyncGetCallTrace.

I hope I didn’t frighten you too much with all this Unix C, and hopefully see you again in around two weeks for my next blog post in which we create a tool that outputs a method list.

The code of this blog post is based on the libAsyncGetCallTraceTest.cpp and the libAsyncGetStackTraceSampler.cpp of the OpenJDK. This blog series is part of my work in the SapMachine team at SAP, making profiling easier for everyone.

JFR Event Collection

Ever wondered what all the JDK Flight Recorder events are, in which JDK versions they are supported and what example of an event looks like? Wonder no more, I created the JFR Event Collection website which contains all this and more.

Screenshot of https://sapmachine.io/jfrevents

This site gives you an up-to-date collection of all OpenJDK JFR events for every JDK since 11, giving you the following additional information:

  • configuration properties
  • fields with their types and description
  • examples from a renaissance benchmark run
  • with which GC this event appears
  • additional descriptions collected by JFR users

The idea for this website came during the development of my prototypical JFR UI:

Screenshot of JFR events viewer

To improve this UI I needed to know more about the JFR events emitted by current JDKs. So I turned to the jfr/metadata.xml in the JDK source code:

...
<Event name="JavaMonitorEnter" category="Java Application" 
  label="Java Monitor Blocked" thread="true" stackTrace="true">
    <Field type="Class" name="monitorClass" label="Monitor Class" />
    <Field type="Thread" name="previousOwner" label="Previous Monitor Owner" />
    <Field type="ulong" contentType="address" name="address" 
      label="Monitor Address" relation="JavaMonitorAddress" />
</Event>
...

It specifies most events and gives you enough information in a rather concise format. But the events that are defined in the JFR source code as Java code are missing, so I turned to the website of BestSolution which shows all events:

Screenshot of https://bestsolution-at.github.io/jfr-doc/openjdk-18.html

The problem is that it is not up-to-date (it is only available up to JDK 18), its generation seems to require every JDK version to be installed, which is a major hassle for automatization, and it does not include any examples and information on configurations.

I found example data in a repository by Petr Bouda called jfr-playground, but it is patchy and not yet integrated into a website.

So when I saw a few weeks back in the foojay Slack channel that Chris Newland is working on his VM Options Explorer, I approached him with my idea for a new website. Our discussion lead to him creating his prototypical JFR Events website:

Screenshot of https://www.chriswhocodes.com/jfr_jdk20.html

His website is still an early prototype but uses the same data set as mine. This shows that this dataset can be used for different websites and might later be used for my prototypical JFR UI too.

The project behind the website consists of two subprojects the website generator and the data source with an event collector.

The data on JFR events (fields, examples, JDK versions, …) is collected by the jfreventcollector extending the jfr/metadata.xml file, so that it contains the events defined in the JDK source code and all the other information shown on the website. The extended files are published in the release section of the subproject and as a maven package with model classes for the XML elements. This is completely automated and only needs a current JDK installed.

Just add a dependency to the jfreventcollectionartifact:

<dependency>
    <groupId>me.bechberger</groupId>
    <artifactId>jfreventcollection</artifactId>
    <version>0.2</version>
</dependency>

Even the extended metadata file alone is useful:

...
<Event name="JavaMonitorEnter" label="Java Monitor Blocked"
  category="Java Application" experimental="false" thread="true"
  stackTrace="true" internal="false" throttle="false"
  cutoff="false" enabled="true" jdks="" startTime="true">
    <Field type="Class" name="monitorClass" label="Monitor Class" 
      struct="false" experimental="false" array="false" jdks=""/>
    <Field type="Thread" name="previousOwner" label="Previous Monitor Owner"
      struct="false" experimental="false" array="false" jdks=""/>
    <Field type="ulong" name="address" label="Monitor Address"
      relation="JavaMonitorAddress" contentType="address" struct="false"
      experimental="false" array="false" jdks=""/>
    <Configuration id="0" jdks="">
        <Setting name="enabled" jdks="">true</Setting>
        <Setting name="stackTrace" jdks="">true</Setting>
        <Setting name="threshold" control="locking-threshold" jdks="">20 ms</Setting>
    </Configuration>
...
</Event>
...

The website is generated by jfrevents-site-generator with depends on the data published by the collector and creates a Twitter Bootstrap based static HTML page using Kotlin and mustache templates. The generated website is then deployed to sapmachine.io.

This website is hopefully helpful to all JFR users and Java profiling tool developers out there, the extended metadata being a good starting point for similar websites and tools which need metadata on JFR events.

Issues and pull requests are always welcome in both GitHub projects.

This project is part of my work in the SapMachine team at SAP, making profiling easier for everyone. Thanks to Chris Newland, Matthias Baesken, and Ralf Schmelter for their help.