Is JDWP’s onjcmd feature worth using?

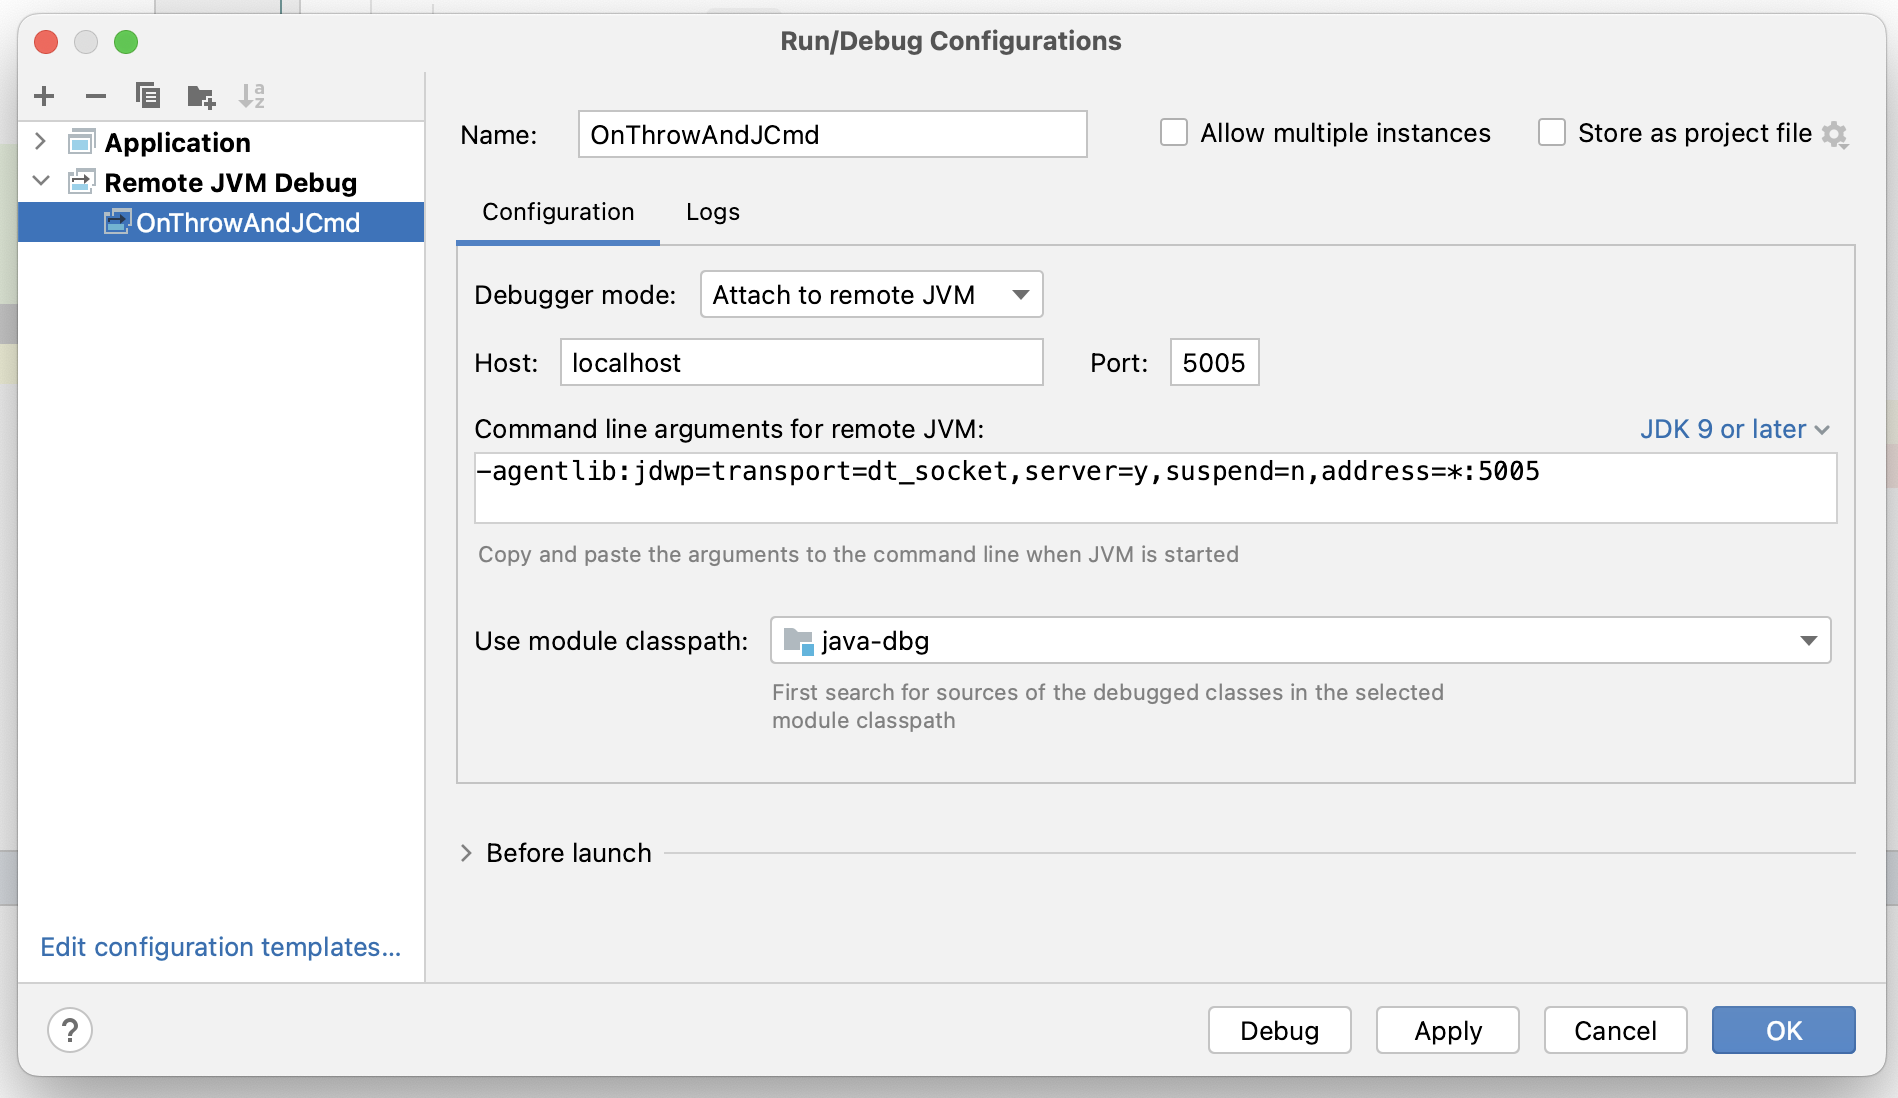
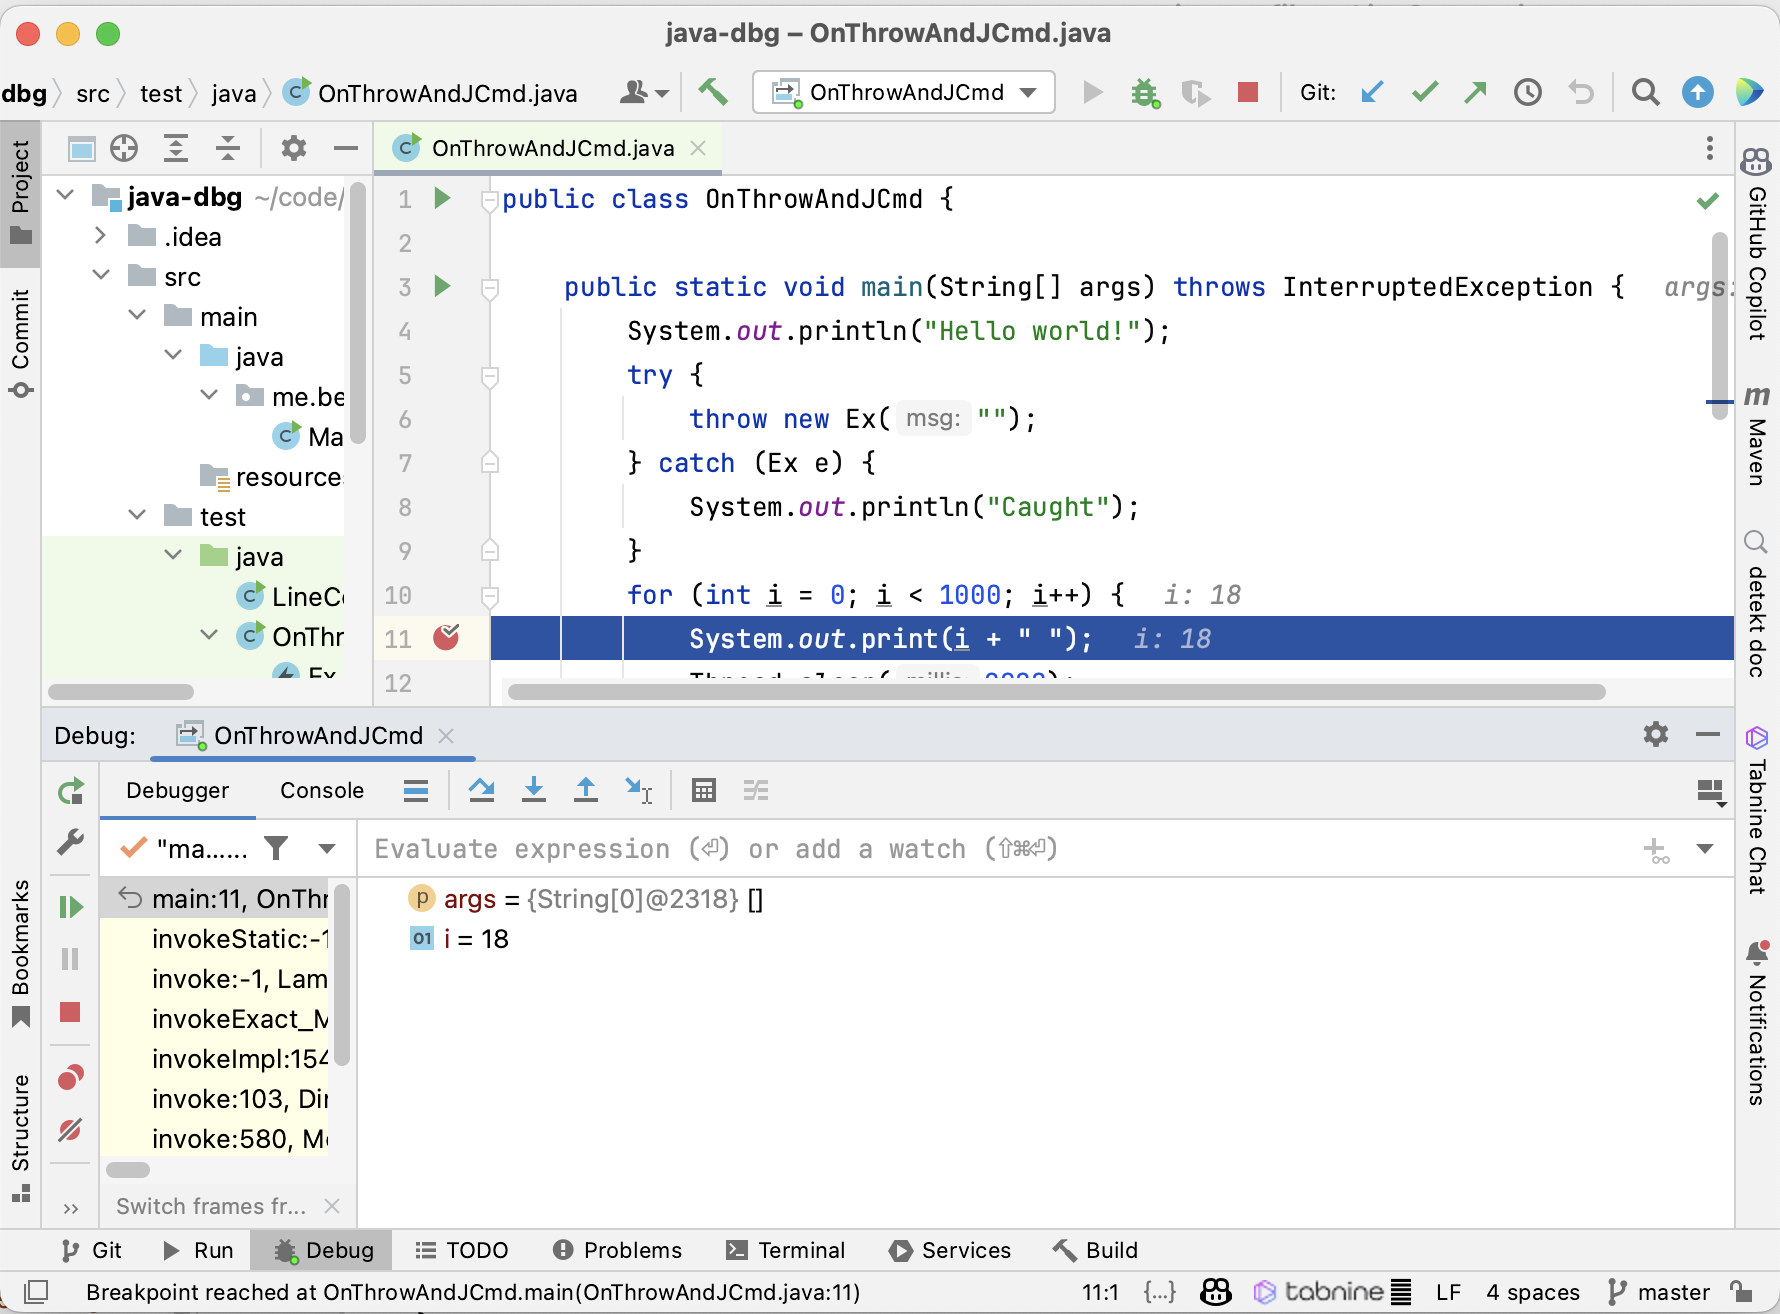
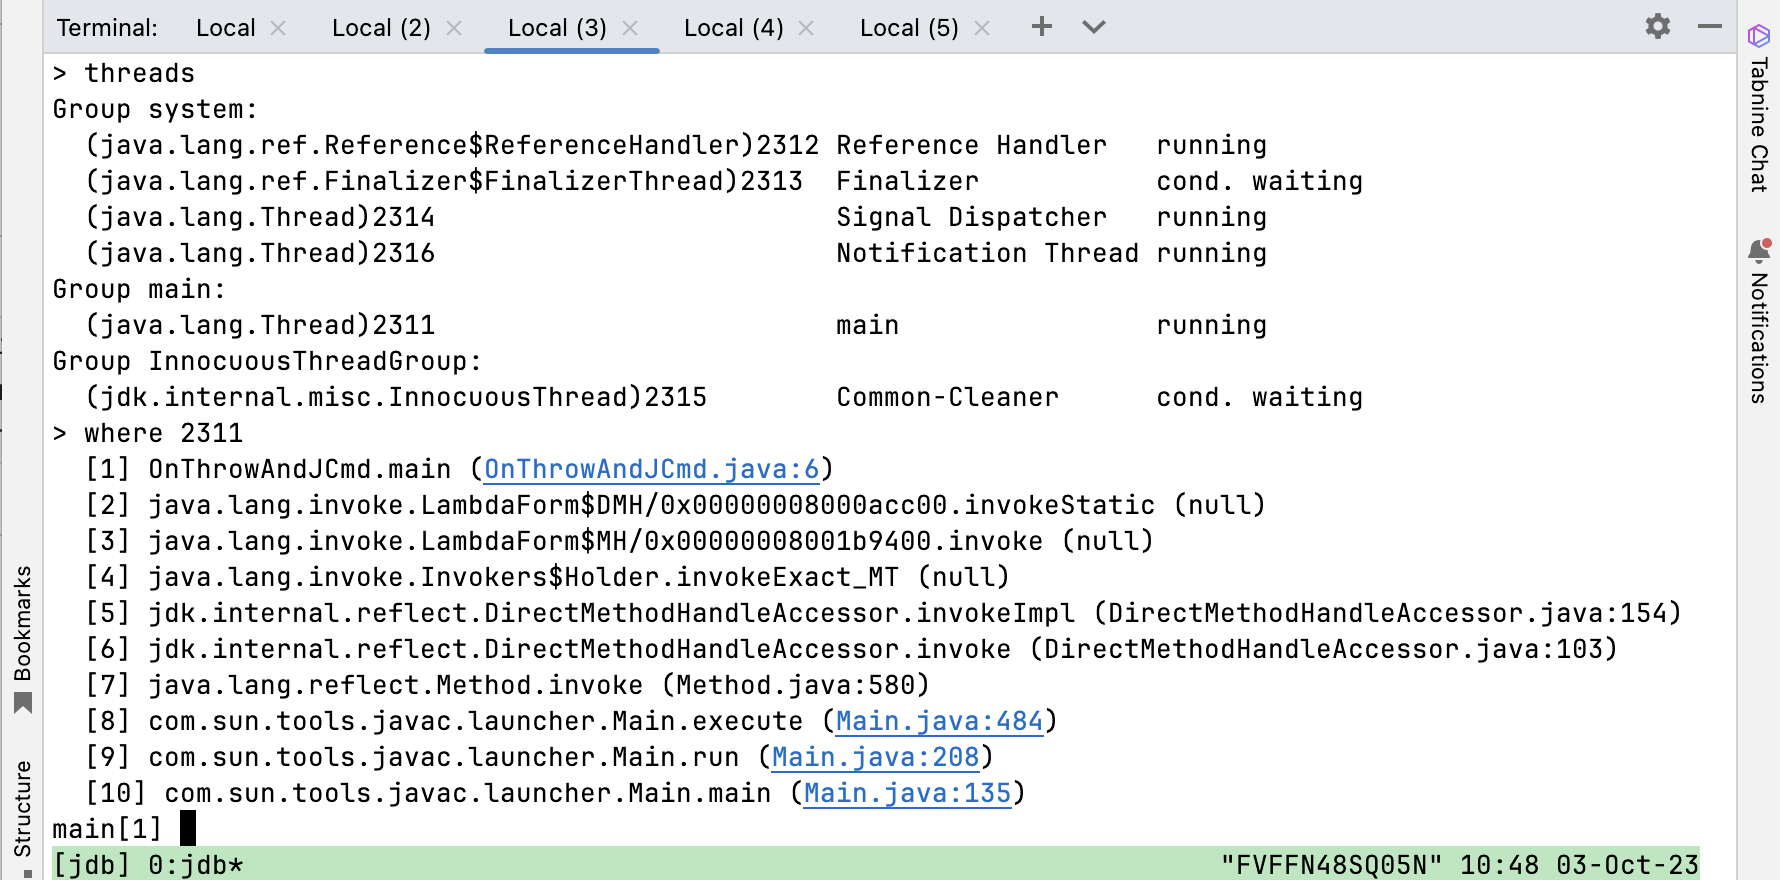
A few months ago, I told you about the onjcmd feature in my blog post Level-up your Java Debugging Skills with on-demand Debugging (which is coming to JavaLand 2024). The short version is that adding onjcmd=y to the list of JDWP options allows you to delay accepting the incoming connection request in the JDWP agent until jcmd <JVM pid> VM.start_java_debugging is called.

The main idea is that the JDWP agent

  1. only listens on the debugging port after it is triggered, which could have some security benefits
  2. and that the JDWP agent causes less overhead while waiting, compared to just accepting connections from the beginning.

The first point is debatable; one can find arguments for and against it. But for the second point, we can run some benchmarks. After renewed discussions, I started benchmarking to conclude whether the onjcmd feature improves on-demand debugging performance. Spoiler alert: It doesn’t.

Benchmarks

As for the benchmarks, I chose to run the Renaissance benchmark suite (version 0.15.0):

Renaissance is a modern, open, and diversified benchmark suite for the JVM, aimed at testing JIT compilers, garbage collectors, profilers, analyzers and other tools.

Renaissance is a benchmarking suite that contains a range of modern workloads, comprising of various popular systems, frameworks and applications made for the JVM.

Renaissance benchmarks exercise a range of programming paradigms, including concurrent, parallel, functional and object-oriented programming.

RENAISSANCE.DEV

Renaissance typically runs the sub-benchmarks in multiple iterations. Still, I decided to run the sub-benchmarks just once per Renaissance run (via -r 1) and instead run Renaissance itself ten times using hyperfine to get a proper run-time distribution. I compared three different executions of Renaissance for this blog post:

  • without JDWP: Running Renaissance without any debugging enabled, to have an appropriate baseline, via java -jar renaissance.jar all -r 1
  • with JDWP: Running Renaissance in debugging mode, with the JDWP agent accepting debugging connections the whole time without suspending the JVM, via java -agentlib:jdwp=transport=dt_socket,server=y,suspend=n,address=*:5005 -jar renaissance.jar all -r 1
  • with onjcmd: Running Renaissance in debugging mode, with the JDWP agent accepting debugging connections only after the jcmd call without suspending the JVM, via java -agentlib:jdwp=transport=dt_socket,server=y,suspend=n,onjcmd=y,address=*:5005 -jar renaissance.jar all -r 1

Remember that we never start a debugging session or use jcmd, as we’re only interested in the performance of the JVM while waiting for a debugging connection in the JDWP agent.

Yes, I know that Renaissance uses different iteration numbers for the sub-benchmarks, but this should not affect the overall conclusions from the benchmark.

Results

Now to the results. For a current JDK 21 on my Ubuntu 23.10 machine with a ThreadRipper 3995WX CPU, hyperfine obtains the following benchmarks:

Benchmark 1: without JDWP
  Time (mean ± σ):     211.075 s ±  1.307 s    [User: 4413.810 s, System: 1438.235 s]
  Range (min … max):   209.667 s … 213.361 s    10 runs

Benchmark 2: with JDWP
  Time (mean ± σ):     218.985 s ±  1.924 s    [User: 4533.024 s, System: 1133.126 s]
  Range (min … max):   216.673 s … 222.249 s    10 runs

Benchmark 3: with onjcmd
  Time (mean ± σ):     219.469 s ±  1.185 s    [User: 4537.213 s, System: 1181.856 s]
  Range (min … max):   217.824 s … 221.316 s    10 runs

Summary
  "without JDWP" ran
    1.04 ± 0.01 times faster than "with JDWP"
    1.04 ± 0.01 times faster than "with onjcmd"

You can see that the run-time difference between “with JDWP” and “with onjcmd” is 0.5s, way below the standard deviations of both benchmarks. Plotting the benchmark results using box plots visualizes this fact:

Or, more analytically, Welch’s t-test doesn’t rule out the possibility of both benchmarks producing the same run-time distribution with p=0.5. There is, therefore, no measurable effect on the performance if we use the onjcmd feature. But what we do notice is that enabling the JDWP agent results in an increase in the run-time by 4%.

The question is then: Why has it been implemented in the JDK at all? Let’s run Renaissance on JDK 11.0.3, the first release supporting onjcmd.

Results on JDK 11.0.3

Here, using onjcmd results in a significant performance improvement of a factor of 1.5 (from 354 to 248 seconds) compared to running the JDWP agent without it:

Benchmark 1: without JDWP
  Time (mean ± σ):     234.011 s ±  2.182 s    [User: 5336.885 s, System: 706.926 s]
  Range (min … max):   229.605 s … 237.845 s    10 runs
 
Benchmark 2: with JDWP
  Time (mean ± σ):     353.572 s ± 20.300 s    [User: 4680.987 s, System: 643.978 s]
  Range (min … max):   329.610 s … 402.410 s    10 runs
 
Benchmark 3: with onjcmd
  Time (mean ± σ):     247.766 s ±  1.907 s    [User: 4690.555 s, System: 609.904 s]
  Range (min … max):   245.575 s … 251.026 s    10 runs
Summary
  "without JDWP" ran
    1.06 ± 0.01 times faster than "with onjcmd"
    1.51 ± 0.09 times faster than "with JDWP"

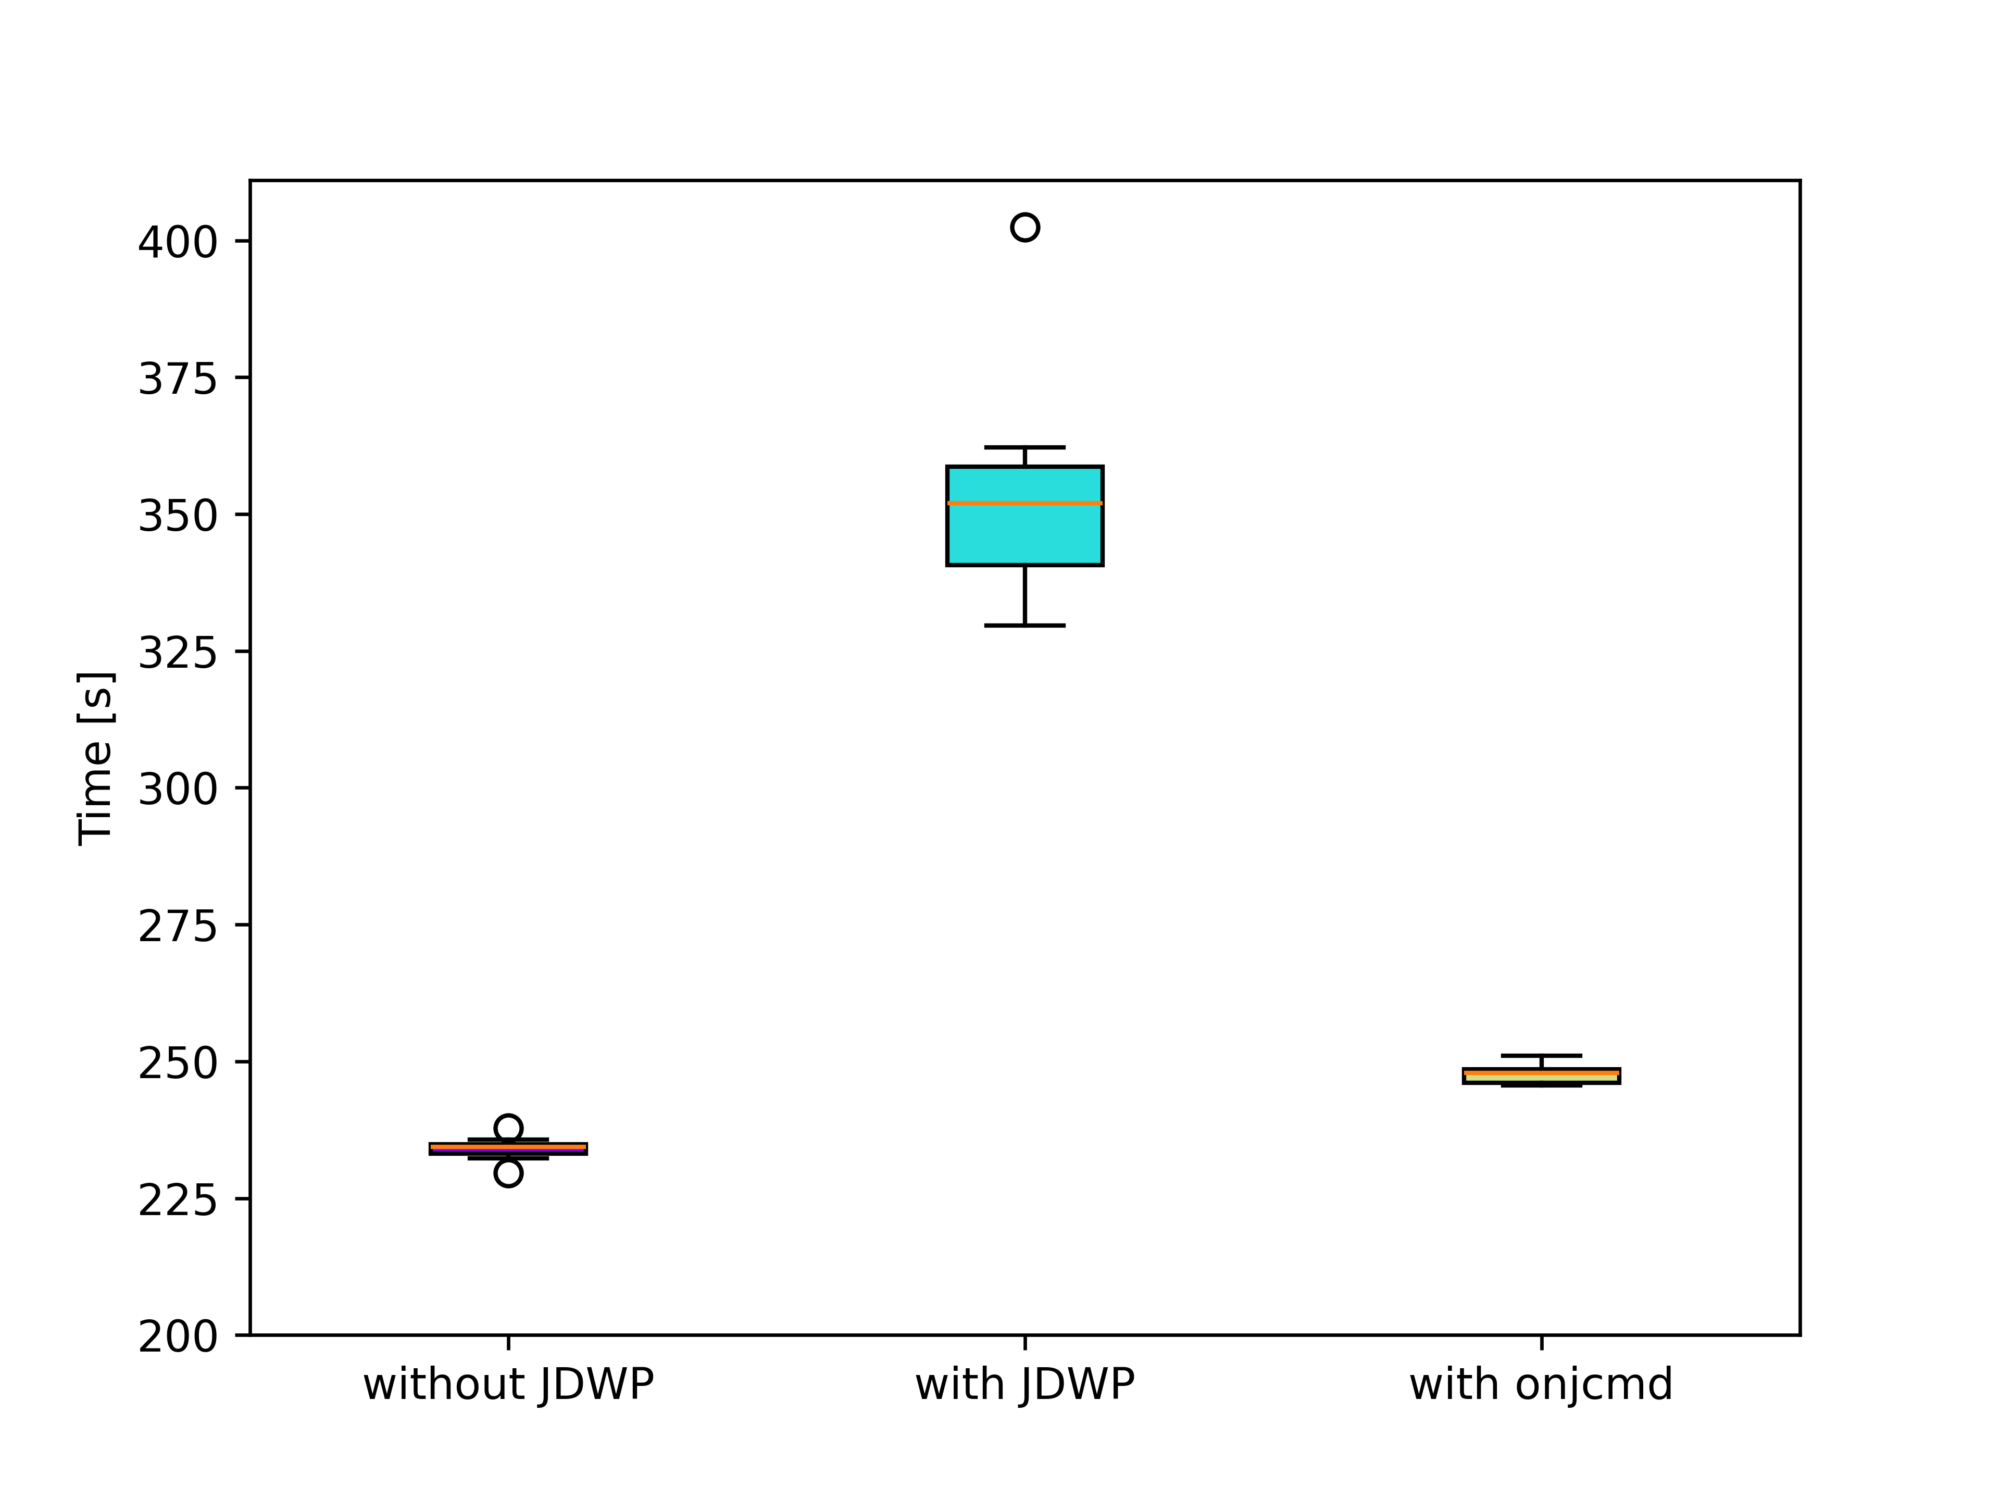
We excluded the finagle-chirper sub-benchmark here, as it causes the run-time to increase drastically. The sub-benchmark alone does not cause any problems, so the GC run possibly causes the performance hit before the sub-benchmark, which cleans up after the dotty sub-benchmark. Dotty is run directly before finagle-chirper.

Please be aware that the run sub-benchmarks on JDK 11 differ from the run on JDK 21, so don’t compare it to the results for JDK 21.

But what explains this difference?

Fixes since JDK 11.0.3

Between JDK 11.0.3 and JDK 21, there have been improvements to the OpenJDK, some of which drastically improved the performance of the JVM in debugging mode. Most notable is the fix for JDK-8227269 by Roman Kennke. The issue, reported by Egor Ushakov, reads as follows:

Slow class loading when running with JDWP

When debug mode is active (-agentlib:jdwp), an application spends a lot of time in JVM internals like Unsafe.defineAnonymousClass or Class.getDeclaredConstructors.Sometimes this happens on EDT and UI freezes occur.

If we look into the code, we’ll see that whenever a new class is loaded and an event about it is delivered, when a garbage collection has occurred, classTrack_processUnloads iterates over all loaded classes to see if any of them have been unloaded. This leads to O(classCount * gcCount) performance, which in case of frequent GCs (and they are frequent, especially the minor ones) is close to O(classCount^2). In IDEA, we have quite a lot of classes, especially counting all lambdas, so this results in quite significant overhead.

JDK-8227269

This change came into the JDK with 11.0.9. We see the 11.0.3 results with 11.0.8, but with 11.0.9, we see the results of the current JDK 11:

Benchmark 1: without JDWP
  Time (mean ± σ):     234.647 s ±  2.731 s    [User: 5331.145 s, System: 701.760 s]
  Range (min … max):   228.510 s … 238.323 s    10 runs
 
Benchmark 2: with JDWP
  Time (mean ± σ):     250.043 s ±  3.587 s    [User: 4628.578 s, System: 716.737 s]
  Range (min … max):   242.515 s … 254.456 s    10 runs
 
Benchmark 3: with onjcmd
  Time (mean ± σ):     249.689 s ±  1.765 s    [User: 4788.539 s, System: 729.207 s]
  Range (min … max):   246.324 s … 251.559 s    10 runs
 
Summary
  "without JDWP" ran
    1.06 ± 0.01 times faster than "with onjcmd"
    1.07 ± 0.02 times faster than "with JDWP"

This clearly shows the significant impact of the change. 11.0.3 came out on Apr 18, 2019, and 11.0.9 on Jul 15, 2020, so the onjcmd improved on-demand debugging for almost a year.

Want to try this out yourself? Get the binaries from SapMachine and run the benchmarks yourself. This kind of performance archaeology is quite rewarding, giving you insights into critical performance issues.

Conclusion

A few years ago, it was definitely a good idea to add the onjcmd feature to have usable on-demand debugging performance-wise. But nowadays, we can just start the JDWP agent to wait for a connection and connect to it whenever we want to, without any measurable performance penalty (in the Renaissance benchmark).

This shows us that it is always valuable to reevaluate if specific features are worth the maintenance cost. I hope this blog post gave you some insights into the performance of on-demand debugging. See you next week for the next installment in my hello-ebpf series.

This article is part of my work in the SapMachine team at SAP, making profiling and debugging easier for everyone.

Let’s create a Python Debugger together: PyData Talk

A small addendum to the previous five parts of my journey down the Python debugger rabbit hole (part 1, part 2, part 3, part 4, and part 5).

I gave a talk on this topic, based on my blog posts, at PyData Karlsruhe:

You can find all the source code of the demos here. It was a great pleasure giving this talk, and the audience received it well.

This might be the end of my journey into Python debuggers, but I feel some untold topics are out there. So, if you have any ideas, feel free to comment. See you in my next blog post and possibly at the next Python conference that accepts my talk proposal.

The presentation was part of my work in the SapMachine team at SAP, making profiling and debugging easier for everyone.

Let’s create a Python Debugger together: Tiny Addendum (exec and __name__)

A small addendum to the previous four parts of my journey down the Python debugger rabbit hole (part 1, part 2, part 3, and part 4).

I tried the debugger I finished last week on a small sample application for my upcoming talk at the PyData Südwest meet-up, and it failed. The problem is related to running the file passed to the debugger. Consider that we debug the following program:

def main():
    print("Hi")

if __name__ == "__main__":
    main()

We now set the breakpoint in the main method when starting the debugger and continuing with the execution of the program. The problem: It never hits the breakpoint. But why? Because it never calls the main method.

The cause of this problem is that the __name__ variable is set to dbg2.py (the file containing the code is compiling and running the script). But how do we run the script? We use the following (based on a Real Python article):

_globals = globals().copy()

# ...

class Dbg:
  
   # ...   
    
   def run(self, file: Path):
        """ Run a given file with the debugger """
        self._main_file = file
        # see https://realpython.com/python-exec/#using-python-for-configuration-files
        compiled = compile(file.read_text(), filename=str(file), mode='exec')
        sys.argv.pop(0)
        sys.breakpointhook = self._breakpoint
        self._process_compiled_code(compiled)
        exec(compiled, _globals)

This code uses the compile method to compile the code, telling this method that the file belongs to the program file.

The mode argument specifies what kind of code must be compiled; it can be 'exec' if source consists of a sequence of statements, 'eval' if it consists of a single expression, or 'single' if it consists of a single interactive statement (in the latter case, expression statements that evaluate to something other than None will be printed).

Python Documentation for The Mode Argument of the Compile Method

We then remove the first argument of the program because it is the debugged file in the case of the debugger and run some post-processing on the compiled code object. This is the reason why we can’t just use eval. Finally, we use exec to execute the compiled code with the global variables that we had before creating the Dbg class and others.

The problem is that exec it doesn’t set the import-related module attributes, such as __name__ and __file__ properly. So we have to emulate these by adding global variables:

        exec(compiled, _globals | 
                      {"__name__": "__main__", "__file__": str(file)})

It makes of course sense that exec behaves this way, as it is normally used to evaluate code in the current context.

With this now fixed, it is possible to debug normal applications like the line counter that I use in my upcoming talk at the 16th November in Karlsruhe.

I hope you liked this short addendum and see you next time with a blog post on something more Java-related.

Let’s create a Python Debugger together: Part 4 (Python 3.12 edition)

The fourth part of my journey down the Python debugger rabbit hole (part 1, part 2, and part 3).

In this article, we’ll be looking into how changes introduced in Python 3.12 can help us with one of the most significant pain points of our current debugger implementation: The Python interpreter essentially calls our callback at every line of code, regardless if we have a breakpoint in the currently running method. But why is this the case?

Continue reading

Let’s create a Python Debugger together: Part 3 (Refactoring)

This is the necessary third part of my journey down the Python debugger rabbit hole; if you’re new to the series, please take a look at part 1 and part 2 first.

I promised in the last part of this series that I’ll show you how to use the new Python APIs. However, some code refactoring is necessary before I can finally proceed. The implementation in dbg.py mixes the sys.settrace related code and code that can be reused for other debugging implementations. So, this is a short blog post covering the result of the refactoring. The code can be found in dbg2.py.

Continue reading

Who killed the JVM? Attaching a debugger twice

A few weeks back, I told you about on-demand debugging in my Level-up your Java Debugging Skills with on-demand Debugging blog post, enabling you to delay a debugging session till:

  • You gave orders via jcmd (onjcmd=y option), a feature contributed by the SapMachine team
  • the program threw a specific exception (onthrow=<exception>)
  • The program threw an uncaught exception (onuncaught=y)

This is quite useful because the JDWP agent has to do substantial initialization before it can start listening for the attaching debugger:

The triggering event invokes the bulk of the initialization, including creation of threads and monitors, transport setup, and installation of a new event callback which handles the complete set of events.

Comment in JDWP-agent Source Code

Other things, like class loading, were slower with an attached debugger in older JDK versions (see JDK-8227269).

But what happens after you end the debugging session? Is your debugged program aborted, and if not, can you reattach your debugger at a later point in time? The answer is as always: It depends. Or, more precisely: It depends on the remote debugger you’re using and how you terminate the debugging session.

But why should you disconnect and then reattach a debugger? It allows you to not run the debugger during longer ignorable stretches of your application’s execution. The overhead of running the JDWP agent waiting for a connection is minimal compared to the plethora of events sent from the agent to the debugger during a debugging session (like class loading events, see A short primer on Java debugging internals).

Before we cover how to (re)attach a debugger in IDEs, we’ll see how this works on the JDWP/JDI level:

On JVM Level

The JDWP agent does not prevent the debugger from reattaching. There are two ways that Debugging sessions can be closed by the debugger: dispose and exit. Disposing of a connection via the JDWP Dispose command is the least intrusive way. This command is exposed to the debugger in JDI via the VirtualMachine#dispose() method:

Invalidates this virtual machine mirror. The communication channel to the target VM is closed, and the target VM prepares to accept another subsequent connection from this debugger or another debugger, including the following tasks:

Any current method invocations executing in the target VM are continued after the disconnection. Upon completion of any such method invocation, the invoking thread continues from the location where it was originally stopped.

JDI Documentation

This essentially means that disposing of a debugging connection does not prevent the currently debugged application from continuing to run.

The other way is using the exit command, exposed as VirtualMachine#exit(int exitCode):

Causes the mirrored VM to terminate with the given error code. All resources associated with this VirtualMachine are freed. If the mirrored VM is remote, the communication channel to it will be closed.

JDI DOCUMENTATION

This, of course, prevents the debugger from reattaching.

Reattaching with IDEs

NetBeans, IntelliJ IDEA, and Eclipse all support reattaching after ending a debugging session by just creating a new remote debugging session. Be aware that this only works straightforwardly when using remote debugging, as the local debugging UI is usually directly intertwined with the UI for running the application. I would recommend trying remote debugging once in a while, even when debugging on your local machine, to be able to use all the advanced features.

Terminating an Application with IDEs

NetBeans is the only IDE of the three that does not support this (as far as I can ascertain). IntelliJ IDEA and Eclipse both support it, with Eclipse having the more straight-forward UI:

If the terminate button is not active, then you might have to tick the Allow termination of remote VM check-box in the remote configuration settings:

IntelliJ IDEA’s UI is, in this instance, arguably less discoverable: To terminate the application, you have to close the specific debugging session tab explicitly.

This then results in a popup that offers you the ability to terminate:

Conclusion

The ability to disconnect and then reattach debuggers is helpful for many complex debugging scenarios and can help you debug faster. Being able to terminate the application directly from the debugger is an additional time saver when working with remote debugging sessions. Both are often overlooked gems of Java debugging, showing once more how versatile the JDWP agent and UI debuggers are.

I hope you enjoyed this addendum to my Level-up your Java Debugging Skills with on-demand Debugging blog post. If you want even more debugging from me, come to my talk on debugging at JUG Karlsruhe on the 7th of November, to the ConFoo conference in Montreal on the 23rd of February, and hopefully, next year a conference or user group near you.

This article is part of my work in the SapMachine team at SAP, making profiling and debugging easier for everyone. It was supported by rainy weather and the subsequent afternoon in a cafe in Bratislava:

JDWP, onthrow and a mysterious error

In my previous Java-related blog post called Level-up your Java Debugging Skills with on-demand Debugging, I showed you how to use the onthrow option of the JDWP agent to start the debugging session on the first throw of a specific exception. This gave us a mysterious error in JDB:

And I asked if somebody had any ideas. No one had, but I was at Devoxx Belgium and happened to talk with Aleksey Shipilev about it at the Corretto booth:

Two OpenJDK developers having fun at Devoxx: Investigating a jdb bug with Shipilev
in the Coretto booth (Tweet)

We got a rough idea of what was happening, and now that I’m back from Devoxx, I have the time to investigate it properly. But to recap: How can you use the onthrow option and reproduce the bug?

Recap

We use a simple example program with throws and catches the exception Ex twice:

public class OnThrowAndJCmd {

    public static void main(String[] args) throws InterruptedException {
        System.out.println("Hello world!");
        try {
            throw new Ex("");
        } catch (Ex e) {
            System.out.println("Caught");
        }
        try {
            throw new Ex("");
        } catch (Ex e) {
            System.out.println("Caught");
        }
        for (int i = 0; i < 1000; i++) {
            System.out.print(i + " ");
            Thread.sleep(2000);
        }
    }
}

class Ex extends RuntimeException {
    public Ex(String msg) {
        super(msg);
    }
}

We then use one terminal to run the program with the JDWP agent attached and the other to run JDB:

java "-agentlib:jdwp=transport=dt_socket,server=y,suspend=y,address=*:5005,onthrow=Ex,launch=exit" src/test/java/OnThrowAndJCmd.java

# in another terminal
jdb -attach 5005

Then JDB prints us the expected error trace:

Exception in thread "event-handler" java.lang.NullPointerException: Cannot invoke "com.sun.jdi.ObjectReference.referenceType()" because the return value of "com.sun.jdi.event.ExceptionEvent.exception()" is null
        at jdk.jdi/com.sun.tools.example.debug.tty.TTY.exceptionEvent(TTY.java:171)
        at jdk.jdi/com.sun.tools.example.debug.tty.EventHandler.exceptionEvent(EventHandler.java:295)
        at jdk.jdi/com.sun.tools.example.debug.tty.EventHandler.handleEvent(EventHandler.java:133)
        at jdk.jdi/com.sun.tools.example.debug.tty.EventHandler.run(EventHandler.java:78)
        at java.base/java.lang.Thread.run(Thread.java:1583)

This might be, and I’m foreshadowing, the reason why IDEs like IntelliJ IDEA don’t support attaching to a JDWP agent with onthrow enabled.

Remember that this issue might be fixed with your current JDK; the bug is reproducible with a JDK build older than the 10th of October.

Update: This bug does not appear in JDK 1.4, but in JDK 1.5 and ever since.

Looking for the culprit

In our preliminary investigation, Aleksey and I realized that JDB was probably not to blame. The problem is that the JDWP-agent sends an exception event after JDB is attached, related to the thrown Ex exception, but this event does not adhere to the specification. The JDWP specification tells us that every exception event contains the following:

TypeNameDescription
intrequestIDRequest that generated event 
threadIDthreadThread with exception
locationlocationLocation of exception throw (or first non-native location after throw if thrown from a native method) 
tagged-objectIDexceptionThrown exception 
locationcatchLocationLocation of catch, or 0 if not caught. An exception is considered to be caught if, at the point of the throw, the current location is dynamically enclosed in a try statement that handles the exception. […]

So clearly, none of the properties should be null in our case. Exception events are written in the writeExceptionEvent method of the JDWP agent. We can modify this method to print all accessed exception fields and check that the problem really is related to the agent. For good measure, we also tell JDB to get notified of all other triggered Ex exceptions (> catch Ex), so we can obtain the printed information for the initial and the second exception:

Exception event: 
    thread: 0x0
    clazz: 0x0
    method: 0x0
    location: 0
    object: 0x0
    catch_clazz: 0x0
    catch_method: 0x0
    catch_location: 0
Caught
Exception event: 
    thread: 0x12b50fb02
    clazz: 0x12b50fb0a
    method: 0x12b188290
    location: 36
    object: 0x12b50fb12
    catch_clazz: 0x12b50fb1a
    catch_method: 0x12b188290
    catch_location: 37

This clearly shows that the exception that started the debugging session was not sent correctly.

How does onthrow work?

When the JDWP agent starts, it registers a JVMTI Exception event callback called cbEarlyException via SetEventCallBacks:

void JNICALL Exception(
  jvmtiEnv *jvmti_env,
  JNIEnv* jni_env, 
  jthread thread,
  jmethodID method, 
  jlocation location, 
  jobject exception, 
  jmethodID catch_method, 
  jlocation catch_location)

Exception events are generated whenever an exception is first detected in a Java programming language method.

JVMTI Documentation

On every exception, this handler checks if the exception has the name passed to the onthrow option. If the exception matches, then the agent initializes the debugging session:

The only problem here is that cbEarlyException is passed all the exception information but doesn’t pass it to the initialize method. This causes the JDWP-agent to send out an Exception event with all fields being null, as you saw in the previous section.

Fixing the bug

Now that we know exactly what went wrong, we can create an issue in the official JDK Bug System (JDK-8317920). Then, we can fix it by creating the event in the cbEarlyException handler itself and passing it to the new opt_info parameter of the initialize method (see GitHub):

static void JNICALL
cbEarlyException(jvmtiEnv *jvmti_env, JNIEnv *env,
        jthread thread, jmethodID method, jlocation location,
        jobject exception,
        jmethodID catch_method, jlocation catch_location)
{
    // ...
    EventInfo info;
    info.ei = EI_EXCEPTION;
    info.thread = thread;
    info.clazz = JNI_FUNC_PTR(env,GetObjectClass)(env, exception);
    info.method = method;
    info.location = location;
    info.object = exception;
    if (gdata->vthreadsSupported) {
        info.is_vthread = isVThread(thread);
    }
    info.u.exception.catch_clazz = getMethodClass(jvmti_env, catch_method);
    info.u.exception.catch_method = catch_method;
    info.u.exception.catch_location = catch_location;
    // ... // check if exception matches
    initialize(env, thread, EI_EXCEPTION, &info);
    // ...
}

The related Pull Request on GitHub is #16145. It will hopefully be merged soon. The last time someone reported and fixed an issue related to the onthrow option was in early 2002, so it is the first change in more than 20 years. The issue was about onthrow requiring the launch option to be present.

It works (even with your IDE)

With this fix in place, it works. JDB even selects the main thread as the current thread:

➜ jdb -attach 5005
Set uncaught java.lang.Throwable
Set deferred uncaught java.lang.Throwable
Initializing jdb ...
> 
Exception occurred: Ex (to be caught at: OnThrowAndJCmd.main(), line=7 bci=18)"thread=main", OnThrowAndJCmd.main(), line=6 bci=17

main[1]

But does fixing this issue also mean that IDEs like IntelliJ IDEA now support attaching to agents with onthrow enabled? Yes, at least if we set a breakpoint somewhere after the first exception has been thrown (like with the onjcmd option):

Conclusion

Collaborating with other people from different companies in an Open-Source project is great. Aleksey found the bug interesting enough to spend half an hour looking into it with me, which persuaded me to look into it again after returning from Devoxx. Fixing these bugs allows users to fully use on-demand debugging, speeding up their error-finding sessions.

I hope you liked this walk down the rabbit hole. See you next week with another article on debugging or my trip to Devoxx trip (or both). Feel free to ask any questions or to suggest new article ideas.

I’ll be giving a few talks on debugging this autumn; you can find specifics on my Talks page. I’m happy to speak on your meet-up or user group; just let me know.

This article is part of my work in the SapMachine team at SAP, making profiling and debugging easier for everyone.

Let’s create a Python Debugger together: Part 2

The second part of my journey down the Python debugger rabbit hole.

In this blog post, we extend and fix the debugger we created in part 1: We add the capability to

  • single step over code, stepping over lines, into function calls, and out of functions,
  • and adding conditions to breakpoints.

You can find the resulting MIT-licensed code on GitHub in the python-dbg repository in the file dbg.py. I added a README so you can glance at how to use it.

Continue reading

Level-up your Java Debugging Skills with on-demand Debugging

Debugging is one of the most common tasks in software development, so one would assume that all features of debuggers have ample coverage in tutorials and guides. Yet there are three hidden gems of the Java Debugging (JDWP) agent that allow you to delay the start of the debugging session till

  • you gave orders via jcmd (onjcmd=y option)
  • the program threw a specific exception (onthrow=<exception>)
  • the program threw an uncaught exception (onuncaught=y)

Before I tell you more about the specific options, I want to start with the basics of how to apply them:

Option Application

When you debug remotely in your IDE (IntelliJ IDEA in my case), the “Debug Configurations” dialog tells you which options you should pass to your remote JVM:

Just append more options by adding them to the -agentlib option, or by setting the _JAVA_JDWP_OPTIONS environment variable, which is comma-appended to the options.

All options only work correctly in the server mode (server=y) of the JDWP agent (suspend=y or suspend=n seem to exhibit the same behavior with onjcmd).

I’m now showing you how the three hidden gems work:

JCmd triggered debugging

There are often cases where the code that you want to debug is executed later in your program’s run or after a specific issue appears. So don’t waste time running the debugging session from the start of your program, but use the onjcmd=y option to tell the JDWP agent to wait with the debugging session till it is triggered via jcmd:

 ➜ java "-agentlib:jdwp=transport=dt_socket,server=y,suspend=y,address=*:5005,onjcmd=y" src/test/java/OnThrowAndJCmd.java &
 ➜ echo $! # get pid
 # wait some time and then start debugging on demand
 ➜ jcmd $! VM.start_java_debugging
jcmd 97145 VM.start_java_debugging
97145:
Debugging has been started.
Transport : dt_socket
Address : *:5005

jps is your friend if you want to find the process id of an already running JVM.

I created a sample class in my java-dbg repository on GitHub with a small sample program for this article. To use JCmd triggered with our IDE, we first have to create a remote debug configuration (see previous section); we can then start the sample program in the shell and trigger the start of the debugging session. Then, we start the remote debug configuration in the IDE and debug our program:

A similar feature long existed in the SAPJVM. In 2019 Christoph Langer from SAP decided to add it to the OpenJDK, where it was implemented in JDK 12 and has been there ever since. It is one of the many significant contributions of the SapMachine team.

Disclaimer: I’m part of this magnificent team, albeit not in 2019.

Exception triggered debugging

Far older than jcmd triggered are exception-triggered debugging sessions. There are two types:

  1. The throwing of a specific exception (byte-code or normal name, inner classes with $) can start the debugging session by using onthrow=<exception>. This is especially nice if you want to debug the cause of this specific exception. This feature can easily be used in combination with your favorite IDE.
  2. The existence of an uncaught exception can trigger the start of a debugging session by using onuncaught=y. The debugging context is your outermost main method, but it’s still helpful if you want to inspect the exception or the state of your application. A problem is that you cannot use the debuggers from IntelliJ IDEA or NetBeans to explore the context; you have to use the command line debugger jdb instead.

Due to historical reasons, you also have to supply a command that is executed when the debugging session starts via the launch option, but setting it to exit works just fine.

Using both trigger types is similar to the JCmd triggered debugging:

 ➜ java "-agentlib:jdwp=transport=dt_socket,server=y,suspend=y,address=*:5005,onthrow=Ex,launch=exit" src/test/java/OnThrowAndJCmd.java
# or
 ➜ java "-agentlib:jdwp=transport=dt_socket,server=y,suspend=y,address=*:5005,onuncaught=y,launch=exit" src/test/java/OnThrowAndJCmd.java

If you’re okay with using jdb, you can also use the launch option to call a script that starts jdb in a new tmux session, in our case, tmux_jdb.sh:

#!/bin/sh
tmux new-session -d -s jdb -- jdb -attach $2

We run our application using the JDWP agent with the onthrow=Ex,launch=sh tmux_jdb.sh option to start the jdb the first time the Ex exception is thrown and attach to the tmux session:

➜ java "-agentlib:jdwp=transport=dt_socket,server=y,suspend=y,address=*:5005,onthrow=Ex,launch=sh tmux_jdb.sh" src/test/java/OnThrowAndJCmd.java
# in another console after the exception is thrown
➜ tmux attach -t jdb

Where we can explore the current state of the application:

Debugging a specific exception has never been easier.

jdb and the JDWP on* options aren’t as widely used as graphical debuggers, so you might still find some bugs. I don’t know whether the stack trace in the second-to-last screenshot is a bug. Feel free to comment if you know the answer.

How to discover these features

You can either be like me and just drop into the JDK source and look into the debugInit.c file, the official documentation, or you use help option, which prints the following with JDK 21:

➜ java "-agentlib:jdwp=help"
               Java Debugger JDWP Agent Library
               --------------------------------

  (See the "VM Invocation Options" section of the JPDA
   "Connection and Invocation Details" document for more information.)

jdwp usage: java -agentlib:jdwp=[help]|[<option>=<value>, ...]

Option Name and Value            Description                       Default
---------------------            -----------                       -------
suspend=y|n                      wait on startup?                  y
transport=<name>                 transport spec                    none
address=<listen/attach address>  transport spec                    ""
server=y|n                       listen for debugger?              n
launch=<command line>            run debugger on event             none
onthrow=<exception name>         debug on throw                    none
onuncaught=y|n                   debug on any uncaught?            n
onjcmd=y|n                       start debug via jcmd?             n
timeout=<timeout value>          for listen/attach in milliseconds n
includevirtualthreads=y|n        List of all threads includes virtual threads as well as platform threads.
                                                                   n
mutf8=y|n                        output modified utf-8             n
quiet=y|n                        control over terminal messages    n

Obsolete Options
----------------
strict=y|n
stdalloc=y|n

Examples
--------
  - Using sockets connect to a debugger at a specific address:
    java -agentlib:jdwp=transport=dt_socket,address=localhost:8000 ...
  - Using sockets listen for a debugger to attach:
    java -agentlib:jdwp=transport=dt_socket,server=y,suspend=y ...

Notes
-----
  - A timeout value of 0 (the default) is no timeout.

Warnings
--------
  - The older -Xrunjdwp interface can still be used, but will be removed in
    a future release, for example:
        java -Xrunjdwp:[help]|[<option>=<value>, ...]

Of course, this only gives you a glance at the options, so reading the source code still revealed much of what I had before.

Conclusion

Hidden gems are everywhere in the Java ecosystem, even in widely used tools like debugging agents. Especially onthrow and onjcmd can improve the performance of on-demand debugging, as this allows us to trigger the start of the debugging session from outside the debugger.

I hope you can apply your newly gained knowledge the next time you have a complex problem to debug. Still curious about debugging? Come back next week for another blog post.

This article is part of my work in the SapMachine team at SAP, making profiling and debugging easier for everyone. Thanks to Thomas Darimont, with whom I discovered the hidden features while preparing for my talks on Java Debugging. I wrote this article on the train to Devoxx Belgium.

A short primer on Java debugging internals

I wanted to write about a small side project this week: A few months back, I got carried away with understanding how Java debugging works. The following is an hors d’oeuvre, a small post in between my series on profiling, on the Java Platform Debugging Architecture.

All Java debuggers use the Java Debug Wire Protocol (JDWP) to communicate with the JVM, usually using the Java Debug Interface (JDI) abstraction Layer. The protocol can be used to remote debug, but the JVM and the debugger are commonly on the same machine. Therefore, the design did not take latency into account, and it requires sending many small messages, but this is a topic for another blog post. The actual architecture of debuggers differs slightly:

The architecture of the IntelliJ and the VSCode Java debuggers

The IntelliJ debugger calls the JDI interface directly. The VSCode debugger, in contrast, uses its own protocol called Debug Adapter Protocol, which is for debugging what the Language Server Protocol is for code editing, to quote the DAP page:

The idea behind the Debug Adapter Protocol (DAP) is to abstract the way how the debugging support of development tools communicates with debuggers or runtimes into a protocol. Since it is unrealistic to assume that existing debuggers or runtimes adopt this protocol any time soon, we rather assume that an intermediary component – a so called Debug Adapter – adapts an existing debugger or runtime to the Debug Adapter Protocol.

Debug Adapter Protocol

But the JVM does not implement this protocol (although it would certainly have its benefits, so if you’re looking for a project during the winter holidays…), so VSCode communicates with a so-called Java Debug Server, which is based on the Eclipse debugger, which translates between DAP and JDWP.

Back to the JDWP protocol: JDWP knows four different types of packets.

  • Handshake: The string JDWP-Handshake is sent from the Debugger (client) to the JDWP Agent/JVM (Server) and back. This initiates the debugging session.
  • Request: A request from the client to the server, like SetBreakpoint
  • Reply: The response to the request
  • Event: A collection of events of the same kind that happened in the JVM, like ClassPrepare, sent from the JVM to the Debugger to notify it of something, like the preparation of a specific class.

I wrote a small logger which intercepts the JDWP requests, replies, and events, synthesizing them into JDWP programs in a small language. These programs may start with a cause, which probably started the sequence of requests. This allows us to understand better how the debugger interacts with the JVM. For the purpose of this blog post, we only consider a small hello world program:

We put a break-point on line 4 using the IntelliJ debugger and run this debugging session with my logger. I’ll go into all the sent and received packets in this post, but just to give you the gist of the communication, here is the simplified sequence diagram:

The debugging session starts with the JVM informing the debugger of the start and the debugger then requesting the sizes of the different IDs used in this session (e.g., that a method ID is 8 bytes wide, …):

((= cause (events Event Composite ("suspendPolicy")=(wrap "byte" 2) ("events" 0 "kind")=(wrap "string" "VMStart") ("events" 0 "requestID")=(wrap "int" 0) ("events" 0 "thread")=(wrap "thread" 1)))
  (= var0 (request VirtualMachine IDSizes)))

// the reply to the IDSizes request is
IDSizesReply(fieldIDSize=IntValue(8), methodIDSize=IntValue(8), objectIDSize=IntValue(8), referenceTypeIDSize=IntValue(8), frameIDSize=IntValue(8))

Typically one starts the debugging session with suspend=y, so that the JVM stops its execution till the debugger is ready. The debugger starts by requesting to get events for every class preparation and thread starts, some information on the debugging capabilities of the JVM and information on the loaded classes, the sun.instrument.InstrumentationImpl class in particular:

((= cause (request EventRequest Set ("eventKind")=(wrap "byte" 8) ("suspendPolicy")=(wrap "byte" 0)))
  (= var0 (request EventRequest Set ("eventKind")=(wrap "byte" 8) ("suspendPolicy")=(wrap "byte" 0)))
  (= var1 (request VirtualMachine Version))
  (= var2 (request VirtualMachine Capabilities))
  (= var3 (request VirtualMachine CapabilitiesNew))
  (= var4 (request VirtualMachine AllClassesWithGeneric)))
((= cause (request VirtualMachine TopLevelThreadGroups))
  (= var0 (request VirtualMachine TopLevelThreadGroups)))
((= cause (request EventRequest Set ("eventKind")=(wrap "byte" 6) ("suspendPolicy")=(wrap "byte" 0)))
  (= var0 (request EventRequest Set ("eventKind")=(wrap "byte" 6) ("suspendPolicy")=(wrap "byte" 0)))
  (= var1 (request ReferenceType SourceDebugExtension ("refType")=(wrap "klass" 456)))
  (= var2 (request ReferenceType MethodsWithGeneric ("refType")=(wrap "klass" 456)))
  (for iter0 (get var2 "declared") 
    (= var3 (request Method LineTable ("methodID")=(get iter0 "methodID") ("refType")=(wrap "klass" 456)))))

InstrumentationImpl implements the Instrumentation interface:

This class provides services needed to instrument Java programming language code. Instrumentation is the addition of byte-codes to methods for the purpose of gathering data to be utilized by tools. Since the changes are purely additive, these tools do not modify application state or behavior. Examples of such benign tools include monitoring agents, profilers, coverage analyzers, and event loggers.

https://docs.oracle.com/

The debugger uses the AllClassesWithGeneric request (line 6) to obtain a mapping of class names to class IDs (line 8) which the debugger then used to get the class ID of the InstrumentationImpl and obtain information on this class. This is a typical pattern for JDI when the debugger requests any information on a class.

The JVM then sends two ThreadStart events for the main and the JVM internal notification thread:

((= cause (events Event Composite ("suspendPolicy")=(wrap "byte" 0) ("events" 0 "kind")=(wrap "string" "ThreadStart") ("events" 0 "requestID")=(wrap "int" 4) ("events" 0 "thread")=(wrap "thread" 1097)))
)
((= cause (events Event Composite ("suspendPolicy")=(wrap "byte" 0) ("events" 0 "kind")=(wrap "string" "ThreadStart") ("events" 0 "requestID")=(wrap "int" 4) ("events" 0 "thread")=(wrap "thread" 1)))
)

The notification thread is:

[...] new NotificationThread that is visible to the external view and offloads the ServiceThread from sending low memory and other notifications that could result in Java calls ( GC and diagnostic commands notifications) by moving these activities in this new NotificationThread.
https://mail.openjdk.org/pipermail/jmx-dev/2019-August/001061.html

The JVM also sends the ClassPrepare event for the URLCLassPath.FileLoader class:

((= cause (events Event Composite ("suspendPolicy")=(wrap "byte" 0) ("events" 0 "kind")=(wrap "string" "ClassPrepare") ("events" 0 "refTypeTag")=(wrap "byte" 1) ("events" 0 "requestID")=(wrap "int" 2) ("events" 0 "signature")=(wrap "string" "Ljdk/internal/loader/URLClassPath$FileLoader$1;") ("events" 0 "status")=(wrap "int" 7) ("events" 0 "thread")=(wrap "thread" 1) ("events" 0 "typeID")=(wrap "klass" 1099)))
)

Which is a “Nested class used to represent a loader of classes and resources from a file URL that refers to a directory.” used internally during the loading of classes from files.

But then, finally, the JVM loaded the SmallProgram class and sends a ClassPrepare event. This causes the debugger to obtain information on the class:

((= cause (events Event Composite ("suspendPolicy")=(wrap "byte" 1) ("events" 0 "kind")=(wrap "string" "ClassPrepare") ("events" 0 "refTypeTag")=(wrap "byte" 1) ("events" 0 "requestID")=(wrap "int" 34) ("events" 0 "signature")=(wrap "string" "LSmallProgram;") ("events" 0 "status")=(wrap "int" 3) ("events" 0 "thread")=(wrap "thread" 1) ("events" 0 "typeID")=(wrap "klass" 1100) ("events" 1 "kind")=(wrap "string" "ClassPrepare") ("events" 1 "refTypeTag")=(wrap "byte" 1) ("events" 1 "requestID")=(wrap "int" 2) ("events" 1 "signature")=(wrap "string" "LSmallProgram;") ("events" 1 "status")=(wrap "int" 3) ("events" 1 "thread")=(wrap "thread" 1) ("events" 1 "typeID")=(wrap "klass" 1100)))
  (= var0 (request ReferenceType SourceFile ("refType")=(get cause "events" 0 "typeID")))
  (= var1 (request ReferenceType SourceDebugExtension ("refType")=(get cause "events" 0 "typeID")))
  (= var2 (request ReferenceType MethodsWithGeneric ("refType")=(get cause "events" 0 "typeID")))
  (for iter0 (get var2 "declared") 
    (= var3 (request Method LineTable ("methodID")=(get iter0 "methodID") ("refType")=(get cause "events" 0 "typeID")))))

The debugger then sets the break-point using the mappings obtained before…

((= cause (request EventRequest Set ("eventKind")=(wrap "byte" 2) ("suspendPolicy")=(wrap "byte" 2) ("modifiers" 0 "kind")=(wrap "string" "LocationOnly") ("modifiers" 0 "loc" "codeIndex")=(wrap "long" 4) ("modifiers" 0 "loc" "declaringType")=(wrap "class-type" 1100) ("modifiers" 0 "loc" "methodRef")=(wrap "method" 105553134992648)))
  (= var0 (request EventRequest Set ("eventKind")=(wrap "byte" 2) ("suspendPolicy")=(wrap "byte" 2) ("modifiers" 0 "kind")=(wrap "string" "LocationOnly") ("modifiers" 0 "loc" "codeIndex")=(wrap "long" 4) ("modifiers" 0 "loc" "declaringType")=(wrap "class-type" 1100) ("modifiers" 0 "loc" "methodRef")=(wrap "method" 105553134992648))))

… and requests the resuming of the program execution. The JVM then hits the break-point and requests lots of information: Information on the transitive superclasses, the current thread, the current stack trace, and every local variable in the currently executed method:

((= cause (events Event Composite ("suspendPolicy")=(wrap "byte" 2) ("events" 0 "kind")=(wrap "string" "Breakpoint") ("events" 0 "requestID")=(wrap "int" 35) ("events" 0 "thread")=(wrap "thread" 1) ("events" 0 "location" "codeIndex")=(wrap "long" 4) ("events" 0 "location" "declaringType")=(wrap "class-type" 1100) ("events" 0 "location" "methodRef")=(wrap "method" 105553134992648)))
  (rec recursion0 1000 var3 (request ClassType Superclass ("clazz")=(get cause "events" 0 "location" "declaringType"))
    (reccall var6 recursion0 ("clazz")=(get var3 "superclass"))
    (= var4 (request ReferenceType Interfaces ("refType")=(get var3 "superclass")))
    (= var5 (request ReferenceType FieldsWithGeneric ("refType")=(get var3 "superclass"))))
  (= var0 (request ReferenceType Interfaces ("refType")=(get cause "events" 0 "location" "declaringType")))
  (= var1 (request ReferenceType FieldsWithGeneric ("refType")=(get cause "events" 0 "location" "declaringType")))
  (= var2 (request ReferenceType ConstantPool ("refType")=(get cause "events" 0 "location" "declaringType")))
  (= var5 (request ThreadReference Name ("thread")=(get cause "events" 0 "thread")))
  (= var6 (request ThreadReference Status ("thread")=(get cause "events" 0 "thread")))
  (= var7 (request ThreadReference ThreadGroup ("thread")=(get cause "events" 0 "thread")))
  (= var8 (request ThreadReference FrameCount ("thread")=(get cause "events" 0 "thread")))
  (= var9 (request ThreadReference Frames ("length")=(get var8 "frameCount") ("startFrame")=(wrap "int" 0) ("thread")=(get cause "events" 0 "thread")))
  (= var10 (request ThreadGroupReference Name ("group")=(get var7 "group")))
  (= var11 (request Method Bytecodes ("methodID")=(get cause "events" 0 "location" "methodRef") ("refType")=(get var9 "frames" 0 "location" "declaringType")))
  (= var12 (request Method IsObsolete ("methodID")=(get cause "events" 0 "location" "methodRef") ("refType")=(get var9 "frames" 0 "location" "declaringType")))
  (= var13 (request Method VariableTableWithGeneric ("methodID")=(get cause "events" 0 "location" "methodRef") ("refType")=(get var9 "frames" 0 "location" "declaringType")))
  (= var15 (request StackFrame GetValues ("frame")=(get var9 "frames" 0 "frameID") ("thread")=(get cause "events" 0 "thread") ("slots" 0 "sigbyte")=(wrap "byte" 91) ("slots" 0 "slot")=(wrap "int" 0)))
  (= var14 (request StackFrame GetValues ("frame")=(get var9 "frames" 0 "frameID") ("thread")=(get cause "events" 0 "thread") ("slots" 0 "sigbyte")=(getTagForValue (get var9 "frames" 0 "frameID")) ("slots" 0 "slot")=(wrap "int" 1)))
  (= var16 (request ObjectReference ReferenceType ("object")=(get var14 "values" 0)))
  (= var17 (request ObjectReference ReferenceType ("object")=(get var15 "values" 0)))
  (= var18 (request ArrayReference Length ("arrayObject")=(get var15 "values" 0)))
  (= var19 (request ReferenceType SourceFile ("refType")=(get var16 "typeID")))
  (= var21 (request ReferenceType Interfaces ("refType")=(get var16 "typeID")))
  (= var22 (request ReferenceType SourceDebugExtension ("refType")=(get var16 "typeID")))
  (= var23 (request ClassType Superclass ("clazz")=(get var16 "typeID")))
  (= var24 (request ArrayReference GetValues ("arrayObject")=(get var15 "values" 0) ("firstIndex")=(wrap "int" 0) ("length")=(get var18 "arrayLength")))
  (for iter1 (get var21 "interfaces") 
    (= var22 (request ReferenceType Interfaces ("refType")=iter1)))
  (= var25 (request StringReference Value ("stringObject")=(get var24 "values" 0))))

This allows the debugger to show us the following:

We then press the “Resume Program” button in the IDE. This causes the debugger to send a resume request. This is the last significant communication between the debugger and JVM that we see in our logs, there should at least be a VM death event, but our Java agent-based logger cannot record this.

You can find the transcript of the communication on GitHub. The logger tool is not yet public, but I hope to publish it in the next year. Although it still contains bugs, it is only usable for understanding JDWP and as a basis for other tools.

Thanks for reading this article till here. My next post will be part of the “Writing a profiler from scratch” series again.

This blog post is part of my work in the SapMachine team at SAP, making profiling easier for everyone.