A few weeks back, I told you about on-demand debugging in my Level-up your Java Debugging Skills with on-demand Debugging blog post, enabling you to delay a debugging session till:
- You gave orders via
jcmd(onjcmd=yoption), a feature contributed by the SapMachine team - the program threw a specific exception (
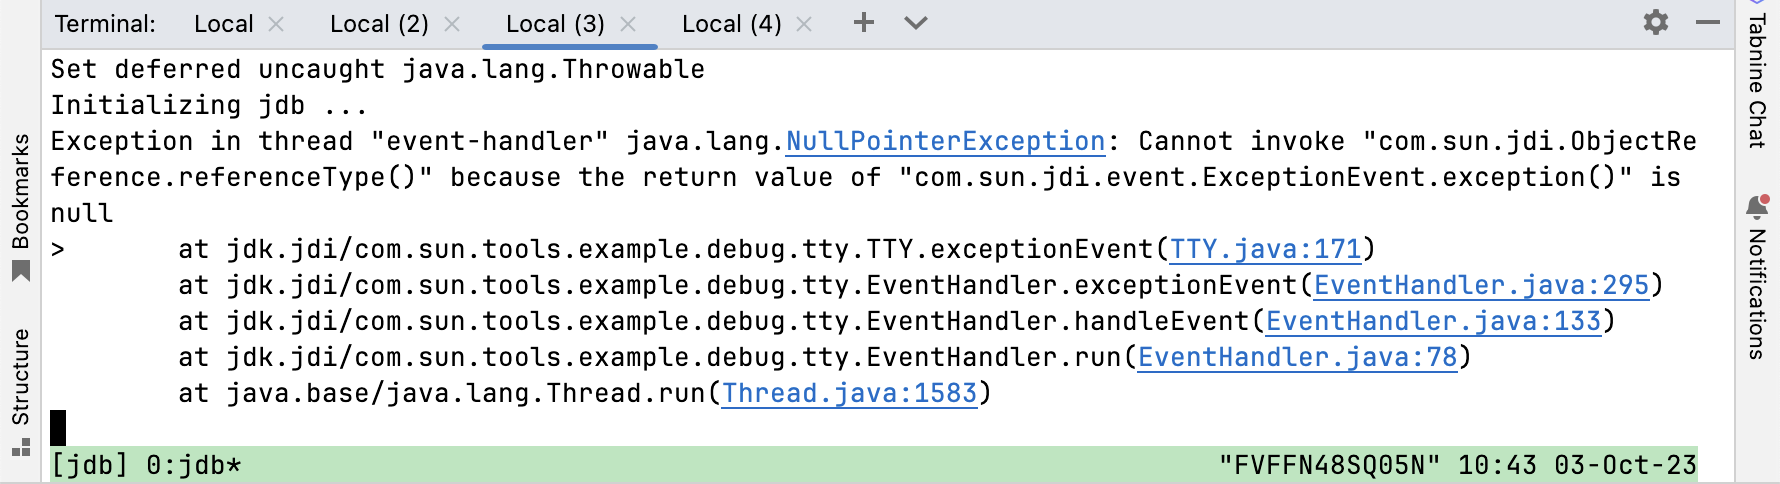
onthrow=<exception>) - The program threw an uncaught exception (
onuncaught=y)
This is quite useful because the JDWP agent has to do substantial initialization before it can start listening for the attaching debugger:
The triggering event invokes the bulk of the initialization, including creation of threads and monitors, transport setup, and installation of a new event callback which handles the complete set of events.
Comment in JDWP-agent Source Code
Other things, like class loading, were slower with an attached debugger in older JDK versions (see JDK-8227269).
But what happens after you end the debugging session? Is your debugged program aborted, and if not, can you reattach your debugger at a later point in time? The answer is as always: It depends. Or, more precisely: It depends on the remote debugger you’re using and how you terminate the debugging session.

But why should you disconnect and then reattach a debugger? It allows you to not run the debugger during longer ignorable stretches of your application’s execution. The overhead of running the JDWP agent waiting for a connection is minimal compared to the plethora of events sent from the agent to the debugger during a debugging session (like class loading events, see A short primer on Java debugging internals).
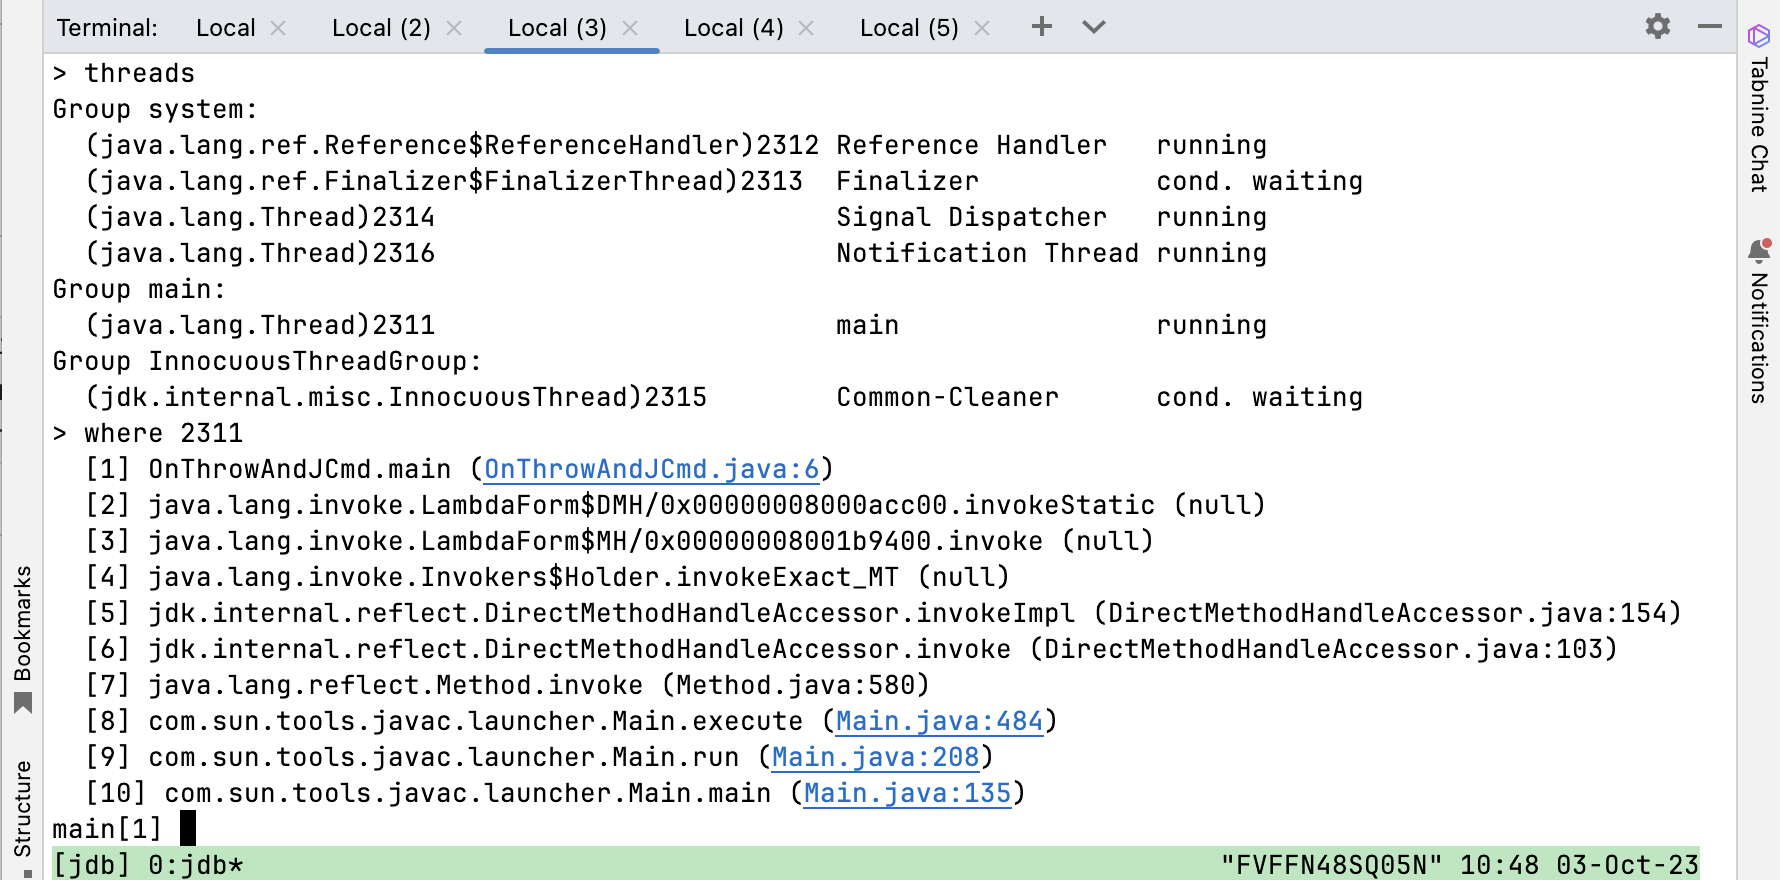
Before we cover how to (re)attach a debugger in IDEs, we’ll see how this works on the JDWP/JDI level:
On JVM Level
The JDWP agent does not prevent the debugger from reattaching. There are two ways that Debugging sessions can be closed by the debugger: dispose and exit. Disposing of a connection via the JDWP Dispose command is the least intrusive way. This command is exposed to the debugger in JDI via the VirtualMachine#dispose() method:
Invalidates this virtual machine mirror. The communication channel to the target VM is closed, and the target VM prepares to accept another subsequent connection from this debugger or another debugger, including the following tasks:
- All event requests are cancelled.
- All threads suspended by
suspend()or byThreadReference.suspend()are resumed as many times as necessary for them to run.- Garbage collection is re-enabled in all cases where it was disabled through
ObjectReference.disableCollection().Any current method invocations executing in the target VM are continued after the disconnection. Upon completion of any such method invocation, the invoking thread continues from the location where it was originally stopped.
JDI Documentation
This essentially means that disposing of a debugging connection does not prevent the currently debugged application from continuing to run.
The other way is using the exit command, exposed as VirtualMachine#exit(int exitCode):
Causes the mirrored VM to terminate with the given error code. All resources associated with this VirtualMachine are freed. If the mirrored VM is remote, the communication channel to it will be closed.
JDI DOCUMENTATION
This, of course, prevents the debugger from reattaching.
Reattaching with IDEs
NetBeans, IntelliJ IDEA, and Eclipse all support reattaching after ending a debugging session by just creating a new remote debugging session. Be aware that this only works straightforwardly when using remote debugging, as the local debugging UI is usually directly intertwined with the UI for running the application. I would recommend trying remote debugging once in a while, even when debugging on your local machine, to be able to use all the advanced features.
Terminating an Application with IDEs
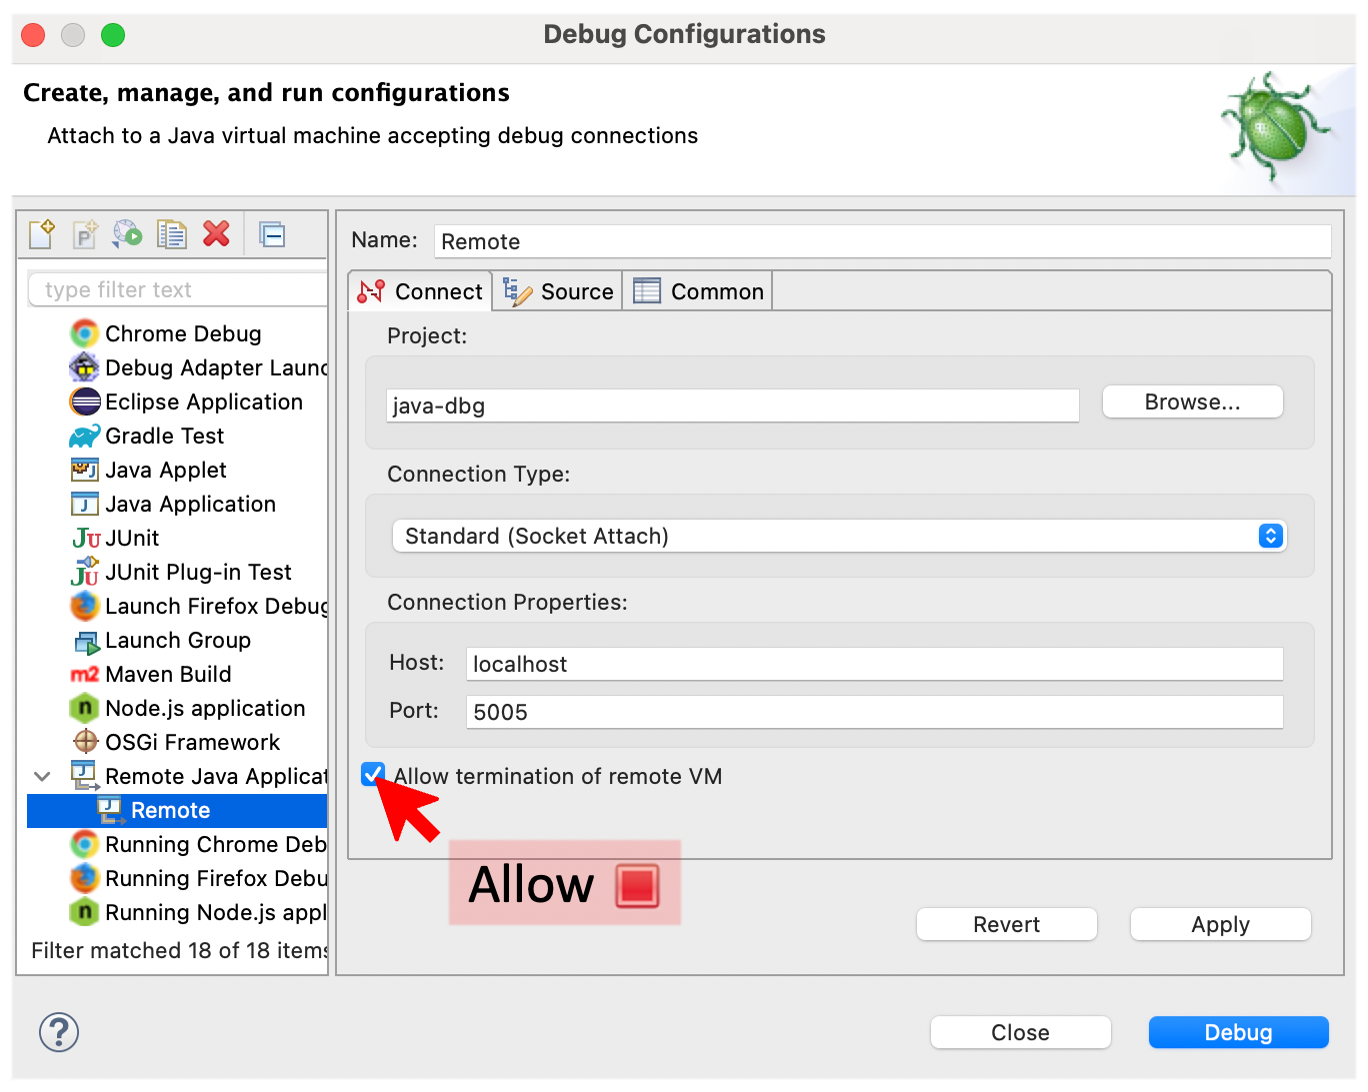
NetBeans is the only IDE of the three that does not support this (as far as I can ascertain). IntelliJ IDEA and Eclipse both support it, with Eclipse having the more straight-forward UI:

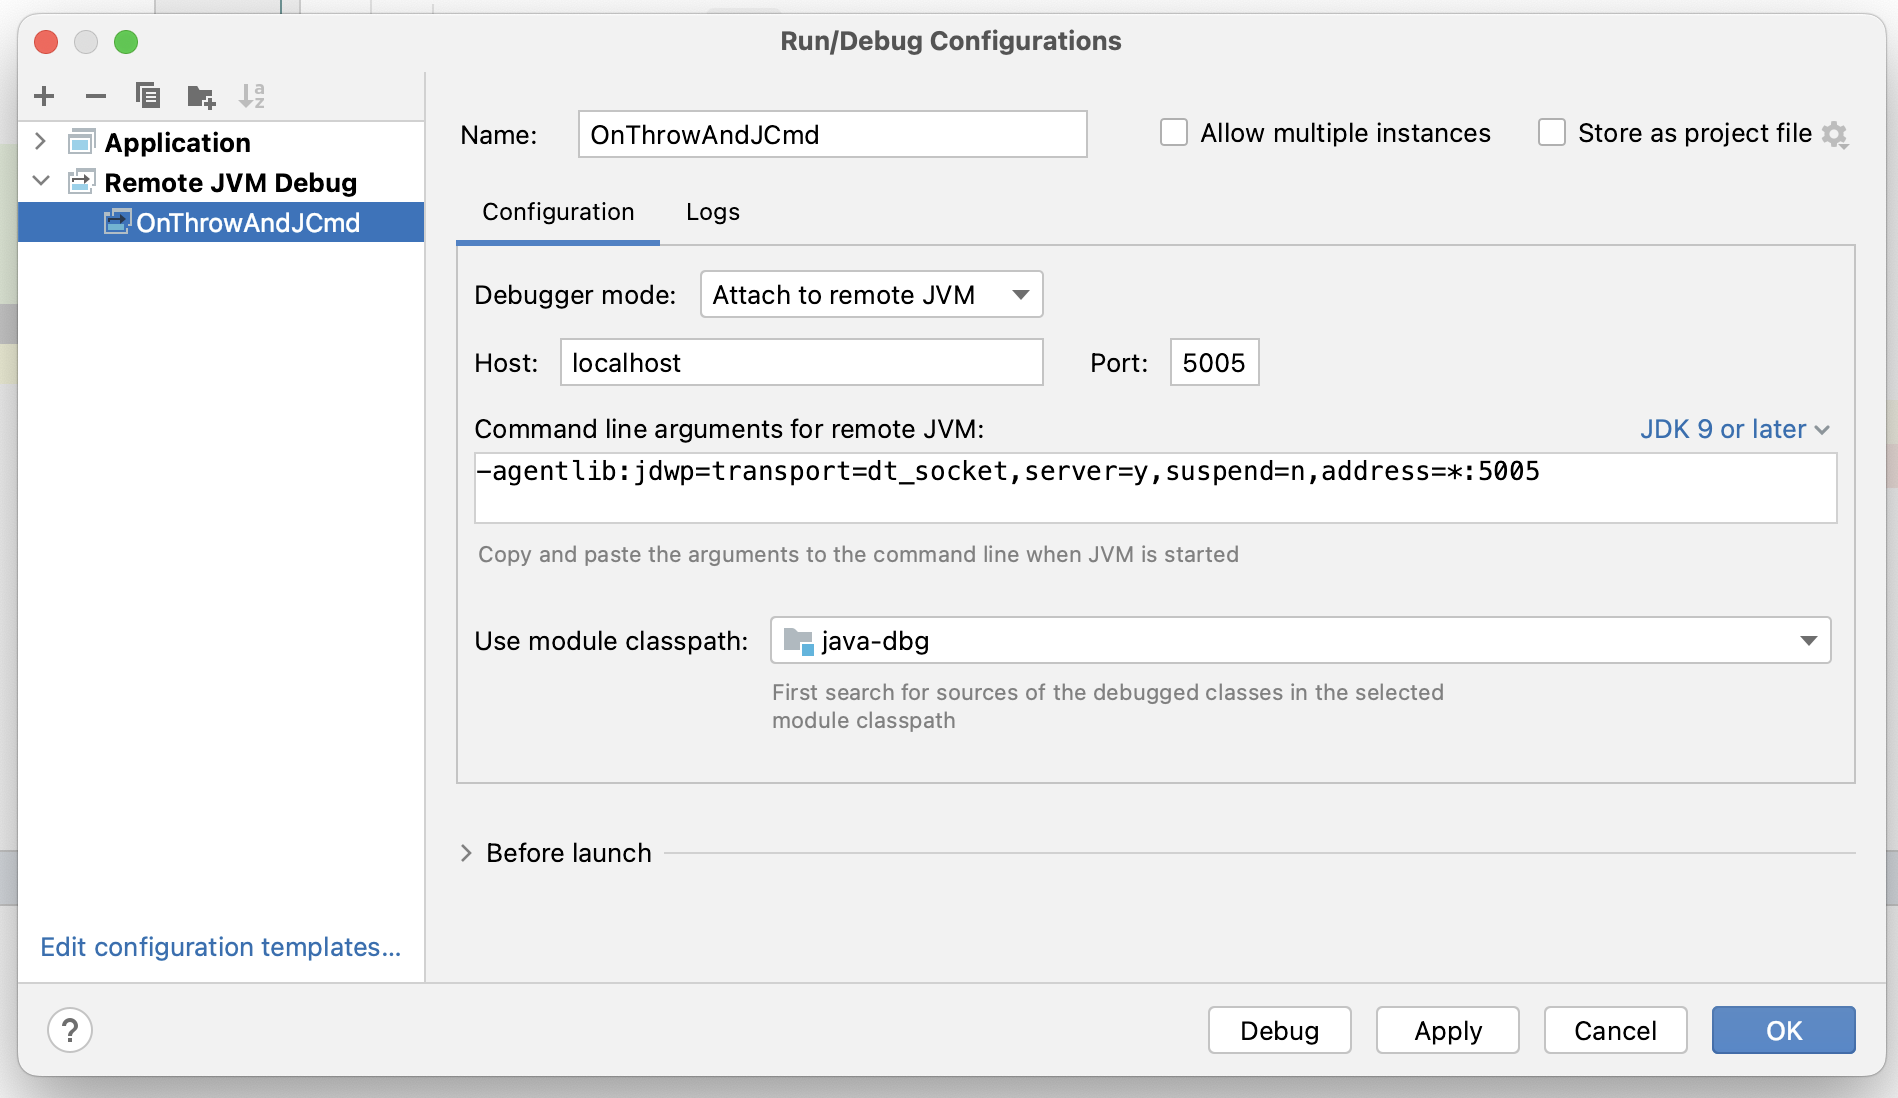
If the terminate button is not active, then you might have to tick the Allow termination of remote VM check-box in the remote configuration settings:
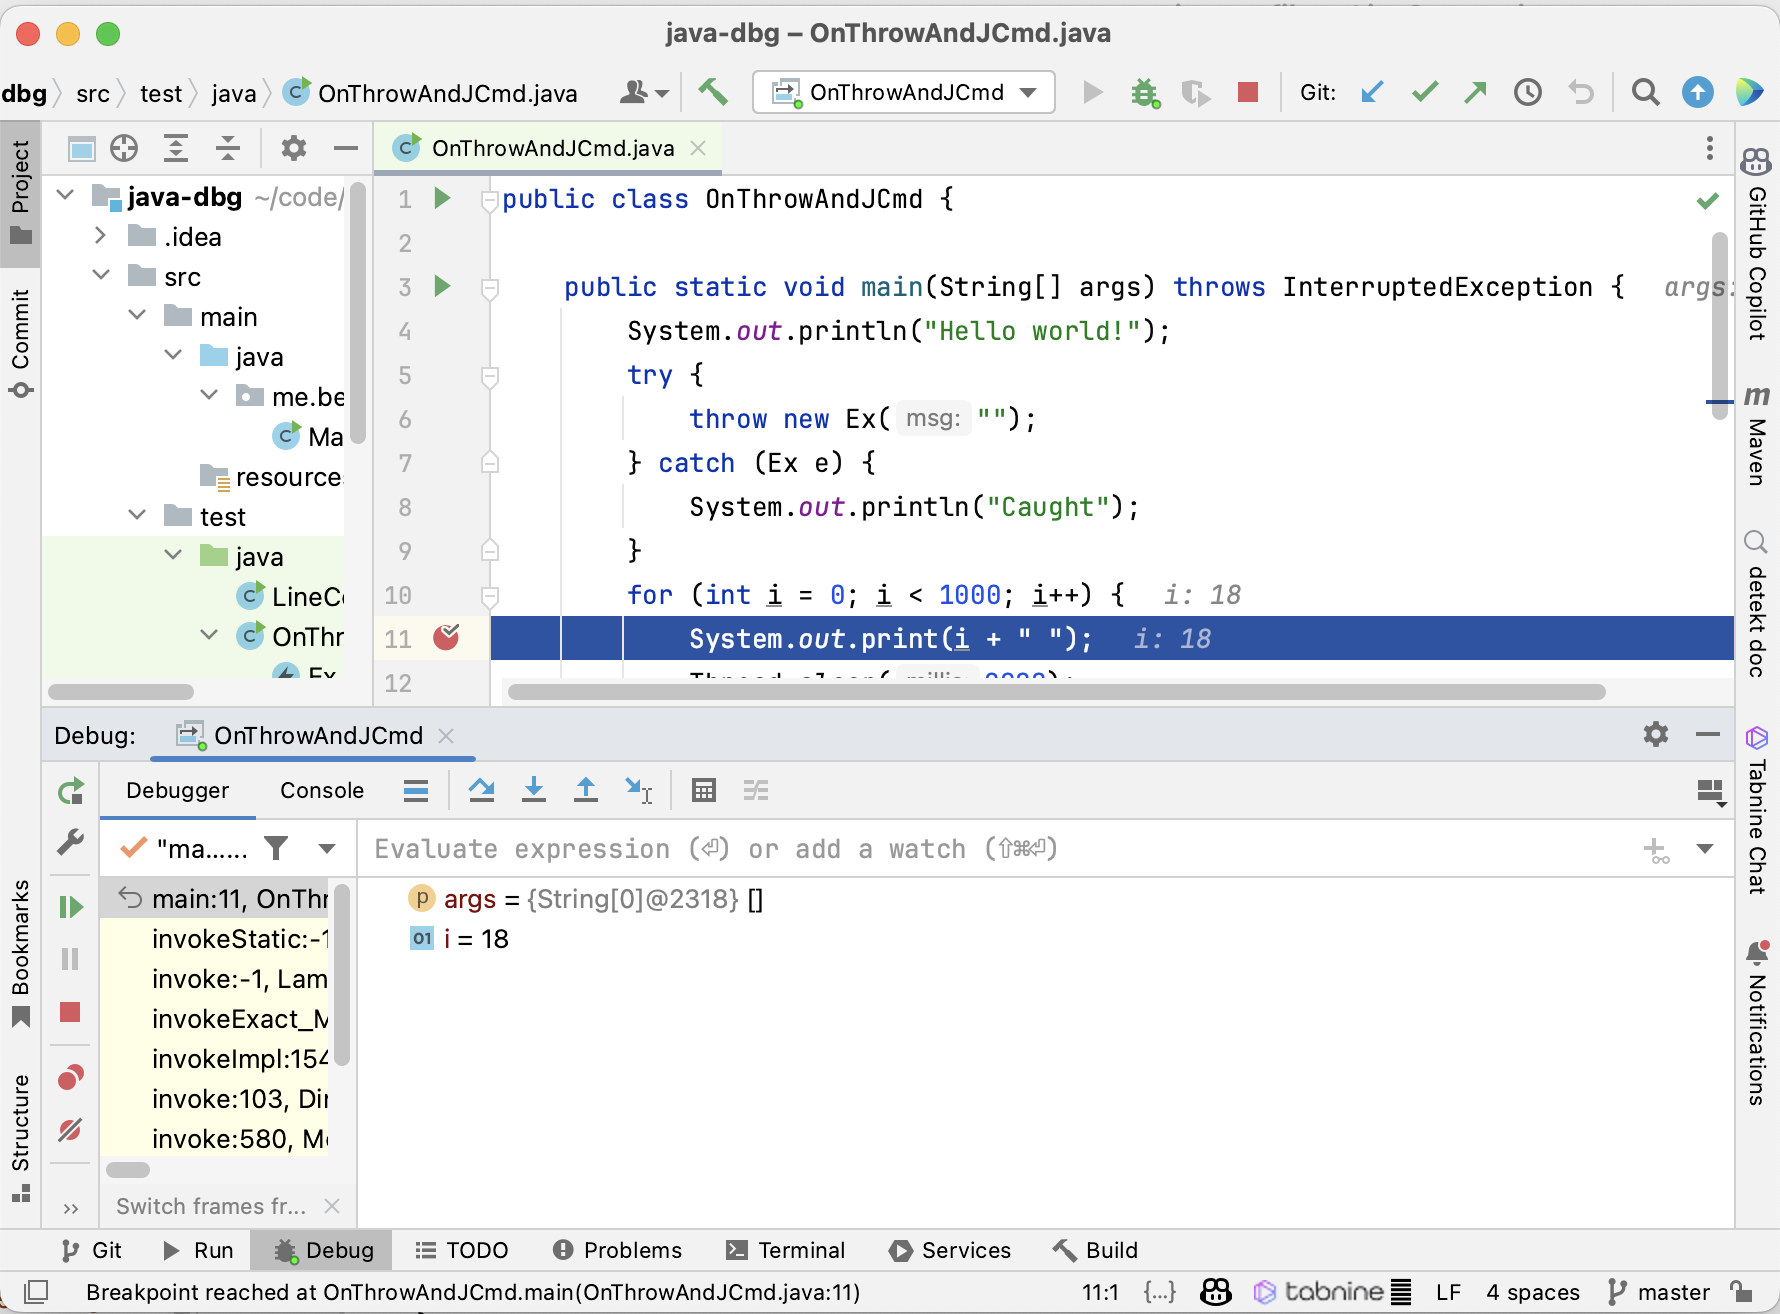
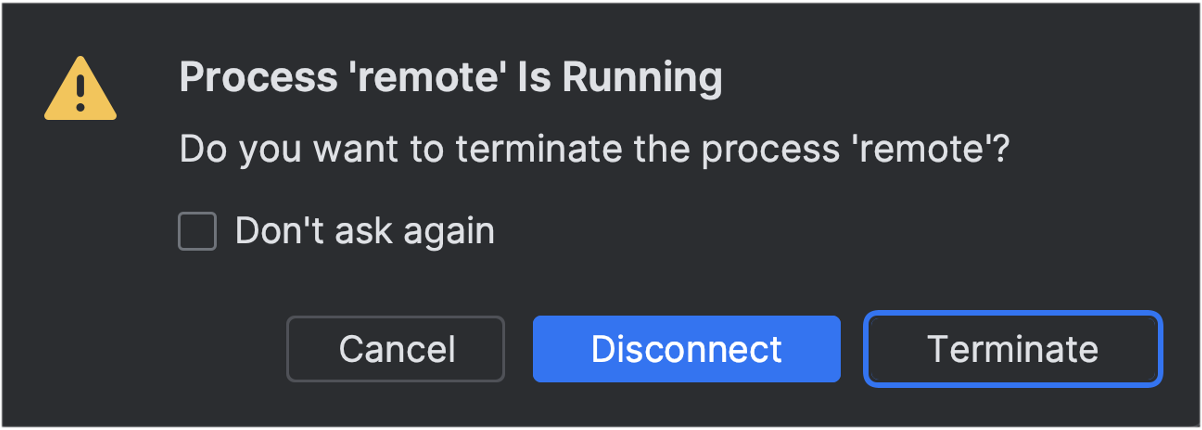
IntelliJ IDEA’s UI is, in this instance, arguably less discoverable: To terminate the application, you have to close the specific debugging session tab explicitly.

This then results in a popup that offers you the ability to terminate:
Conclusion
The ability to disconnect and then reattach debuggers is helpful for many complex debugging scenarios and can help you debug faster. Being able to terminate the application directly from the debugger is an additional time saver when working with remote debugging sessions. Both are often overlooked gems of Java debugging, showing once more how versatile the JDWP agent and UI debuggers are.
I hope you enjoyed this addendum to my Level-up your Java Debugging Skills with on-demand Debugging blog post. If you want even more debugging from me, come to my talk on debugging at JUG Karlsruhe on the 7th of November, to the ConFoo conference in Montreal on the 23rd of February, and hopefully, next year a conference or user group near you.
This article is part of my work in the SapMachine team at SAP, making profiling and debugging easier for everyone. It was supported by rainy weather and the subsequent afternoon in a cafe in Bratislava: