Have you ever wondered how debuggers work? What happens when you set a breakpoint and hit it later? Debuggers are tools that we as developers use daily in our work, but few know how they are actually implemented.
import sys


def fib(n: int) -> int:
    if n <= 1:
        f = n
    else:
        f1 = fib(n - 1)
        f2 = fib(n - 2)
        f = f1 + f2
    return f


if __name__ == '__main__':
    n = int(sys.argv[1]) if len(sys.argv) > 1 else 10
    print(fib(n))
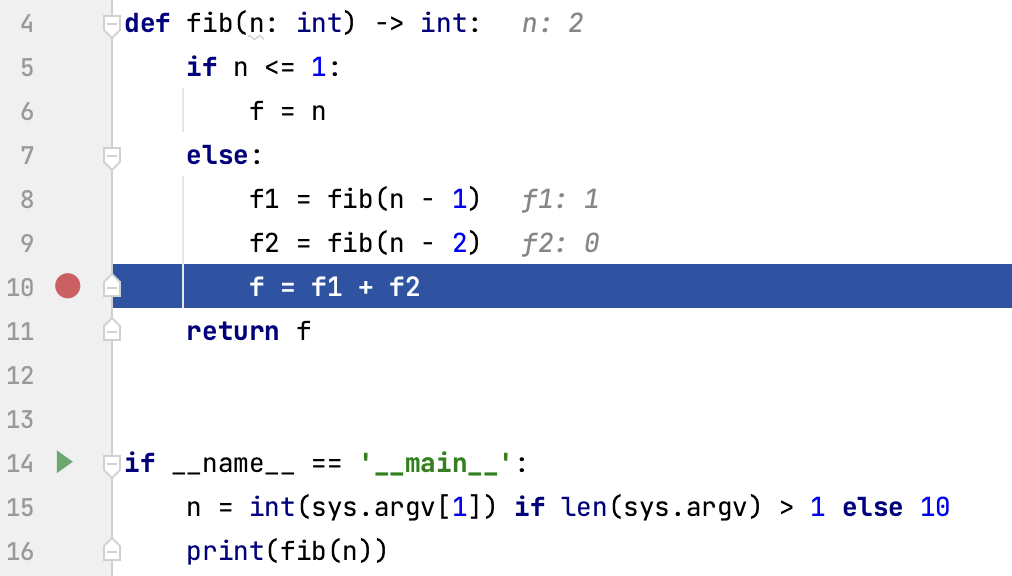
This program computes a Fibonacci number. When we open this program in our favorite Python IDE (PyCharm in my case), we can set a breakpoint at a specific line, like line 10:
We can then run the program in the debugger and the execution will surely hit line 8:
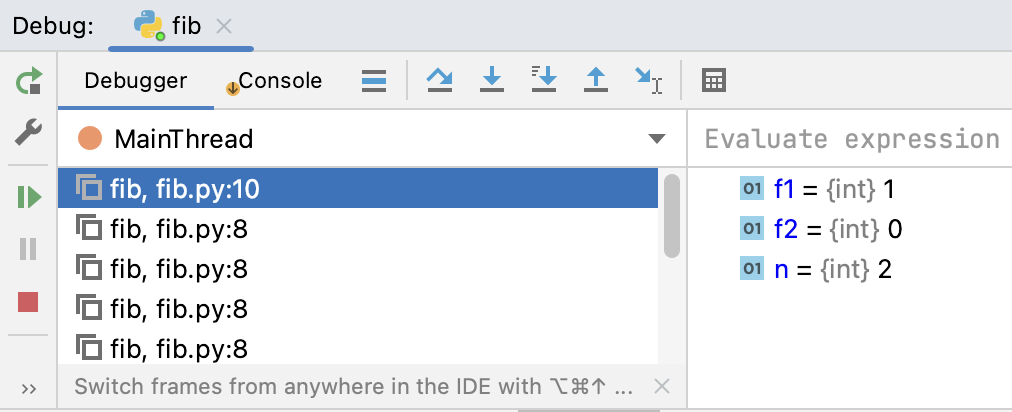
And we can explore the initial value of n, step into or over the current line and evaluate custom expressions:
But how does this work? Fortunately for us, PyCharm’s Community Edition debugger is open-source, so we can take a look. But as the debugger is quite complex, I’m going to focus on command-line debuggers.
Command Line Debugger
There is already a command line debugger built-in into Python called pdb:
The module pdb defines an interactive source code debugger for Python programs. It supports setting (conditional) breakpoints and single stepping at the source line level, inspection of stack frames, source code listing, and evaluation of arbitrary Python code in the context of any stack frame. It also supports post-mortem debugging and can be called under program control.
The debugger is extensible – it is actually defined as the class Pdb. This is currently undocumented but easily understood by reading the source. The extension interface uses the modules bdb and cmd.
(Pdb) help

Documented commands (type help <topic>):
========================================
EOF    c          d        h         list      q        rv       undisplay
a      cl         debug    help      ll        quit     s        unt
alias  clear      disable  ignore    longlist  r        source   until
args   commands   display  interact  n         restart  step     up
b      condition  down     j         next      return   tbreak   w
break  cont       enable   jump      p         retval   u        whatis
bt     continue   exit     l         pp        run      unalias  where
To set a breakpoint, use the b(reak) [ ([filename:]lineno | function) [, condition] ] command, continue to the break-point with c(ont(inue)) and inspect n via display [expression]:
(Pdb) break test.py:8
Breakpoint 1 at .../test.py:8
(Pdb) c
> .../test.py(8)fib()
-> f = fib(n - 1) + fib(n - 2)
(Pdb) display n
display n: 10
Yet this debugger is still quite complex, but we can build our own version, focusing on a subset of features and only supporting line breakpoints.
Debugger Base
You can find the code of the debugger in my python-dbg repository, it’s MIT licensed and requires Python 3.10+ to run. Feel free to use it as the base for your own projects.
The basic debugger class compiles the file passed on the command line and executes it, after setting some hooks (see dbg_base):
class Dbg:

    def run(self, file: Path):
        # see https://realpython.com/python-exec/#using-python-for-configuration-files
        compiled = compile(file.read_text(), filename=file.name, mode='exec')
        sys.argv.pop(0)
        # set stuff here
        try:
            exec(compiled, globals())
        except DbgContinue:
            pass
We extend this base debugger one feature at a time in the following. But first, we start with the simplest possible debugger, a debugger based on the built-in breakpoint() function.
breakpoint() based debugger
Python 3.7 introduced the function breakpoint() (PEP 553) which calls sys.breakpointhook under the hood. This allows us to implement a basic debugger, albeit not supporting dynamic breakpoints or stepping.
The general usage of this debugger is similar to pdb: python3 -m dbg_breakpoint fib_breakpoint.py starts a debugging session, running a modified sample file:
# ...

def fib(n: int) -> int:
    if n <= 1:
        f = n
    else:
        f1 = fib(n - 1)
        f2 = fib(n - 2)
        breakpoint()
        f = f1 + f2
    return f

# ...
We hard-coded the break-point here. This also sets a break-point in PyCharm. Our debugger lets the user run arbitrary code at each break in the context of the interrupted function, adding a few additional helper methods:
>>> dbg_help()
  Ctrl-D to end breakpoint
  _h                                     dict with all helper functions
  _st                                    store dict, shared between shells
  _frame                                 current frame
  cont()                                 continue the program execution
  skip_breaks(count)                     skip breakpoints
  exit()                                 exit the program
  locals()                               show local variables
  location()                             show current location
  show(file,start,end,header)            show code
  context(pre,post)                      show context
  current_file()                         show current file
  stacktrace()                           show stacktrace
  show_function(func)                    show function
  break_at_func(func,line)               break at function (optional line number)
  break_at_line(file,func,line)          break at line in file, -1 first line in function
  remove_break(func,line)                remove breakpoint
  remove_break_at_line(file,func,line)   remove breakpoint
  remove_all_breaks(file)                None
  dbg_help()                             show this help
Now to the implementation in dbg_breakpoint.py, for which we extend our Dbg class by first setting the break-point hook in the run function before the execution of the debugged program:
The heavy lifting is done in _breakpoint function. But before we get to it, we have to understand how we can access the stack frames of the caller when in the callee. We use the (CPython) function sys._getframe([depth]) for this purpose:
Return a frame object from the call stack. If optional integer depth is given, return the frame object that many calls below the top of the stack. If that is deeper than the call stack, ValueError is raised. The default for depth is zero, returning the frame at the top of the call stack.
Calling sys._getframe(1) in a function gives us the desired caller frame. The frame object has the following read-only attributes:
f_back is to the previous stack frame (towards the caller), or None if this is the bottom stack frame;
f_code is the code object being executed in this frame;
f_locals is the dictionary used to look up local variables;
f_globals is used for global variables;
f_builtins is used for built-in (intrinsic) names;
…
f_lineno is the current line number of the frame — writing to this from within a trace function jumps to the given line (only for the bottom-most frame).
Armed with this knowledge, we can implement our _breakpoint function:
    def _breakpoint(self, *args, **kwargs):
        if self._in_breakpoint:
            return
        # ...
        frame = sys._getframe(1)
        print(f"breakpoint: {frame}")
        self._stop = False

        helpers = {}

        # a function decorator that store the helper methods
        def func(f: Callable) -> Callable:
            helpers[f.__name__.lstrip('_')] = f
            return f

        def cont():
            """continue the program execution"""
            raise SystemExit(DbgContinue(_exit=False))

        # ...

        @func
        def _locals():
            """show local variables"""
            return frame.f_locals
        # ...

        # implementation of the other methods for brevity

        @func
        def exit():
            raise DbgContinue(_exit=True)

        self._in_breakpoint = True

        message = f"breakpoint at {frame.f_code.co_filename}:{frame.f_lineno} ({frame.f_code.co_name})"
        self._eval(_locals=frame.f_locals | helpers, message=message)


        self._in_breakpoint = False
We could of course write our own read-eval-print-loop for the breakpoint shell, but we don’t need to, as there are two great alternatives out there: the built-in InteractiveConsole and bpython
Implement Shell using InteractiveConsole
InteractiveConsole allows us to create a shell akin to the actual python shell. We subclass it to handle SystemExit exceptions properly. We use these exceptions to end the individual shell and pass DbgContinue objects from the shell to the breakpoint handler, to exit the whole program if needed.
We then use the InteractiveConsole whenever we don’t have bpython available, so it our simple eval:
    def _simple_eval(self, _locals: dict, message: str):
        try:
            print(message)
            CustomInteractiveConsole(_locals).interact(banner="", exitmsg="")
        except SystemExit as e:
            if isinstance(e.args[0], DbgContinue):
                if e.args[0].exit:
                    exit()
            else:
                exit(e.args)
Implement Shell using python
bpython allows us to have a shell with more features:
bpython is a lightweight Python interpreter that adds several features common to IDEs. These features include syntax highlighting, expected parameter list, auto-indentation, and autocompletion. (See below for example usage).
bpython formats code using the TerminalFormatter of pygments. We can do the same to show the current context in our shell:
This is also supported when no bpython package is present, albeit without the syntax highlighting.
Verdict
We created our first Python debugger in a few lines of code (ignoring new lines and comments), you can find the full code at dbg_breakpoint.py.
But if we’re honest, then we need a few more features in our debugger, we want
to set breakpoints dynamically
to single step over lines
to step into methods
We implement dynamic breakpoints in the following, while still using a Python shell as our debugging shell, saving us the effort to implement command line parsing.
trace-based debugger
The great thing is that we can reuse all the breakpoint handling, including support for breakpoint() and just dynamic breakpoints on top of it. For this, we use the sys.settrace function to register a trace function:
Set the system’s trace function, which allows you to implement a Python source code debugger in Python. […]
Trace functions should have three arguments: frame, event, and arg. frame is the current stack frame. event is a string: 'call', 'line', 'return', 'exception' or 'opcode'. arg depends on the event type.
The trace function is invoked (with event set to 'call') whenever a new local scope is entered; it should return a reference to a local trace function to be used for the new scope, or None if the scope shouldn’t be traced.
The local trace function should return a reference to itself (or to another function for further tracing in that scope), or None to turn off tracing in that scope.
If there is any error occurred in the trace function, it will be unset, just like settrace(None) is called.
The events have the following meaning:
'call'
A function is called (or some other code block entered). The global trace function is called; arg is None; the return value specifies the local trace function.
'line'
The interpreter is about to execute a new line of code or re-execute the condition of a loop. The local trace function is called; arg is None; the return value specifies the new local trace function. […] Per-line events may be disabled for a frame by setting f_trace_lines to False on that frame.
'return'
A function (or other code block) is about to return. The local trace function is called; arg is the value that will be returned, or None if the event is caused by an exception being raised. The trace function’s return value is ignored.
We go over the code step-by-step, but you can find the whole code on GitHub in the dbg.py file.
Implementation
With this, we cannot set breakpoints directly, but we trace every function with a break-point in it and every line in them, checking at every line if it has a breakpoint:
    def _handle_line(self, frame: types.FrameType):
        if self._should_break_at(frame):
            self._breakpoint()

    def _dispatch_trace(self, frame: types.FrameType, event, arg):
        if self.is_first_call and self._main_file == Path(frame.f_code.co_filename):
            self.is_first_call = False
            self._breakpoint()
            return
        if event == 'call':
            if self._has_break_point_in(frame.f_code):
                if event == 'line' or event == 'call':
                    self._handle_line(frame)
                elif event == 'return' or event == 'exception':
                    self._handle_return(frame)

    def run(self, file: Path):
        # ...
        sys.settrace(self._dispatch_trace)
        # ...
We therefore need a mapping from (frame) file to breakpoint line numbers, so we can check self._should_break_at(frame), and a set of code objects with breakpoints for self._has_break_point_in(frame.f_code):
        # file -> {line numbers of break points}
        self._breakpoints_in_files: Dict[Path, Set[int]] = {}
        # file -> {starting numbers of scopes with breakpoints mapped to the breakpoint count}
        self._scopes_with_breakpoint: Dict[Path, Dict[int, int]] = {}
        # file -> {line number of breakpoint -> starting line number of scope}
        self._breakpoint_to_scope_start: Dict[Path, Dict[int, int]] = {}
We fill this for every breakpoint, giving us two breakpoint setter functions:
        @func
        def break_at_func(func: Callable, line: int = -1):
            """break at function (optional line number)"""
            self.add_breakpoint(Path(inspect.getsourcefile(func)), line, func.__code__.co_firstlineno)

        @func
        def break_at_line(file: str, func: str, line: int = -1):
            """break at line in file, -1 first line in function"""
            start_line = find_function(func, file)
            if start_line is not None:
                self.add_breakpoint(Path(file), start_line if line == -1 else line, start_line)
            else:
                print("No such function")
break_at_line uses the find_function function with I adapted from the pdb source code to find the starting line of a function.
Now we can have our first debugging session:
➜  python-dbg git:(main) ✗ python3 -m dbg fib.py
breakpoint at fib.py:1 (<module>)        # initial breakpoint
>>> break_at_line("fib.py", "fib")
>>> cont()
fib.py:4 (fib)
  1   import sys
  2
  3
> 4 * def fib(n: int) -> int:
  5       if n <= 1:
  6           f = n
  7       else:
  8           f1 = fib(n - 1)
  9

breakpoint at fib.py:4 (fib)
>>> n
10
>>> exit()
There might be some lines printed twice in the PyCharm terminal, it works as expected in normal terminals though.
Conclusion
I’ve shown you in this article how to implement a basic debugger that supports breakpoint() and dynamically setting break-points. This debugger is fairly flexible and can be used for basic bug finding tasks. Python is a great language runtime which supports building such tools with ease.
The follow-up article will cover two important, yet missing features, the abilties
to single step over lines, and
to step into methods
I hope you liked this non-Java article, if so, please share it with your pythonista collegues and friends.
New posts like these come out at least every two weeks, to get notified about new posts, follow me on Twitter, Mastodon, or LinkedIn, or join the newsletter:


Funnily enough – I did something very similar to a different scripting language a while ago: Beanshell is a scripting dialect for java with the drawback of not being debuggable – well, until I came along… https://elbosso.github.io/beanshell_debugger___neue_version.html#content