Walking only at safepoints has advantages: The main one is that you aren’t walking the stack in a signal handler but synchronously to the executed program. Therefore you can allocate memory, acquire locks and rematerialize virtual thread / Loom frames. The latter is significant because virtual threads are the new Java feature that cannot support using signal-handler-based APIs like AsyncGetCallTrace.
This blog post is based on the ideas of Erik Österlund, and the second one is related to these new ideas. The first one is AsyncGetCallTrace Reworked: Frame by Frame with an Iterative Touch!, which you should read before continuing with this post. For a refresher on safepoints, please read The Inner Workings of Safepoints.
Erik summed up the problems with my previous JEP proposal, and in a way with AsyncGetCallTrace, quite nicely:
Well the current proposal doesn’t have a clear story for
1) Making it safe
2) Working with virtual threads
3) Supporting incremental stack scanning
4) Supporting concurrent stack scanning
He proposed that walking Java threads only at safepoints while obtaining some information in the signal handler might do the trick. So I got to work, implementing an API that does just this.
Idea
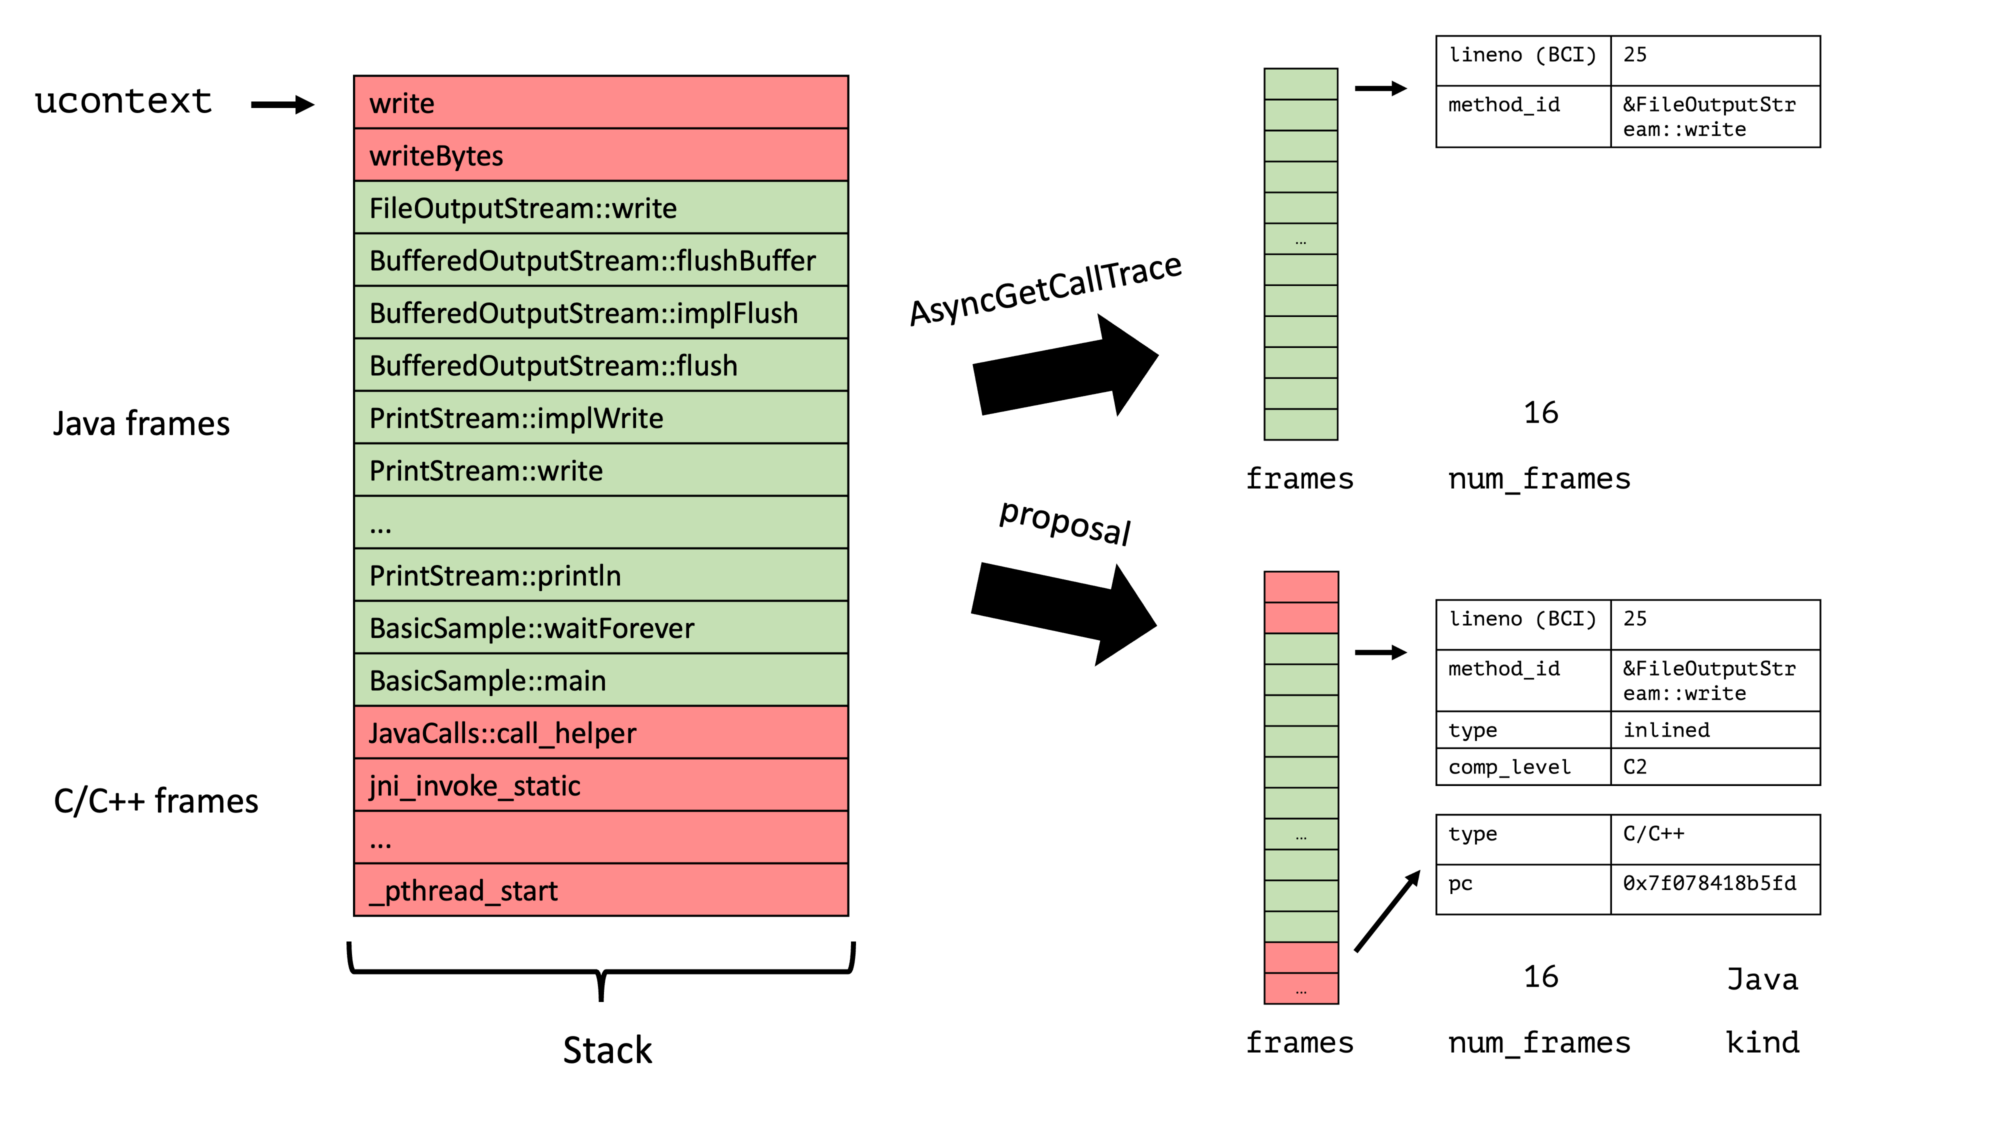
The current interaction between a sampler of the profiler and the Java Threads looks like the following:

The sampler thread signals every Java thread using POSIX signals and then obtains the full trace directly in the signal handler while the thread is paused at an arbitrary location. I explored variations of this approach in my post Couldn’t we just Use AsyncGetCallTrace in a Separate Thread?
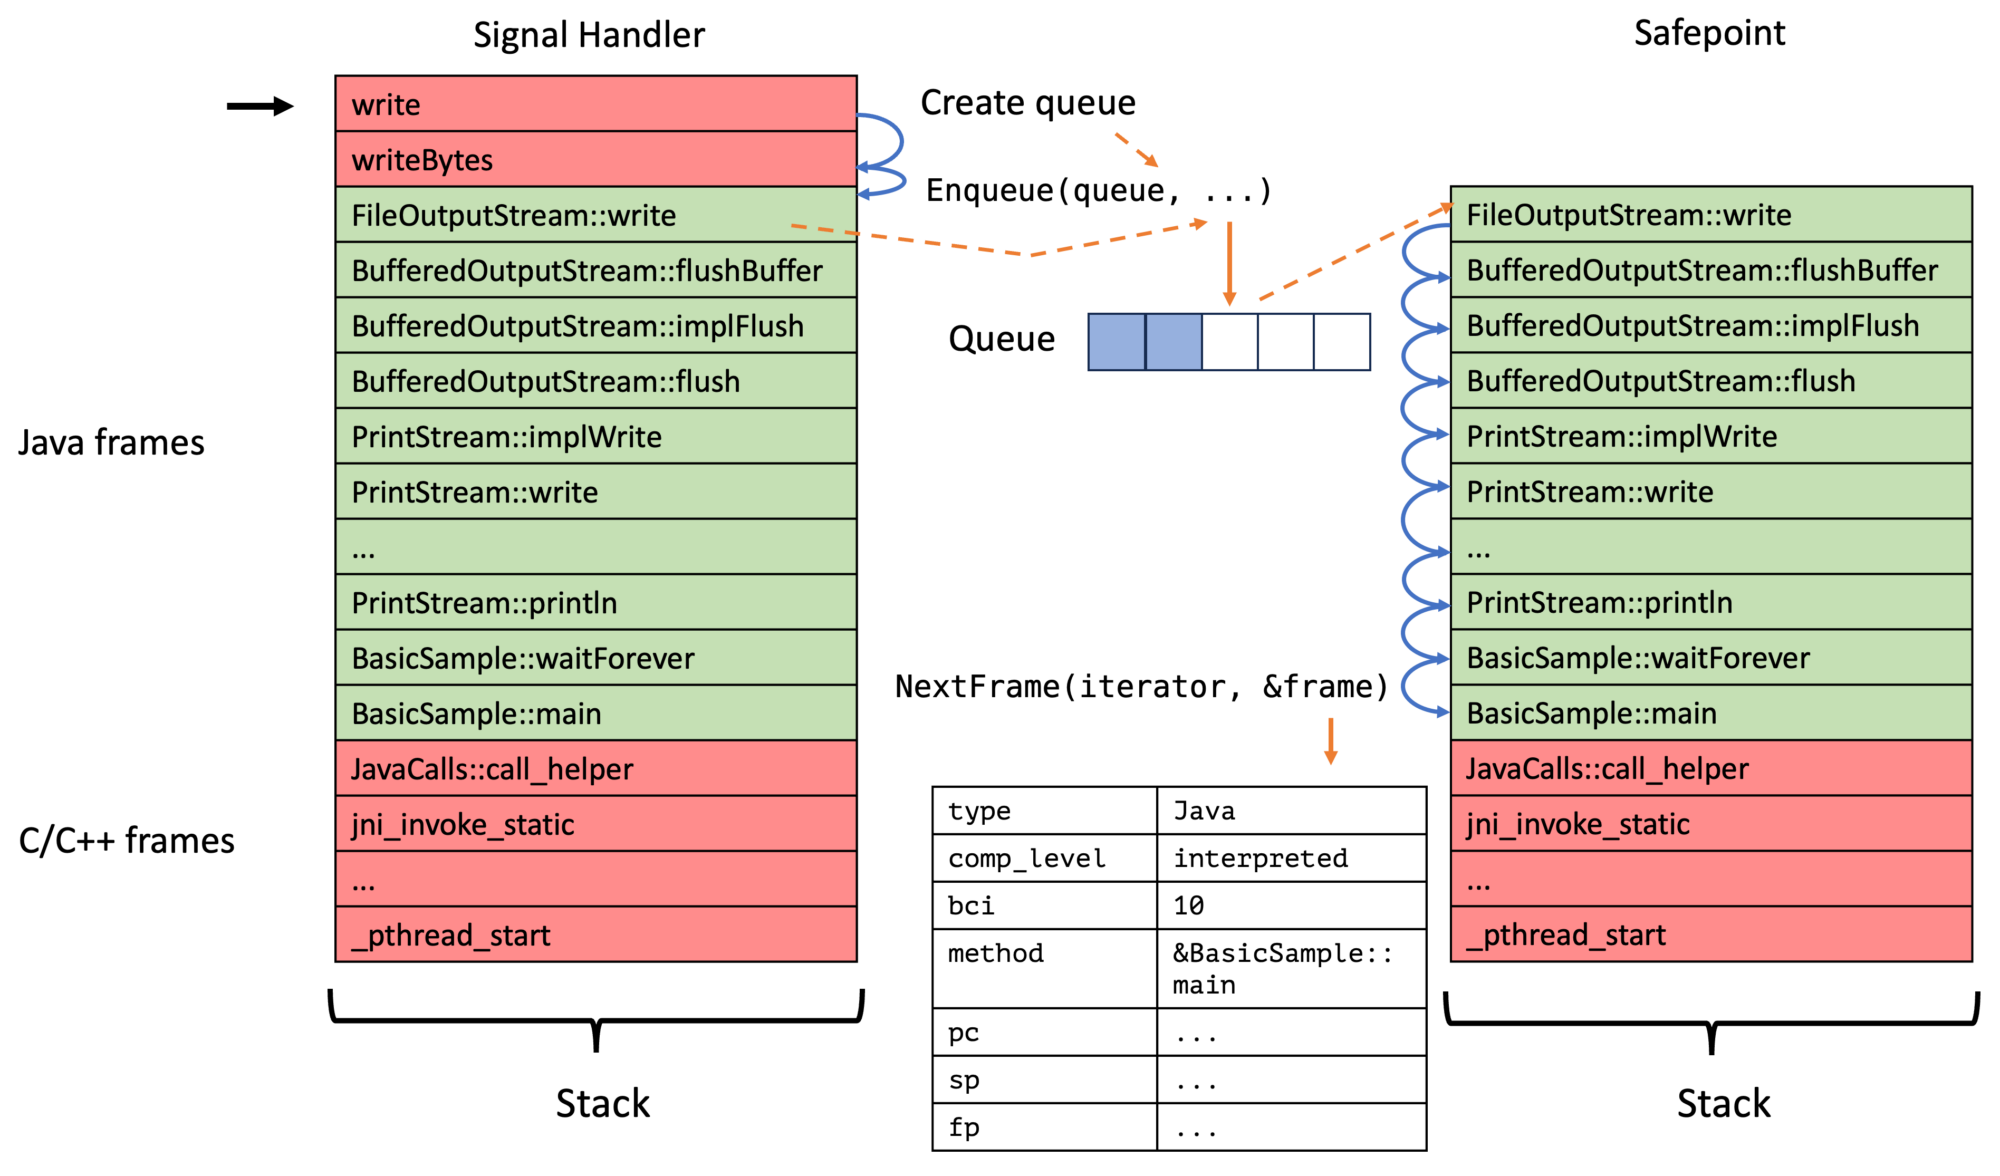
My new approach, on the contrary, walks the Java thread in a signal handler till we find the first bytecode-backed Java frame, stores this in the thread-local queue, triggers a safepoint, and then walks the full Java stack at these safepoints for all enqueued top-frames. We, therefore, have a two-step process:
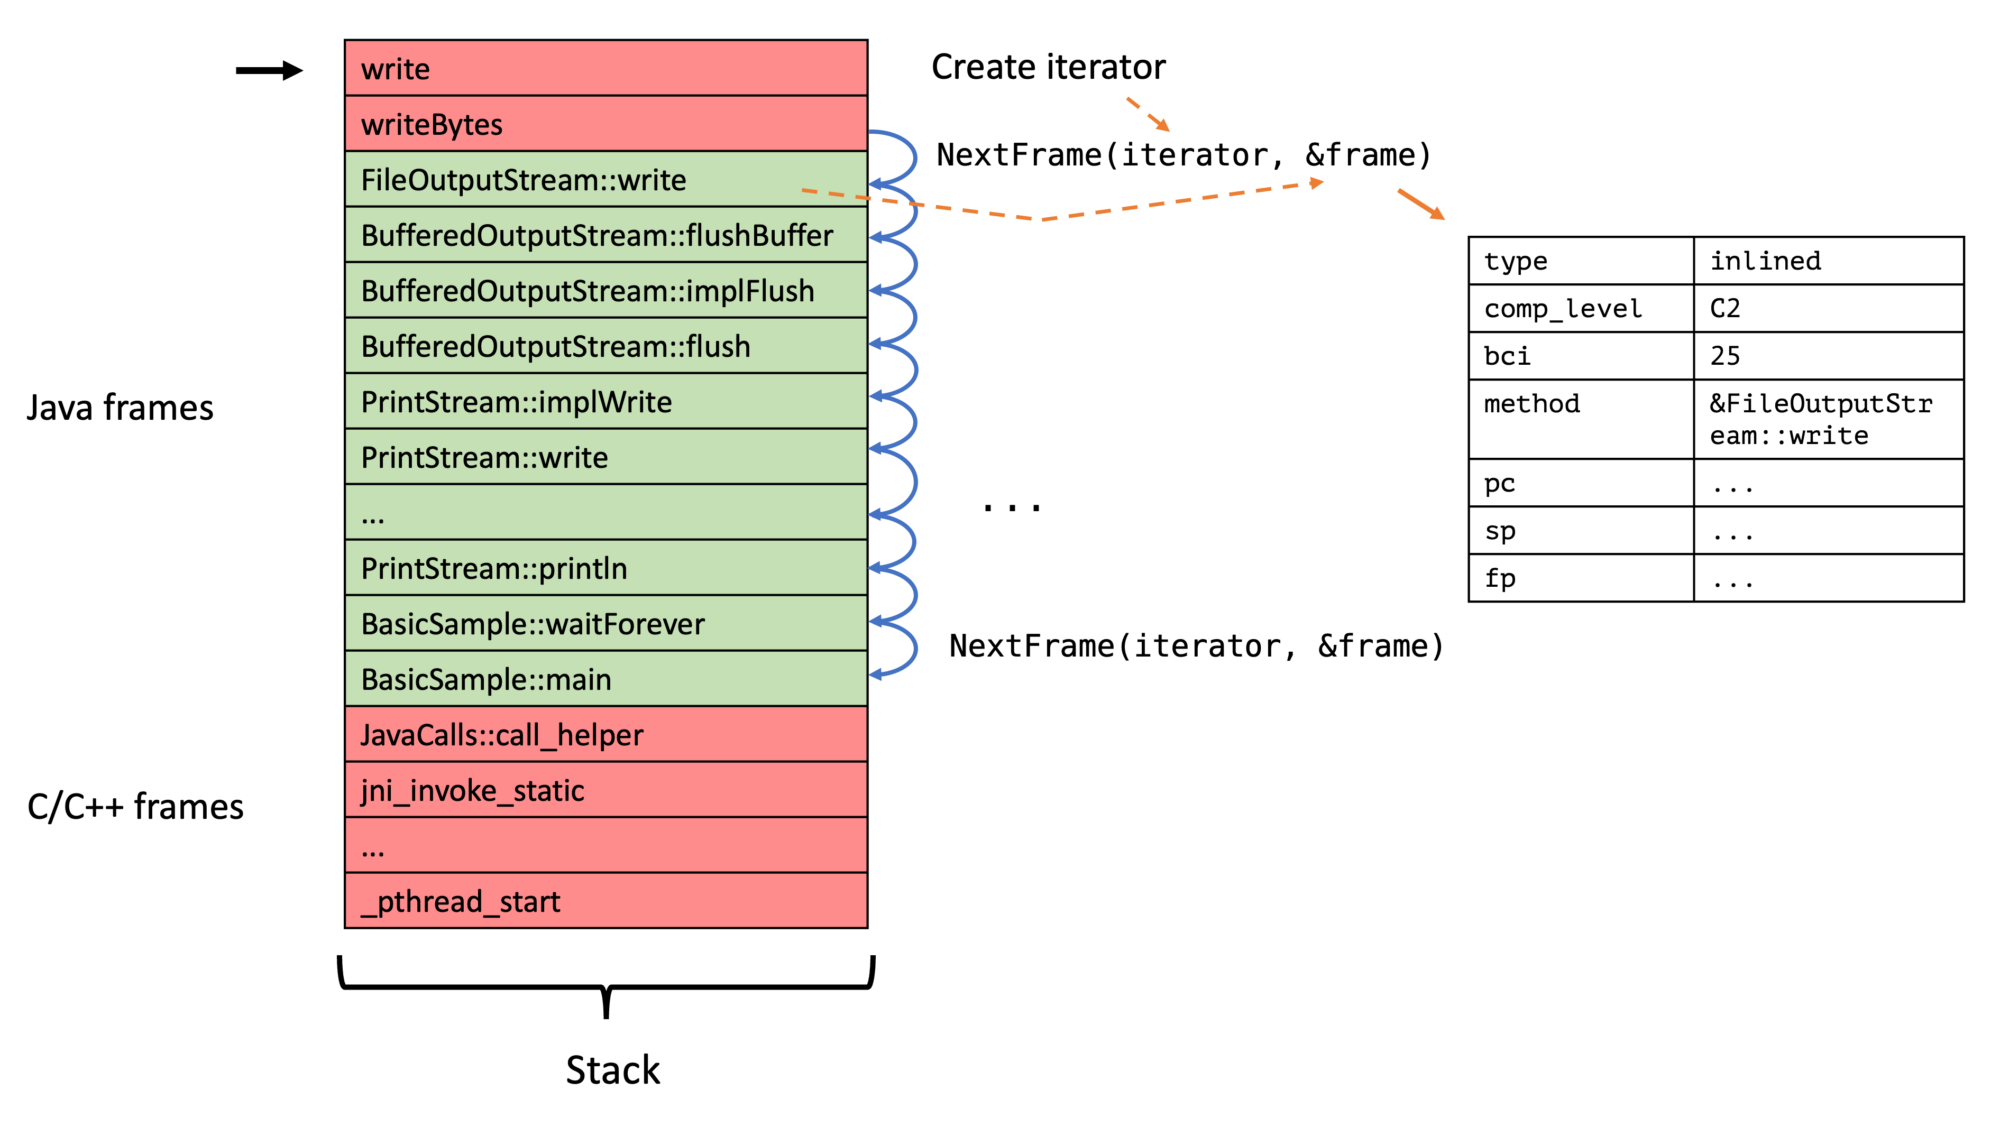
Instead of just walking the stack in the signal handler:

The new API exploits a few implementation details of the OpenJDK:
- There is a safepoint check at least at the end of every non-inlined method (and sometimes there is not, but this is a bug, see The Inner Workings of Safepoints). OpenJ9 doesn’t have checks at returns, so the whole approach I am proposing doesn’t work for them.
- When we are at the return of a non-inlined method, we have enough information to obtain all relevant information of the top inlined and the first non-inlined frame using only the program counter, stack pointer, frame pointer, and bytecode pointer obtained in the signal handler. We focus on the first non-inlined method/frame, as inlined methods don’t have physical frames, and walking them would result in walking using Java internal information, which we explicitly want to avoid.
Proposed API
This API builds upon the API defined in jmethodIDs in Profiling: A Tale of Nightmares and the iterator API defined in AsyncGetCallTrace Reworked: Frame by Frame with an Iterative Touch!
But, in contrast to the other parts of the API, this new safepoint-based part only works when the previously defined conditions hold. This is not the case in OpenJ9, so I propose making the new feature optional. But how do profilers know whether an implementation supports an optional part of the API? By using the ASGST_Capabilities:
// Implementations don't have to implement all methods,
// only the iterator related and those that match
// their capabilities
enum ASGST_Capabilities {
  ASGST_REGISTER_QUEUE = 1, // everything safepoint queue related
  ASGST_MARK_FRAME     = 2  // frame marking related
};
Profilers can query the capability bit map by calling the int ASGST_Capabilities() and should use the signal handler-based approach whenever the capability bit ASGST_REGISTER_QUEUE is absent. ASGST_MARK_FRAME foreshadows a new feature based on stack watermarks, see JEP 376, which I cover in a follow-up blog post. Calling an unsupported API method is undefined.
Now back to the actual API itself. The main two methods of the proposed API are ASGST_RegisterQueue and ASGST_Enqueue. You typically first register a queue for the current thread using ASGST_RegisterQueue, typically in a ThreadStart JVMTI event handler:
typedef void (*ASGST_Handler)(ASGST_Iterator*,
                              void* queue_arg,
                              void* arg);

// Register a queue to the current thread
// (or the one passed via env)
// @param fun handler called at a safe point with iterators,
//   the argument for RegisterQueue and the argument
//   passed via Enqueue
//
// The handler can only call safe point safe methods,
// which excludes all JVMTI methods, but the handler
// is not called inside a signal handler, so allocating
// or obtaining locks is possible
//
// Not signal safe, requires ASGST_REGISTER_QUEUE capability
ASGST_Queue* ASGST_RegisterQueue(JNIEnv* env, int size,
  int options, ASGST_Handler fun, void* argument);
A queue has a fixed size and has a registered handler, which is called for every queue item in insertion order at every safepoint, after which the queue elements are removed. Be aware that you cannot obtain the top frames using the queue handler and cannot call any JVMTI methods, but also that you aren’t bound to signal safe methods in the handler.
The ASGST_Enqueue method obtains and enqueues the top frame into the passed queue, as well as triggering a thread-local handshake/safepoint:
// Enqueue the processing of the current stack
// at the end of the queue and return the kind
// (or error if <= 0)
// you have to deal with the top C and native frames
// yourself (but there is an option for this)
//
// @param argument argument passed through
//   to the ASGST_Handler for the queue as the third argument
// @return kind or error,
//   returns ASGST_ENQUEUE_FULL_QUEUE if queue is full
//   or ASGST_ENQUEUE_NO_QUEUE if queue is null
//
// Signal safe, but has to be called with a queue
// that belongs to the current thread, or the thread
// has to be stopped during the duration of this call
// Requires ASGST_REGISTER_QUEUE capability
int ASGST_Enqueue(ASGST_Queue* queue, void* ucontext,
  void* argument);
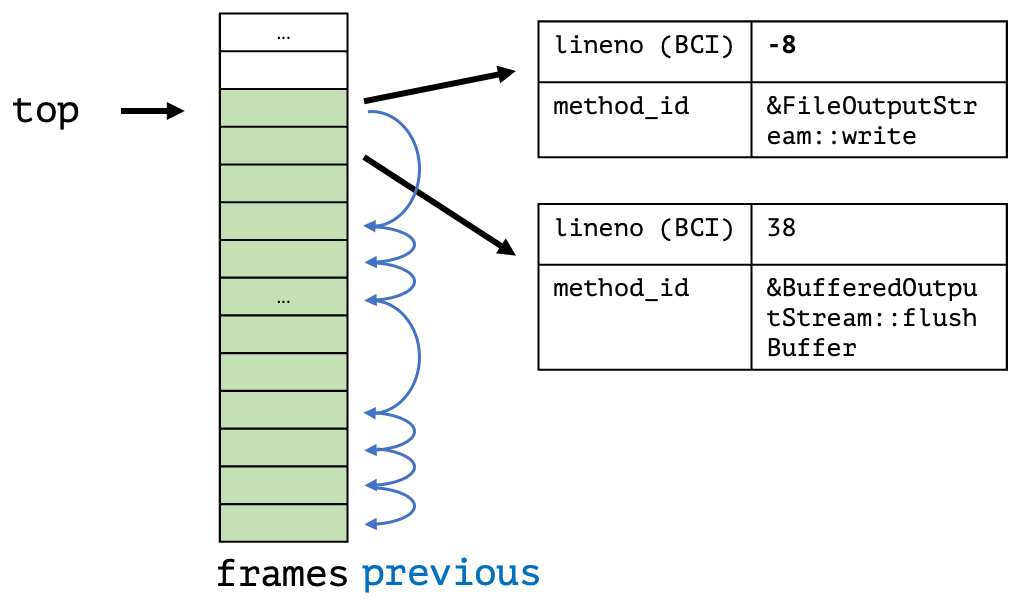
The passed argument is passed directly to the last parameter of the queue handler. Be aware of handling the case that the queue is full. Typically one falls back onto walking the stack in the signal handler or compressing the queue. The elements of a queue, including the arguments, can be obtained using the ASGST_GetQueueElement method:
// Returns the nth element in the queue (from the front),
// 0 gives you the first/oldest element.
// -1 gives you the youngest element, ..., -size the oldest.
//
// Modification of the returned element are allowed,
// as long as the queue's size has not been modified
// between the call to ASGST_GetQueueElement and the
// modification (e.g. by calling ASGST_ResizeQueue).
//
// Modifiying anything besides the arg field
// is highly discouraged.
//
// @returns null if n is out of bounds
//
// Signal safe
ASGST_QueueElement* ASGST_GetQueueElement(ASGST_Queue* queue,
  int n);
The critical detail is that modifying the arg field is supported; this allows us to do queue compression: In the signal handler, we obtain the last element in the queue using the ASGST_GetQueueElement method and then get the currently enqueuable element using ASGST_GetEnqueuableElement. We can then check whether both elements are equal and then update the argument, omitting to enqueue the current ucontext.
Another helper method is ASGST_ResizeQueue which can be used to set the queue size:
// Trigger the resizing of the queue at end of the next safepoint
// (or the current if currently processing one)
//
// Signal safe, but has to be called with a queue
// that belongs to the current thread
// Requires ASGST_REGISTER_QUEUE capability
void ASGST_ResizeQueue(ASGST_Queue* queue, int size);
The current queue size and more can be obtained using ASGST_QueueSizeInfo:
typedef struct {
  jint size; // size of the queue
  jint capacity; // capacity of the queue
  jint attempts; // attempts to enqueue since last safepoint end
} ASGST_QueueSizeInfo;

// Returns the number of elements in the queue, its capacity,
// and the number of attempts since finishing the previous
// safepoint
//
// Signal safe, but only proper values in queues thread
ASGST_QueueSizeInfo ASGST_GetQueueSizeInfo(ASGST_Queue* queue);
This returns the defined size/capacity, the current number of elements, and the number of enqueue attempts, including unsuccessful ones. This can be used in combination with ASGST_ResizeQueue to dynamically adjust the size of these queues.
One might want to remove a queue from a thread; this can be done using the non-signal safe method ASGST_DeregisterQueue.
Lastly, one might want to be triggered before and after a non-empty queue is processed:
// Handler that is called at a safe point with enqueued samples
// before and after processing
//
// called with the queue, a frame iterator, and the OnQueue
// argument frame iterator is null if offerIterator at handler
// registration was false
typedef void (*ASGST_OnQueueSafepointHandler)(ASGST_Queue*,
                                              ASGST_Iterator*,
                                              void*);

// Set the handler that is called at a safe point before
// the elements in the (non-empty) queue are processed.
//
// @param before handler or null to remove the handler
//
// Not signal safe, requires ASGST_REGISTER_QUEUE capability
void ASGST_SetOnQueueProcessingStart(ASGST_Queue* queue,
  int options, bool offerIterator,
  ASGST_OnQueueSafepointHandler before, void* arg);

// Set the handler that is called at a safe point after
// the elements in the (non-empty) queue are processed.
//
// @param after handler or null to remove the handler
//
// Not signal safe, requires ASGST_REGISTER_QUEUE capability
void ASGST_SetOnQueueProcessingEnd(ASGST_Queue* queue,
  int options, bool offerIterator,
  ASGST_OnQueueSafepointHandler end, void* arg);
This should enable performance optimizations, enabling the profiler to walk the whole stack, e.g., only once per queue processing safepoint.
This is the whole API that can be found in my OpenJDK fork with the profile2.h header. The current implementation is, of course, a prototype; there are, e.g., known inaccuracies with native (C to Java) frames on which I’m currently working.
But how can we use this API? I use the same profiler from the AsyncGetCallTrace Reworked: Frame by Frame with an Iterative Touch! blog post to demonstrate using the new API.
Implementing a Small Profiler
The best thing: The code gets more straightforward and uses locks to handle concurrency. Writing code that runs at safepoints is far easier than code in signal handlers; the new API moves complexity from the profiler into the JVM.
But first, you have to build and use my modified OpenJDK as before. This JDK has been tested on x86 and aarch64. The profiler API implementation is still a prototype and contains known errors, but it works well enough to build a small profiler. Feel free to review the code; I’m open to help, suggestions, or sample programs and tests.
To use this new API, you have to include the profile2.h header file, there might be some linker issues on Mac OS, so add -L$JAVA_HOME/lib/server -ljvm to your compiler options.
Now to the significant changes to the version that walks the stack in the signal handler written for the previous blog post. First, we have to register a queue into every thread; we do this in the ThreadStart JVMTI event handler and store the result in a thread-local queue variable:
thread_local ASGST_Queue* queue;
// ...
void JNICALL
OnThreadStart(jvmtiEnv *jvmti_env,
            JNIEnv* jni_env,
            jthread thread) {
  // the queue is large, but aren't doing any  compression,
  // so we need it
  queue = ASGST_RegisterQueue(jni_env, 10'000, 0, &asgstHandler,
    (void*)nullptr);
  // ...
}
We then have to enqueue the last Java frames into the queue in the signal handler:
static void signalHandler(int signo, siginfo_t* siginfo,
 void* ucontext) {
  totalTraces++;
  // queue has not been initialized
  if (queue == nullptr) {
    failedTraces++;
    return;
  }
  int res = ASGST_Enqueue(queue, ucontext, (void*)nullptr);
  if (res != 1) { // not Java trace
    failedTraces++;
    if (res == ASGST_ENQUEUE_FULL_QUEUE) {
      // we could do some compression here
      // but not in this example
      queueFullTraces++;
    }
  }
}
We record the total traces, the failed traces, and the number of times the queue had been full. The enqueued frames are processed using the asgstHandler method at every safepoint. This method obtains the current trace and stores it directly in the flame graph, acquiring the lock to prevent data races:
// we can acquire locks during safepoints
std::mutex nodeLock;
Node node{"main"};

void asgstHandler(ASGST_Iterator* iterator, void* queueArg,
 void* arg) {
  std::vector<std::string> names;
  ASGST_Frame frame;
  int count;
  for (count = 0; ASGST_NextFrame(iterator, &frame) == 1 &&
         count < MAX_DEPTH; count++) {
    names.push_back(methodToString(frame.method));
  }
  // lets use locks to deal with the concurrency
  std::lock_guard<std::mutex> lock{nodeLock};
  node.addTrace(names);
}
That’s all. I might write a blog post on compression in the future, as the queues tend to fill up in wall-clock mode for threads that wait in native.
You can find the complete code on GitHub; feel free to ask any yet unanswered questions. To use the profiler, just run it from the command line as before:
java -agentpath:libSmallProfiler.so=output=flames.html \
  -cp samples math.MathParser
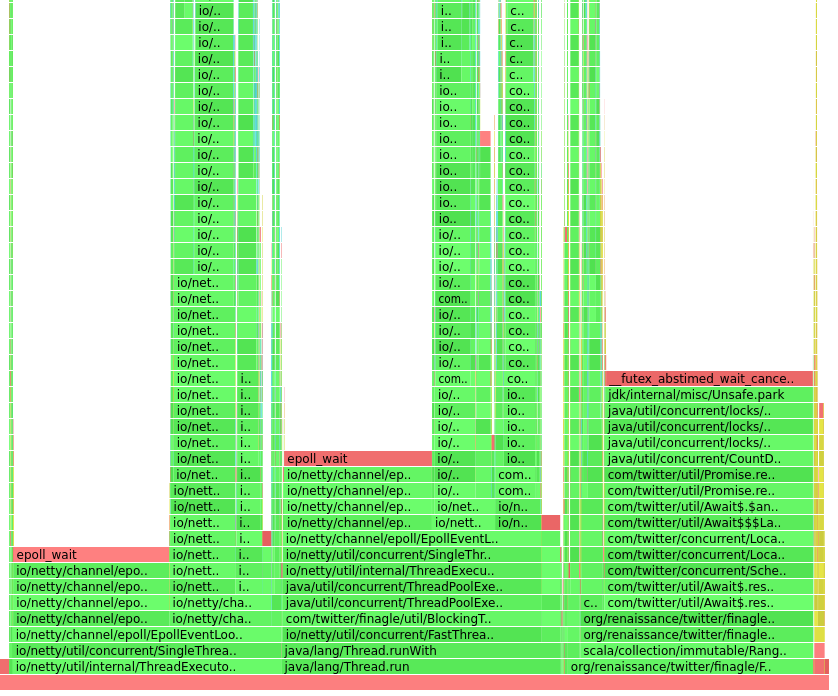
This assumes that you use the modified OpenJDK. MathParser is a demo program that generates and evaluates simple mathematical expressions. The resulting flame graph should look something like this:

Conclusion
The new API can be used to write profilers easier and walk stacks in a safe yet flexible manner. A prototypical implementation of the API showed accuracy comparable to AsyncGetCallTrace when we ignore the native frames. Using the queues offers ample opportunities for profile compression and incremental stack walking, only walking the new stacks for every queue element.
I want to come back to the quote from Erik that I wrote in the beginning, answering his concerns one by one:
Well the current proposal doesn’t have a clear story for
1) Making it safe
2) Working with virtual threads
3) Supporting incremental stack scanning
4) Supporting concurrent stack scanning
- Walking at Java frames at safepoints out of signal handlers makes the stack walking safer, and using improved method ids helps with the post-processing.
- Walking only at safepoints should make walking virtual threads possible; it is yet to be decided how to expose virtual threads in the API. But the current API is flexible enough to accommodate it.
- and 4. Stack watermarks allow profilers to implement incremental and concurrent stack walking, which should improve performance and offer the ability to compress stack traces—more on this in a future blog post.
Thank you for joining me on my API journey; I’m open to any suggestions; please reach me using the typical channels.
Just keep in mind:

This project is part of my work in the SapMachine team at SAP, making profiling easier for everyone. Thanks to Erik Österlund for the basic idea, and to Jaroslav Bachorik for all the feedback and help on the JEP.