Writing a Profiler from Scratch: Introduction

Async-profiler is undoubtedly one of the most used open-source Java profilers out there. Its most commonly used feature is sampling a given Java program’s stack traces and visualizing them as a flame graph. I would recommend reading the excellent async-profiler manual by Krzysztof Ślusarski or taking a look at my profiling playlist on YouTube if you’re new to this tool. After using the async-profiler for a while, you might wonder: How does this tool work? And, of course, if you’re someone like me: Could I write a stripped-down version to learn how it really works? I did this a few years back in university when I wanted to understand how LR(1) parser generators work: Turns out it is a lot of work, but my parser generator can output GIFs.

This blog series will take you with me on this journey, where we start with a small tool and see where curiosity leads us. It’s helpful if you know some C/C++ and have profiled Java using async-profiler before, which helps you better understand my code snippets and the profiling Jargon.

All the code will present on GitHub, and I’m happy for any suggestions, bug reports, and comments either under this blog post or on GitHub.

The aim of this series is

  • to understand how a sampling profiler works
  • to write a simple profiler, and possibly related tools, based on the AsyncGetCallTrace API
  • to have some good tooling which I use in OpenJDK tests, to make the used APIs safer and more reliable

The aim is not to write anything vaguely production ready: async-profiler has too many features to count and is battle-tested.

Come with me on this journey of knowledge, starting with a simple tool that just counts how many times AsyncGetCallTrace could not trace the stack.

The fundamental API that we will be relying on is the AsyncGetCallTrace API of the OpenJDK: This API can be used to obtain the stack trace (which methods are on the stack) for a given thread at any time. This makes it quite useful for writing accurate profilers. The API was introduced in November 2002 for Sun Studio. However, Sun removed it in January 2003 and demoted it to an internal API, but most profiling applications still use it. The following part of this post is inspired by Nitsan Wakart’s post, The Pros and Cons of AsyncGetCallTrace Profilers.

The AsyncGetCallTrace API is defined in the forte.cpp file:

typedef struct {
  jint lineno;         // BCI in the source file, or < 0 for native methods
  jmethodID method_id; // method executed in this frame
} ASGCT_CallFrame;

typedef struct {
  JNIEnv *env_id;   // Env where trace was recorded
  jint num_frames;  // number of frames in this trace, < 0 gives us an error code
  ASGCT_CallFrame *frames; // recorded frames 
} ASGCT_CallTrace; 

void AsyncGetCallTrace(ASGCT_CallTrace *trace, // pre-allocated trace to fill
                       jint depth,             // max number of frames to walk
                       void* ucontext);        // signal context

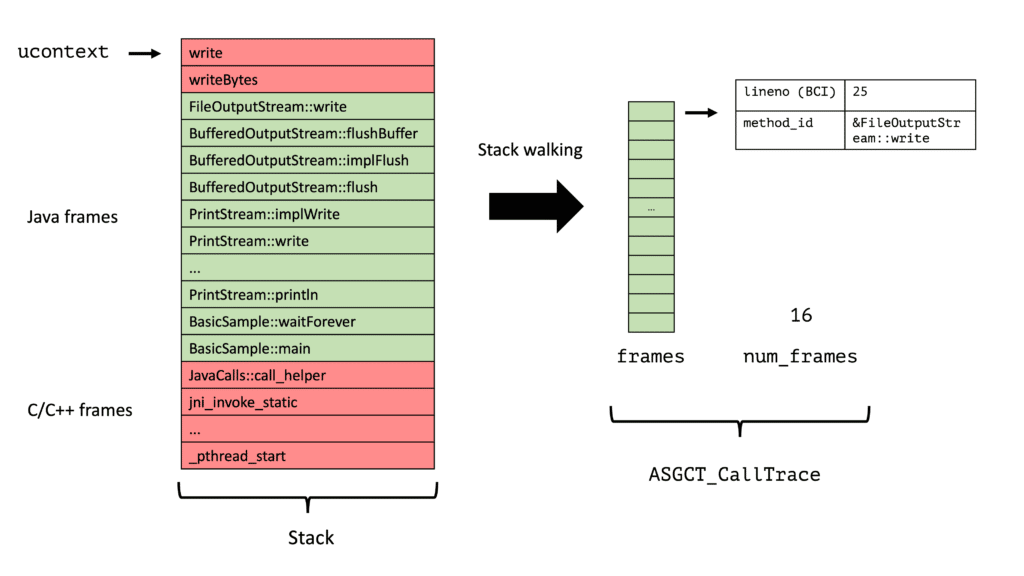
One typically uses this API by pinging a thread using a signal, stopping the thread, and invoking the signal handler, which in turn calls AsyncGetCallTrace with the execution context of the stopped thread (the ucontext) so that AsyncGetCallTrace can walk the thread, skipping all C/C++ frames on the stack and only storing the native (from native methods) and Java frames in the frames array. The signal handler has to process the trace, but this is for another post. We will just store the number of times that AsyncGetCallTrace was successful and unsuccessful.

Be aware that we cannot allocate any memory outside the stack in a signal handler. For this reason, we have to preallocate the data structures for AsyncGetCallTrace. There are a few C library functions that are guaranteed to be signal safe. To learn more about signals, consider reading Introduction To Unix Signals Programming, or similar sources. But don’t be confused with the terms thread and process. In Unix (Mac OS, Linux, BSD), threads are processes that share the same address space. Every (non-virtual/Loom) thread in Java is backed by an OS thread.

As an example of calling AsyncGetCallTrace, consider profiling the following Java code:

public class BasicSample {

    public void waitForever() throws InterruptedException {
        System.out.print("Waiting forever...");
        for (int i = 0; i < 100; i++) {
            Thread.sleep(10);
            System.out.print(".");
        }
        System.out.println("done");
    }

    public static void main(String[] args) throws InterruptedException {
        new BasicSample().waitForever();
    }
}

During profiling, we call AsyncGetCallTrace often, but let’s visualize a trace when the JVM runs one of the println lines.

AsyncGetCallTrace on a small example, using the demo code for JEP 435

Interrupting a thread at any point and running some code can have stability implications. If you’re interested in these when using AsyncGetCallTrace, head over to the async-profiler manual, where I co-wrote the section on this topic. This small sample tool seems to be quite good at triggering a specific fault in JDK 19+36, run the tool of this blog post yourself to find it.

The signal handler in our small example is the following:

std::atomic<size_t> failedTraces = 0;
std::atomic<size_t> totalTraces = 0;

static void signalHandler(int signo, siginfo_t* siginfo, void* ucontext) {
  const int MAX_DEPTH = 512; // max number of frames to capture
  static ASGCT_CallFrame frames[MAX_DEPTH];
  ASGCT_CallTrace trace;
  trace.frames = frames;
  trace.num_frames = 0;
  trace.env_id = env; // we obtained this via the OnVMInit hook
  
  // call AsyncGetCallTrace
  asgct(&trace, MAX_DEPTH, ucontext);

  // process the results
  totalTraces++;
  if (trace.num_frames < 0) {
    failedTraces++;
  }
}

We use atomic variables here to increment the two counting variables in parallel. We cannot use any locks as creating locks is not signal-safe.

You see in line 13 that we cannot call AsyncGetCallTrace directly, as it is not exported in any JVM header. So we have to obtain the pointer to this function via dlsym at the beginning, which is a bit brittle:

static void initASGCT() {
  asgct = reinterpret_cast<ASGCTType>(dlsym(RTLD_DEFAULT, "AsyncGetCallTrace"));
  if (asgct == NULL) {
    fprintf(stderr, "=== ASGCT not found ===\n");
    exit(1);
  }
}

Additionally, we have to copy the declarations for ASGCT_CallFrame, ASGCT_CallTrace, and AsyncGetCallTrace into our project.

After writing a signal handler, we must use some mechanism to create signals. There are multiple ways, like perf or using a thread that signals all threads every few milliseconds, but we’ll use the most straightforward option which is a timer:

static bool startITimerSampler() {
  time_t sec = interval_ns / 1000000000;
  suseconds_t usec = (interval_ns % 1000000000) / 1000;
  struct itimerval tv = {{sec, usec}, {sec, usec}};

  // ...

  if (setitimer(ITIMER_PROF, &tv, NULL) != 0) {
    return false;
  }
  return true;
}

Our code uses the timers in PROF mode: “A profiling timer that counts both processor time used by the process, and processor time spent in system calls on behalf of the process. This timer sends a SIGPROF signal to the process when it expires.” (see gnu.org) The result is roughly similar to the CPU event of the async-profiler. It is inaccurate, but we’ll tackle this problem in another blog post.

You can find the final code in the GitHub repo as libSmallProfiler.cpp. It includes all the boiler-plate code for JVMTI agents that I omitted in this blog post for brevity. Feel free to file issues or PRs with improvements or suggestions there. When we finally run the tool with a JVM and the example Java program, we get the following output via java -agentpath:cpp/libSmallProfiler.dylib=interval=0.001s -cp samples BasicSample:

Waiting forever.......................................................................................................done
Failed traces:          5
Total traces:          15
Failed ratio:       33.33%

This tool might seem to be rather useless, but one can adjust its sampling interval by specifying the interval option: This makes it quite helpful in testing the stack walking code of AsyncGetCallTrace.

I hope I didn’t frighten you too much with all this Unix C, and hopefully see you again in around two weeks for my next blog post in which we create a tool that outputs a method list.

The code of this blog post is based on the libAsyncGetCallTraceTest.cpp and the libAsyncGetStackTraceSampler.cpp of the OpenJDK. This blog series is part of my work in the SapMachine team at SAP, making profiling easier for everyone.

JFR Event Collection

Ever wondered what all the JDK Flight Recorder events are, in which JDK versions they are supported and what example of an event looks like? Wonder no more, I created the JFR Event Collection website which contains all this and more.

Screenshot of https://sapmachine.io/jfrevents

This site gives you an up-to-date collection of all OpenJDK JFR events for every JDK since 11, giving you the following additional information:

  • configuration properties
  • fields with their types and description
  • examples from a renaissance benchmark run
  • with which GC this event appears
  • additional descriptions collected by JFR users

The idea for this website came during the development of my prototypical JFR UI:

Screenshot of JFR events viewer

To improve this UI I needed to know more about the JFR events emitted by current JDKs. So I turned to the jfr/metadata.xml in the JDK source code:

...
<Event name="JavaMonitorEnter" category="Java Application" 
  label="Java Monitor Blocked" thread="true" stackTrace="true">
    <Field type="Class" name="monitorClass" label="Monitor Class" />
    <Field type="Thread" name="previousOwner" label="Previous Monitor Owner" />
    <Field type="ulong" contentType="address" name="address" 
      label="Monitor Address" relation="JavaMonitorAddress" />
</Event>
...

It specifies most events and gives you enough information in a rather concise format. But the events that are defined in the JFR source code as Java code are missing, so I turned to the website of BestSolution which shows all events:

Screenshot of https://bestsolution-at.github.io/jfr-doc/openjdk-18.html

The problem is that it is not up-to-date (it is only available up to JDK 18), its generation seems to require every JDK version to be installed, which is a major hassle for automatization, and it does not include any examples and information on configurations.

I found example data in a repository by Petr Bouda called jfr-playground, but it is patchy and not yet integrated into a website.

So when I saw a few weeks back in the foojay Slack channel that Chris Newland is working on his VM Options Explorer, I approached him with my idea for a new website. Our discussion lead to him creating his prototypical JFR Events website:

Screenshot of https://www.chriswhocodes.com/jfr_jdk20.html

His website is still an early prototype but uses the same data set as mine. This shows that this dataset can be used for different websites and might later be used for my prototypical JFR UI too.

The project behind the website consists of two subprojects the website generator and the data source with an event collector.

The data on JFR events (fields, examples, JDK versions, …) is collected by the jfreventcollector extending the jfr/metadata.xml file, so that it contains the events defined in the JDK source code and all the other information shown on the website. The extended files are published in the release section of the subproject and as a maven package with model classes for the XML elements. This is completely automated and only needs a current JDK installed.

Just add a dependency to the jfreventcollectionartifact:

<dependency>
    <groupId>me.bechberger</groupId>
    <artifactId>jfreventcollection</artifactId>
    <version>0.2</version>
</dependency>

Even the extended metadata file alone is useful:

...
<Event name="JavaMonitorEnter" label="Java Monitor Blocked"
  category="Java Application" experimental="false" thread="true"
  stackTrace="true" internal="false" throttle="false"
  cutoff="false" enabled="true" jdks="" startTime="true">
    <Field type="Class" name="monitorClass" label="Monitor Class" 
      struct="false" experimental="false" array="false" jdks=""/>
    <Field type="Thread" name="previousOwner" label="Previous Monitor Owner"
      struct="false" experimental="false" array="false" jdks=""/>
    <Field type="ulong" name="address" label="Monitor Address"
      relation="JavaMonitorAddress" contentType="address" struct="false"
      experimental="false" array="false" jdks=""/>
    <Configuration id="0" jdks="">
        <Setting name="enabled" jdks="">true</Setting>
        <Setting name="stackTrace" jdks="">true</Setting>
        <Setting name="threshold" control="locking-threshold" jdks="">20 ms</Setting>
    </Configuration>
...
</Event>
...

The website is generated by jfrevents-site-generator with depends on the data published by the collector and creates a Twitter Bootstrap based static HTML page using Kotlin and mustache templates. The generated website is then deployed to sapmachine.io.

This website is hopefully helpful to all JFR users and Java profiling tool developers out there, the extended metadata being a good starting point for similar websites and tools which need metadata on JFR events.

Issues and pull requests are always welcome in both GitHub projects.

This project is part of my work in the SapMachine team at SAP, making profiling easier for everyone. Thanks to Chris Newland, Matthias Baesken, and Ralf Schmelter for their help.

AP-Loader: A new way to use and embed async-profiler

Using async-profiler can be quite a hassle. First, you have to download the right archive from GitHub for your OS and architecture, then you have to unpack it and place it somewhere. Or you get it from your OS distribution, hoping that it is the current version. It gets worse if you want to embed it into your library, agent, or application: Library developers cannot just use maven dependency but have to create wrapper code and build scripts that deal with packaging the binaries themselves, or worse they depend on a preinstalled version which they do not control.

java -jar ap-loader.jar profiler …; java -jar ap-loader.jar converter jfr2flame flight.jfr flame.html

I started the AP-Loader project to fix all this:

  • Want to run async-profiler? Just grab the latest loader JAR from GitHub, and run java -jar ap-loader-all.jar profiler regardless of your OS or architecture
  • Want to use the async-profiler as a Java Agent? You can use the loader JAR as javaagent and it behaves like the native async-profiler agent
  • Want to use jattach? java -jar ap-loader-all.jar jattach is your friend
  • Wondering what version of async-profiler you’re using? java -jar ap-loader-all.jar version has you covered
  • Want to use the converter to convert between formats? Just use java -jar ap-loader-all.jar converter
  • Want to use async-profiler in your library? Just add a dependency to the me.bechberger.ap-loader:-all-SNAPSHOT from the Sonatype OSS repository and use one.profiler.AsyncProfilerLoader.load()
  • Want to use the converter too? All the converter classes are included in the JAR, look no further than the one.profiler.converter package
  • Just want all this for one platform only? I build and package versions for all platforms. There can be multiple platform versions on the classpath
  • But what about the JAR size? It’s just under 800KB, so no worries

This project uses original binaries from async-profiler’s GitHub releases page and tests the resulting project using the original tests from async-profiler, so you can expect it to behave as async-profiler does. The idea for this project came up in a discussion with the creator of async-profiler, Andrei Pangin, in spring.

I use this project daily to profile my applications, so might you? I’m open to suggestions, bug reports and happy help to integrate ap-loader into your open-source library.

If I enticed you: Go over to GitHub to get more detailed information on this project.

This project is part of my work in the SapMachine team at SAP, making profiling easier for everyone. I built it to integrate async-profiler into more applications and libraries, like my upcoming profiler UI.

Overview of Java Profiling

When I ask Java developers whether they do profile, the answer is usually “no”. The few that profiled before usually used VisualVM as a student and maybe JProfiler or YourKit years ago at work. One of the reasons for this is a lack of available information and thus knowledge for everyday Java developers.

This is a pity as profiling should be a part of the tool belt for every experienced developer (not just for Java). The problem is that most of the open-source profilers are targeted to the OpenJDK developers (or their colleagues), even if they won’t admit it. This can be seen in the lack of entry-level material on this topic and even the little that is out there is distributed across multiple conference websites, blogs, YouTube channels, and Twitter accounts.

A few months ago I started working on this topic and as a result, held a talk at the Java User Group Karlsruhe in the middle of October: It is an introductory talk answering the simple questions: Why should we profile? Which profilers to use? How to obtain and view these profiles? A recording can be seen on YouTube:

The gist of this talk is:

  • Why? Profiling helps you find the parts of your code that are slow and that are worth to be fixed.
  • Which and how? The consensus seems to be to use JFR or async-profiler with –jfrsync and JMC as a profile viewer.

While working on this talk, I collected a list of interesting conference talks on this topic:

This list includes talks on a variety of profilers, ranging from deep dives to overviews. Many of these talks and people were recommended elsewhere on the internet, on blogs, on Twitter, or in private conversations. Which I present in the following.

Continue reading