Mastering the Art of Controlling the JIT: Unlocking Reproducible Profiler Tests

In my last blog post, I hinted Using Async-Profiler and Jattach Programmatically with AP-Loader, that I’m currently working on a test library for writing better profiling API tests. The library is still work-in-progress, but it already allows you to write profiling API tests in plain Java:

private int innerASGCT2() {
    new Tracer().runASGCT().assertTrue(
        Frame.hasMethod(0, "innerASGCT2", "()I"), 
        Frame.hasMethod(1, "testRunASGCT2"));
    return 0;
}

@Test
public void testRunASGCT2() {
    innerASGCT2();
}

This test case checks that calling AsyncGetCallTrace gives the correct result in this specific example. The test library allows you to write tests comparing the returns of multiple GetStackTrace, AsyncGetCallTrace, and AsyncGetStackTrace invocations in different modes and settings. The library can be found as trace-tester on GitHub; I aim to bring it into the OpenJDK later with my JEP.

Writing small test cases this way is great, but it would be even better if we could force specific methods to be compiled, interpreted, or inlined so that we can test different scenarios. The proposed AsyncGetStackTrace will return the compilation level directly for every frame, so it is necessary to check the correctness of the level too.

Consider reading my Validating Java Profiling APIs post to get a different angle on profiling API testing.

Introduction

Before I start with discussing the ways you can force methods to be compiled, interpreted, or inlined, I’ll have to clarify that:

  1. The following only works with the HotSpot tired JIT compiler and not other JVM’s like OpenJ9 (see issue #11272)
  2. It should only be used for testing. I would refrain from using it anywhere near production, even if you know that specific methods should be compiled. Use a tool like JITWatch by Chris Newland to check whether the JVM doesn’t make the correct decisions automatically: Ask your fellow JVM expert how to deal with this.
  3. I’m not an expert in the APIs I’m showing you, nor in tiered compilation, so be aware that I might be missing something, but I’m happy for any suggestions and corrections.
  4. There are four different compilation levels, but I’m subsuming all C1 variants under the C1 label because some of my used techniques only work on the C1/C2/inlined level. You can read more on tiered compilation in articles like Tiered Compilation in JVM on Baeldung.

Now that I finished the obligatory disclaimer: What are the stages in the life of a method with a tiered JIT?

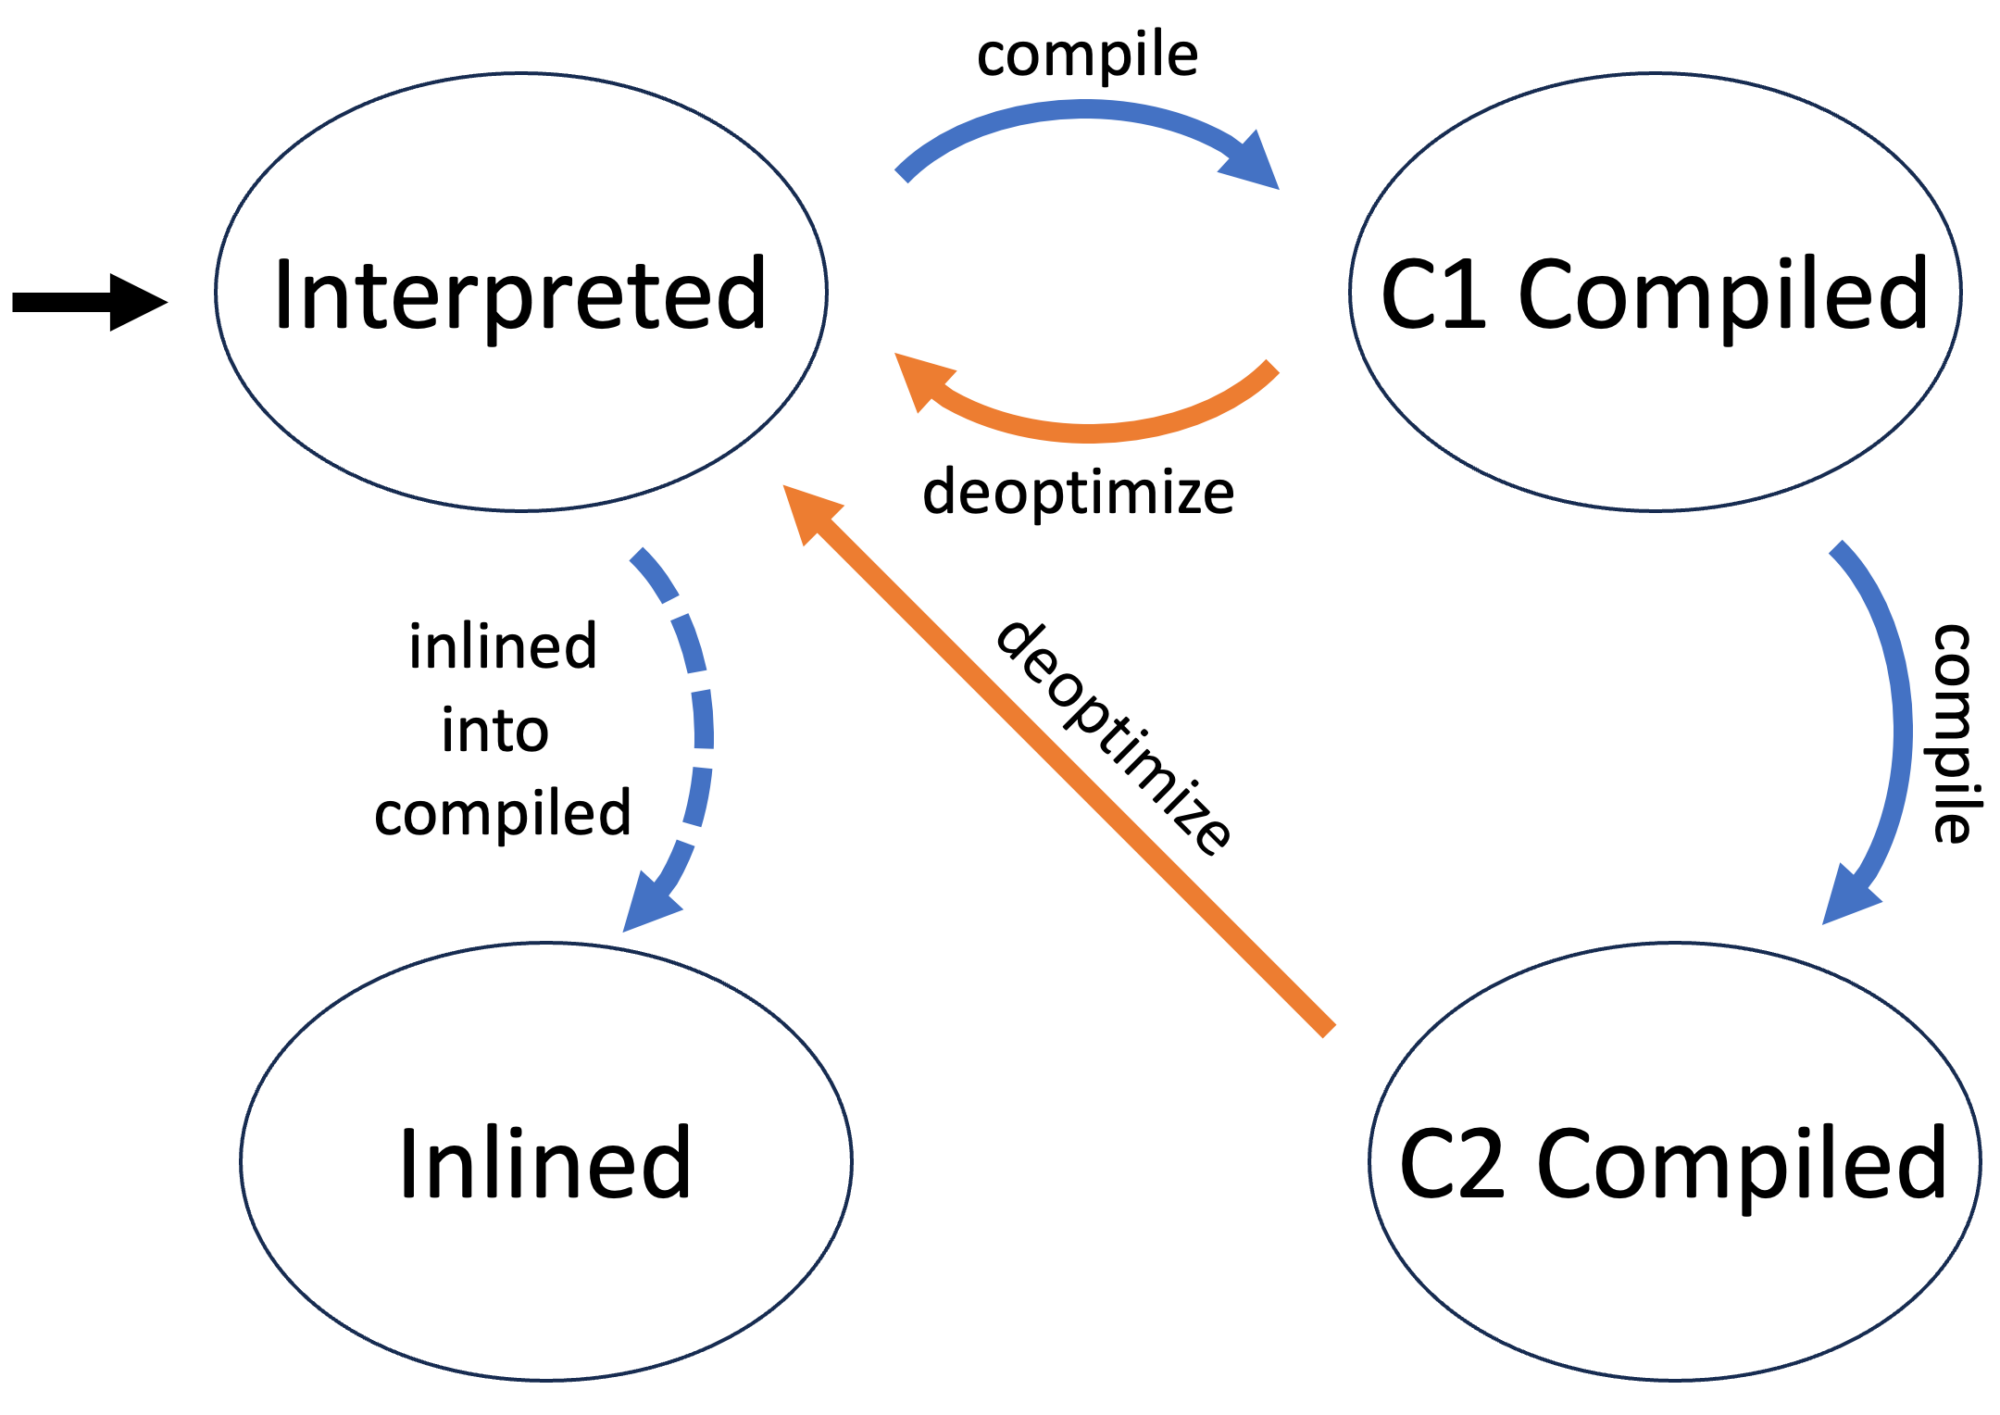
The first time the JVM executes a method, the method’s byte code is interpreted without compilation. This allows the JVM to gather information on the method, as C1 and C2 are profile guided.

The method is then compiled when the JVM deems this to be beneficial, usually after the method has been executed a few times. The next call of the method will then use the compiled version. The method is initially compiled with different levels of the C1 compiler before finally being C2 compiled, which takes the longest but produces the best native instructions.

The JVM might decide at any point to use the interpreted version of a method by deoptimizing it. The compiled versions are kept, depending on the compiler and the reasons for the deoptimization.

Every compiler can decide to inline called methods of a currently compiled method. A compiler uses the initial byte code for this purpose.

What we want and what we get

The ideal would be to tell the JVM to just use a method in its compiled version, e.g.:

But this is not possible, as the JVM does not have any information it needs for compilation before the first execution of a method. We, therefore, have first to execute the method (or the benchmark) and then set the compilation level:

How do we get it?

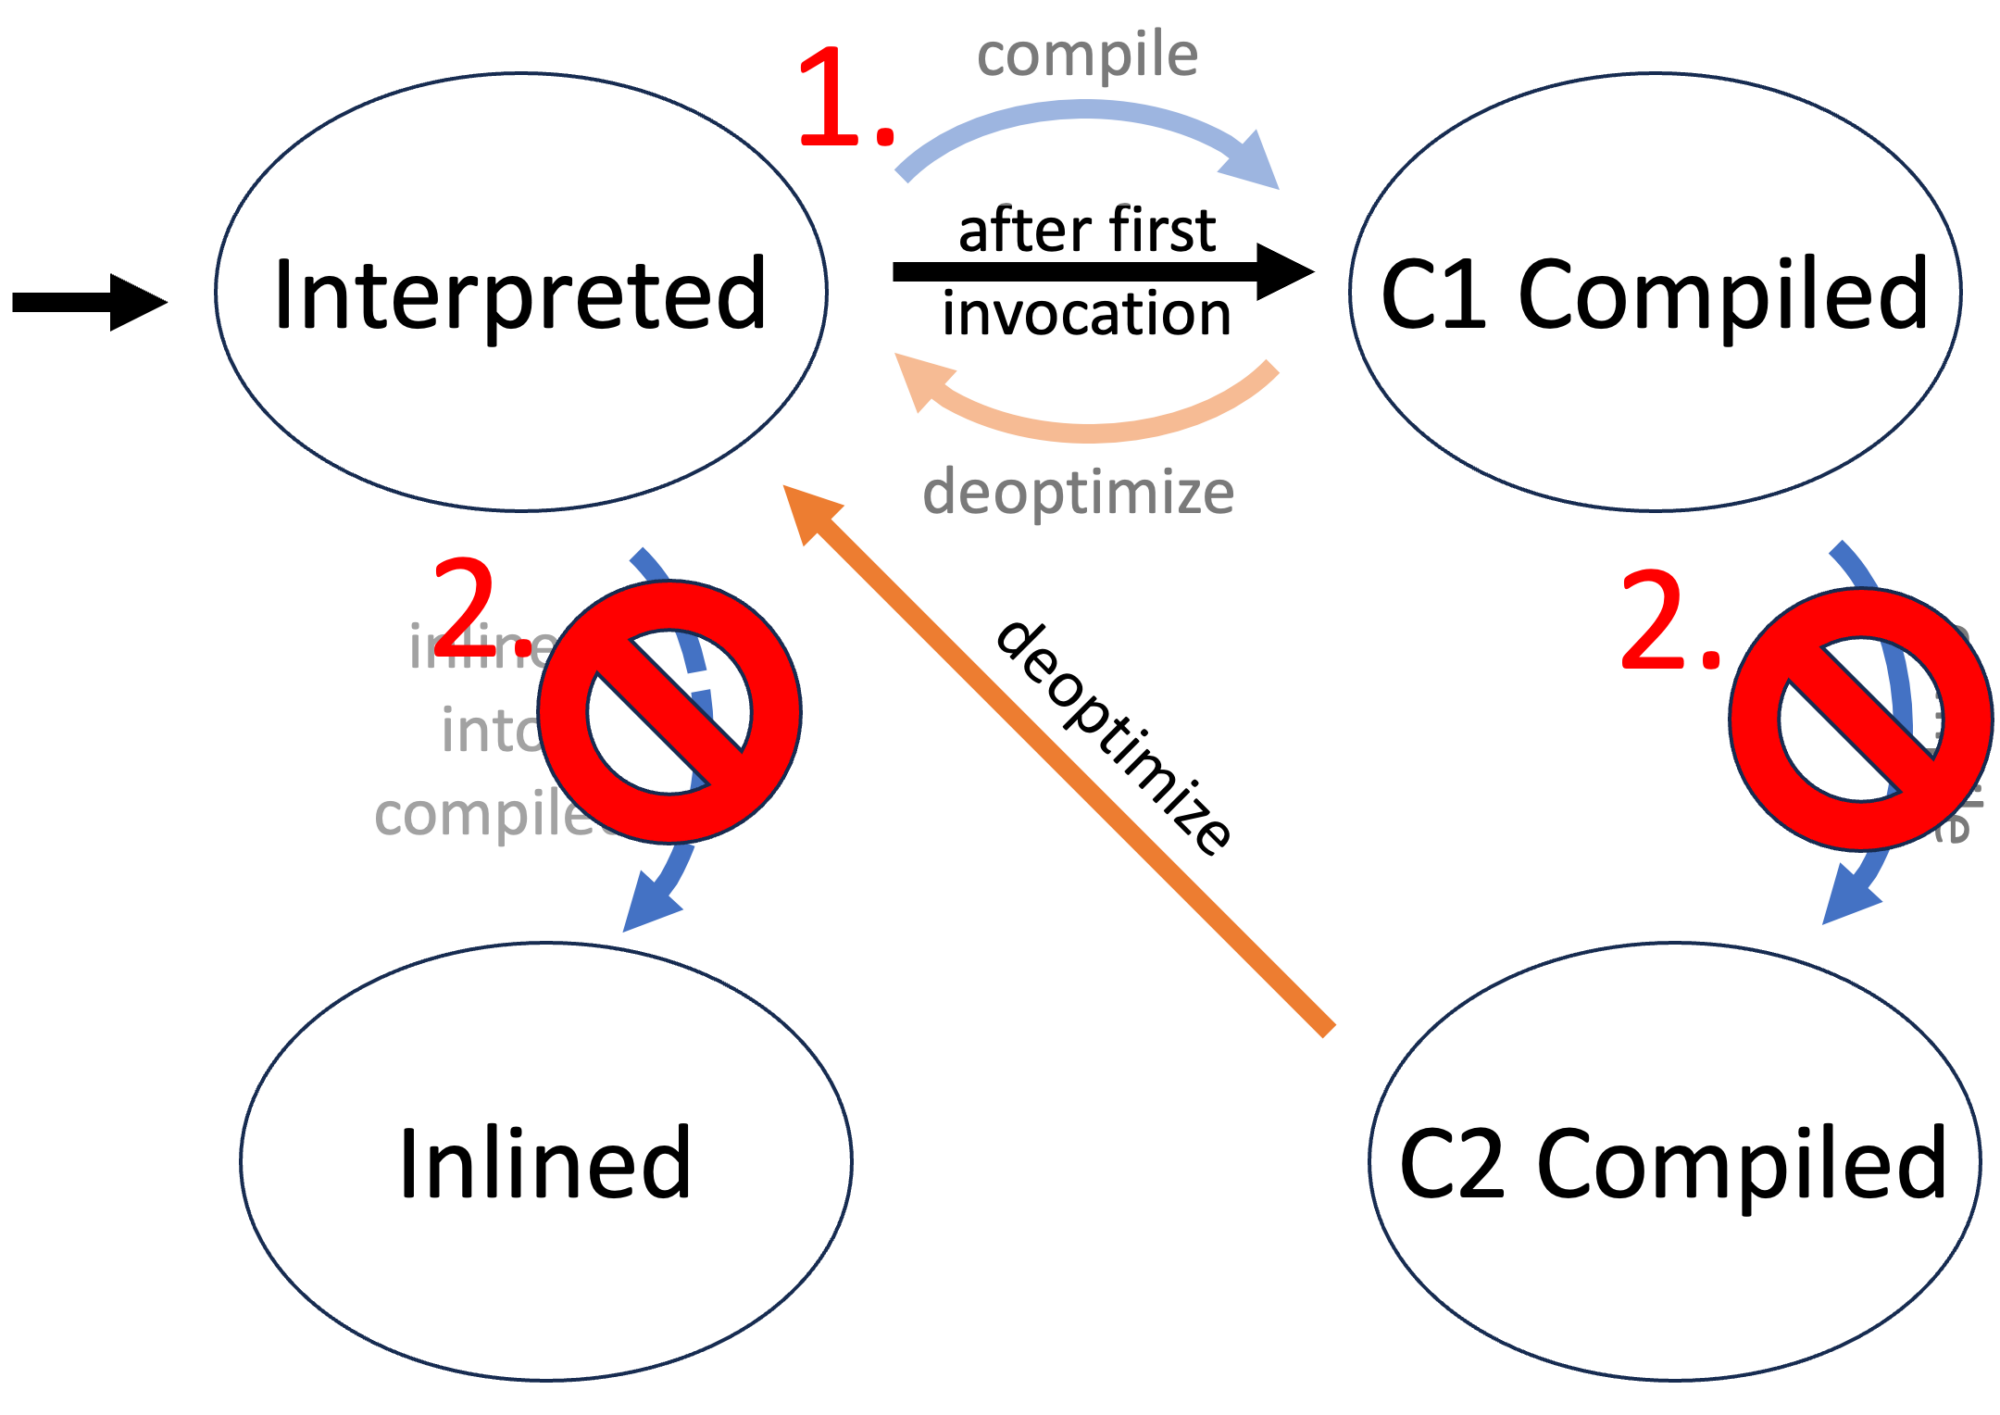
We can split the task of forcing a method to be compiled (or inlined, for that matter) into two parts:

  1. Force all methods into their respective state (→ WhiteBox API) after the initial execution.
  2. Force the JIT to never compile a method with a different compiler (→ Compiler Control)

The following is the modified state diagram when forcing a method to be C1 compiled:

In the following, I’ll discuss how to use both the WhiteBox API and Compiler Control to facilitate the wanted behavior.

WhiteBox API

Many JVM tests are written in the JTreg framework, allowing developers to write these tests in Java. But these tests often require specific functionality not regularly available to Java developers. This functionality is exported in the WhiteBox API:

One of the not so well-known tools of the HotSpot VM is its WhiteBox testing API. Introduced in Java 7 it has been significantly improved and extended in Java 8 and 9. It can be used to query or change HotSpot internals which are not otherwise exposed to Java-land. While its features make it an indispensable tool for writing good HotSpot regression tests, it can also be used for experiments or for the mere fun of peeking into the VM. This entry will focus on the usage of the WhiteBox API in Java 8 and 9.

The WhiteBox API is implemented as a Java class (called sun.hotspot.WhiteBox) which defines various entry points into the HotSpot VM. Most of the functionality is implemented natively, directly in the HotSpot VM. The API is implemented as a singleton which can be easily retrieved by calling the static method WhiteBox.getWhiteBox().

Unfortunately, currently even a simple JavaDoc documentation of the API doesn’t exist, so in order to make full use of its functionality, you’ll have to peek right into WhiteBox.java.

The WhiteBox testing API

This API can be used outside of JTreg tests after enabling it by passing -Xbootclasspath/a:wb.jar -XX:+UnlockDiagnosticVMOptions -XX:+WhiteBoxAPI as JVM arguments. To use it, you have to build the WhiteBox JAR from scratch for your specific JVM by calling make build-test-lib (after you set up the build via the configure script).

But please be aware that using this API outside of JVM tests is relatively rare, and the documentation is still non-existent, so using it entails reading a lot of JDK sources and experimentation.

The build target did not work in JDK 21, and when I fixed it, the first question in the PR was by Daniel Jelinski, who asked:

That’s interesting. How did you find this? Is the result of this target used anywhere?
As far as I could tell, the build-test-lib target itself is not used anywhere. The classes that fail to compile here are used by tests without any problems – each test specifies the necessary imports individually. Should we remove this make target instead?

8307732: build-test-lib is broken #13885

So it would be best if you certainly did not depend on it.

The WhiteBox API consists of the singleton class jdk.test.whitebox.WhiteBox which offers many methods: From GC related methods like boolean isObjectInOldGen(Object o) and void fullGC() to NMT-related methods like long NMTMalloc(long size) and JIT-related methods like void deoptimizeAll().

You can even use it to force the compilation of a method and to set JVM flags, as shown in this example by Jean-Philippe Bempel:

public class WhiteBoxTest {
    static WhiteBox wb = WhiteBox.getWhiteBox();

    private void m() {
        System.out.println("foo");
    }

    public static void main(String[] args) throws Exception {
        wb.setBooleanVMFlag("PrintCompilation", true);
        wb.setBooleanVMFlag("BackgroundCompilation", false);
        wb.enqueueMethodForCompilation(
          WhiteBoxTest.class.getDeclaredMethod("m", null), 4);
    }
}

This is from his blog post WhiteBox API, the only blog post I could find on this topic.

Back to our goal of forcing the compilation of a method. It is a good idea to reset the state of a method and deoptimize it to start from a blank slate:

// obtain a method reference
Executable m = X.class.getDeclaredMethod("m", null);
// obtain a WhiteBox instance
WhiteBox wb = WhiteBox.getWhiteBox();
// deooptimize the method
wb.deoptimizeMethod(m);
// clear its state, found by experimentation to be neccessary
wb.clearMethodState(m);

We can then either leave the method uncompiled (for compilation level 0) or enqueue for compilation:

// level 1 - 3: C1, level 4: C2
wb.enqueueMethodForCompilation(m, level);

But be aware that it takes some time to actually compile the method, so it’s best to wait till it is compiled:

while (wb.getMethodCompilationLevel(m) != level) {
    Thread.sleep(1);
}

We can then also force a method to be never inlined:

wb.testSetDontInlineMethod(m, true);
wb.testSetForceInlineMethod(m, false);

Or inversely to be always inlined:

wb.testSetDontInlineMethod(m, false);
wb.testSetForceInlineMethod(m, true);

I implemented this in the WhiteBoxUtil class in my trace-tester library. This allows us to force all methods in their respective states. But the JVM can still decide to optimize further or inline a method, even when specifying the contrary. So we have to force the JVM using the second the Compiler Control specifications.

Compiler Control

This control mechanism has been introduced in Java 9 with JEP 165 by Nils Eliasson:

Summary

This JEP proposes an improved way to control the JVM compilers. It enables runtime manageable, method dependent compiler flags. (Immutable for the duration of a compilation.)

Goals

  • Fine-grained and method-context dependent control of the JVM compilers (C1 and C2)
  • The ability to change the JVM compiler control options in run time
  • No performance degradation

Motivation

Method-context dependent control of the compilation process is a powerful tool for writing small contained JVM compiler tests that can be run without restarting the entire JVM. It is also very useful for creating workarounds for bugs in the JVM compilers. A good encapsulation of the compiler options is also good hygiene.

JEP 165

This mechanism is properly standardized for the OpenJDK, unlike the WhiteBox APi. The compiler control allows to specify compilation settings by defining them in a JSON file and applying them:

  • Using jcmd (see JEP): jcmd <pid> Compiler.add_directives <file>
  • Passing it via JVM arguments: -XX:+UnlockDiagnosticVMOptions -XX:CompilerDirectivesFile=<file>
  • Using the WhiteBox API: int addCompilerDirective(String compDirect)

The following directives specify as an example that the method m should not be C2 compiled and not be inlined:

[
  {
    // can also contain patterns
    "match": ["X::m()"],
    // "-" prefixes not inlined, "+" inlined methods
    "inline": ["-X::m()"],
    "C1": {},
    "C2": {
      "Exclude": true
    }
  }
  // multiple directives supported
  // first directives have priority
]

This, in theory, allows the method to be deoptimized, but this did not happen during my testing. With forced compilation, one can assume that this method will almost be used in its compiled form.

I recommend this Compiler Control guide for a more in-depth guide with all options. An implementation of the control file generation with a fluent API can be found in the trace-tester project in the CompilerDirectives class. Feel free to adapt this for your own projects.

Conclusion

I’ve shown you in this article how to control the JIT to specify the inlining and compilation of methods using two lesser-known JVM APIs. This allows us to write reproducible profiling APIs and makes it easier to check how a profiling API reacts to different scenarios.

If you have any suggestions, feel free to reach out. I look forward to preparing slides for my upcoming talks in Milan, Munich, Arnhem, and Karlsruhe. Feel free to come to my talks; more information soon on Twitter.

This project is part of my work in the SapMachine team at SAP, making profiling easier for everyone.

Using Async-Profiler and Jattach Programmatically with AP-Loader

Using async-profiler and jattach can be quite a hassle. First, you have to download the proper archive from GitHub for your OS and architecture; then, you have to unpack it and place it somewhere. It gets worse if you want to embed it into your library, agent, or application: Library developers cannot just use maven dependency but have to create wrapper code and build scripts that deal with packaging the binaries themselves, or worse, they depend on a preinstalled version which they do not control.

In November 2022, I started the ap-loader project to remedy this situation: I wrapped async-profiler and jattach in a platform-independent JAR which can be pulled from maven central. I already wrote a blog post on its essential features: AP-Loader: A new way to use and embed async-profiler.

Flamegraph for a recording of profiling data for the dacapo benchmark suite

In this blog post, I’m focusing on its programmatic usage: Async-profiler can be used in a library to gather profiling data of the current or a different process, but the profiler distribution contains more: It contains converters to convert from JFR to flamegraphs, and jattach to attach a native agent dynamically to (potentially the current) JVM and send commands to it.

This blog post does assume that you’re familiar with the basic usage of async-profiler. If you are not, consider reading the async-profiler README or the Async-profiler – manual by use cases by Krzysztof Ślusarski.

The ap-loader library allows you to depend on a specific version of async-profiler using gradle or maven:

<dependency>
    <groupId>me.bechberger</groupId>
    <artifactId>ap-loader-all</artifactId>
    <version>2.9-5</version>
</dependency>

There are multiple maven artifacts: ap-loader-all which contains the native libraries for all platforms for which async-profiler has pre-built libraries and artifacts that only support a single platform like ap-loader-macos. I recommend using the ap-loader-all if you don’t know what you’re doing, the current release is still tiny, with 825KB.

The version number consists of the async-profiler version and the version (here 2.9) of the ap-loader support libraries (here 5). I’m typically only publishing the newest ap-loader version for the latest async-profiler. The changes in ap-loader are relatively minimal, and I keep the API stable between versions.

The ap-loader library consists of multiple parts:

  • AsyncProfilerLoader class: Wraps async-profiler and jattach, adding a few helper methods
  • converter package: Contains all classes from the async-profiler converter JAR and helps to convert between multiple formats
  • AsyncProfiler class: API for async-profiler itself, wrapping the native library.

All but the AsyncProfilerLoader class is just copied from the underlying async-profiler release. ap-loader contains all Java classes from async-profiler, but I omit the helper classes here for brevity.

AsyncProfilerLoader

This is the main entry point to ap-loader; it lives in the one.profiler package like the AsyncProfiler class. Probably the most essential method is load:

Load

The load method loads the included async-profiler library for the current platform:

AsyncProfiler profiler = AsyncProfilerLoader.load();

It returns the instantiated API wrapper class. The method throws an IllegalStateException if the present ap-loader dependencies do not support the platform and an IOException if loading the library resulted in other problems.

Newer versions of the AsyncProfiler API contain the AsyncProfiler#getInstance() method, which can also load an included library. The main difference is that you have to include the native library for all the different platforms, replicating all the work of the ap-loader build system every time you update async-profiler.

Dealing with multiple platforms is hard, and throwing an exception when not supporting a platform might be inconvenient for your use case. AsyncProfilerLoader has the loadOrNull method which returns null instead and also the isSupported to check whether the current combination of OS and CPU is supported. A typical use case could be:

if (AsyncProfilerLoader.isSupported()) {
  AsyncProfilerLoader.load().start(...);
} else {
  // use JFR or other fall-backs
}

This might still throw IOExceptions, but they should never happen in normal circumstances and are probably by problems that should be investigated, being either an error in ap-loader or in your application.

If you want to merely get the path to the extracted libAsyncProfiler, then use the getAsyncProfilerPath method which throws the same exceptions as the load method. A similar method exists for jattach (getJattachPath).

Execute Profiler

The async-profiler project contains the profiler.sh script (will be replaced by asprof starting with async-profiler 2.10):

To run the agent and pass commands to it, the helper script profiler.sh is provided. A typical workflow would be to launch your Java application, attach the agent and start profiling, exercise your performance scenario, and then stop profiling. The agent’s output, including the profiling results, will be displayed in the Java application’s standard output.

Async-Profiler documentation

This helper script is also included in ap-loader and allows you to use the script on the command-line via java -jar ap-loader profiler ..., the API exposes this functionality via ExecutionResult executeProfiler(String... args).

AsyncProfilerLoader.executeProfiler("-e", "wall", "8983")
// is equivalent to
./profiler.sh -e wall -t -i 5ms -f result.html 8983

The executeProfiler method throws an IllegalStateException if the current platform is not supported. The returned instance of ExecutionResult contains the standard and error output:

public static class ExecutionResult {
  private final String stdout;
  private final String stderr;
    // getter and constructor
    ...
}

executeProfiler throws an IOException if the profiler execution failed.

Execute Converter

You cannot only use the converter by using the classes from the one.profiler.converter, but you can also execute the converter by calling ExecutionResult executeProfiler(String... args), e.g., the following:

AsyncProfilerLoader.executeConverter(
  "jfr2flame", "<input.jfr>", "<output.html>")
// is equivalent to
java -cp converter.jar \
  jfr2flame <input.jfr> <output.html>

The executeConverter returns the output of the conversion tool on success and throws an IOException on error, as before.

JAttach

There are multiple ways to use the embedded jattach besides using the binary returned by getJattachPath: ExecutionResult executeJattach(String... args) and boolean jattach(Path agentPath[, String arguments]).

executeJattach works similar to executeProfiler, e.g.:

AsyncProfilerLoader.executeJattach(
  "<pid>", "load", "instrument", "false", "javaagent.jar=arguments")
// is equivalent to
jattach <pid> load instrument false "javaagent.jar=arguments"

This runs the same as jattach with the only exception that every string that ends with
libasyncProfiler.so is mapped to the extracted async-profiler library for the load command.
One can, therefore, for example, start the async-profiler on a different JVM via the following:

AsyncProfilerLoader.executeJattach(
  PID, "load", "libasyncProfiler.so", true, "start")

But this use case can, of course, be accomplished by using the executeProfiler method, which internally uses jattach.

A great use case for jattach is to attach a custom native agent to the currently running JVM. Starting with JVM 9 doing this via VirtualMachine#attach throws an IOException if you try this without setting -Djdk.attach.allowAttachSelf=true. The boolean jattach(Path agentPath[, String arguments]) methods simplify this, constructing the command line arguments for you and returning true if jattach succeeded, e.g.:

AsyncProfilerLoader.jattach("libjni.so")

This attaches the libjni.so agent to the current JVM. The process id of this JVM can be obtained by using the getProcessId method.

Extracting a Native Library

I happen to write many small projects for testing profilers that often require loading a native library from the resources folder; an example can be found in the trace_validation (blog post) project:

/**
 * extract the native library and return its temporary path
 */
public static synchronized Path getNativeLibPath(
 ClassLoader loader) {
  if (nativeLibPath == null) {
    try {
      String filename = System.mapLibraryName(NATIVE_LIB);
      InputStream in = loader.getResourceAsStream(filename);
      // ...
    } catch (IOException e) {
      throw new RuntimeException(e);
    }
  }
  return nativeLibPath;
}

I, therefore, added the extractCustomLibraryFromResources method:

/**                                                                                                                                        
 * Extracts a custom native library from the resources and 
 * returns the alternative source if the file is not 
 * in the resources.                                                                                                    
 *                                                                                                                                         
 * If the file is extracted, then it is copied to 
 * a new temporary folder which is deleted upon JVM exit.                            
 *                                                                                                                                         
 * This method is mainly seen as a helper method 
 * to obtain custom native agents for #jattach(Path) and                          
 * #jattach(Path, String). It is included in ap-loader 
 * to make it easier to write applications that need                           
 * custom native libraries.                                                                                                           
 *                                                                                                                                         
 * This method works on all architectures.                                                                                          
 *                                                                                                                                         
 * @param classLoader the class loader to load 
 *                 the resources from                                                                          
 * @param fileName the name of the file to copy, 
 *                 maps the library name if the fileName 
 *                 does not start with "lib", e.g. "jni" 
 *                 will be treated as "libjni.so" on Linux 
 *                 and as "libjni.dylib" on macOS                                       
 * @param alternativeSource the optional resource directory 
 *                 to use if the resource is not found in 
 *                 the resources, this is typically the case 
 *                 when running the application from an IDE, 
 *                 an example would be "src/main/resources" 
 *                 or "target/classes" for maven projects                                                    
 * @return the path of the library                                                                                                         
 * @throws IOException if the extraction fails and 
 *                  the alternative source is not present 
 *                  for the current architecture                      
 */                                                                                                                                        
public static Path extractCustomLibraryFromResources(
  ClassLoader classLoader, String fileName, 
  Path alternativeSource) throws IOException

This can be used effectively together with jattach to attach a native agent from the resources to the current JVM:

// extract the agent first from the resources
Path p = one.profiler.AsyncProfilerLoader.
  extractCustomLibraryFromResources(
    ....getClassLoader(), "library name");
// attach the agent to the current JVM
one.profiler.AsyncProfilerLoader.jattach(p, "optional arguments")
// -> returns true if jattach succeeded

This use-case comes from a profiler test helper library on which I hope to write a blog post in the near future.

Conclusion

ap-loader makes it easy to use async-profiler and its included tools programmatically without creating complex build systems. The project is regularly updated to keep pace with the newest stable async-profiler version; updating a version just requires changing a single dependency in your dependencies list.

The ap-loader is mature, so try it and tell me about it. I’m happy to help with any issues you have with this library, so feel free to write to me or create an issue on GitHub.

This project is part of my work in the SapMachine team at SAP, making profiling easier for everyone.