More than three years in the making, with a concerted effort starting last year, my CPU-time profiler landed in Java with OpenJDK 25. It’s an experimental new profiler/method sampler that helps you find performance issues in your code, having distinct advantages over the current sampler. This is what this week’s and next week’s blog posts are all about. This week, I will cover why we need a new profiler and what information it provides; next week, I’ll cover the technical internals that go beyond what’s written in the JEP. I will quote the JEP 509 quite a lot, thanks to Ron Pressler; it reads like a well-written blog post in and of itself.
Before I show you its details, I want to focus on what the current default method profiler in JFR does:
At every interval, say 10 or 20 milliseconds, five threads running in Java and one in native Java are picked from the list of threads and sampled. This thread list is iterated linearly, and threads not in the requested state are skipped (source).
The aggressive subsampling means that the effective sampling interval depends on the number of cores and the parallelism of your system. Say we have a large machine on which 32 threads can run in parallel. Then JFR on samples at most 19%, turning a sampling rate of 10ms into 53ms. This is an inherent property of wall-clock sampling, as the sampler considers threads on the system. This number can be arbitrarily large, so sub-sampling is necessary.
However, the sampling policy is not true wall-clock sampling, as it prioritizes threads running in Java. Consider a setting where 10 threads run in native and 5 in Java. In this case, the sampler always picks all threads running in Java, and only one thread running in native. This might be confusing and may lead users to the wrong conclusions.
Even if we gloss over this and call the current strategy “execution-time”, it might not be suitable for profiling every application. To quote from the/my JEP (thanks to Ron Pressler for writing most of the JEP text in its final form):
Execution time does not necessarily reflect CPU time. A method that sorts an array, e.g., spends all of its time on the CPU. Its execution time corresponds to the number of CPU cycles it consumes. In contrast, a method that reads from a network socket might spend most of its time idly waiting for bytes to arrive over the wire. Of the time it consumes, only a small portion is spent on the CPU. An execution-time profile will not distinguish between these cases.
Even a program that does a lot of I/O can be constrained by the CPU. A computation-heavy method might consume little execution time compared the program’s I/O operations, thus having little effect on latency — but it might consume most of the program’s CPU cycles, thus affecting throughput. Identifying and optimizing such methods will reduce CPU consumption and improve the program’s throughput — but in order to do so, we need to profile CPU time rather than execution time.
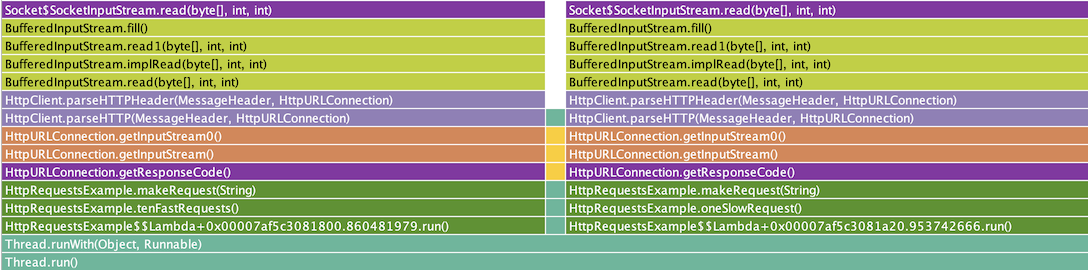
For example, consider a program, HttpRequests, with two threads, each performing HTTP requests. One thread runs a tenFastRequests method that makes ten requests, sequentially, to an HTTP endpoint that responds in 10ms; the other runs a oneSlowRequest method that makes a single request to an endpoint that responds in 100ms. The average latency of both methods should be about the same, and so the total time spent executing them should be about the same.
We can record a stream of execution-time profiling events like so:
You can find the program on GitHub. Be aware that it requires the server instance to run alongside, start it via
java HttpRequests server
At fixed time intervals, JFR records ExecutionSample events into the file profile.jfr. Each event captures the stack trace of a thread running Java code, thus recording all of the methods currently running on that thread. (The file profile.jfc is a JFR configuration file, included in the JDK, that configures the JFR events needed for an execution-time profile.)
We can generate a textual profile from the recorded event stream by using the jfr tool included in the JDK:
Here we see that the oneSlowRequest and tenFastRequests methods take a similar amount of execution time, as we expect.
However, we also expect tenFastRequests to take more CPU time than oneSlowRequest, since ten rounds of creating requests and processing responses requires more CPU cycles than just one round. If these methods were run concurrently on many threads then the program could become CPU-bound, yet an execution-time profile would still show most of the program’s time being spent waiting for socket I/O. If we could profile CPU time then we could see that optimizing tenFastRequests, rather than oneSlowRequest, could improve the program’s throughput.
Additionally, we point to a tiny but important problem in the JEP: the handling of failed samples. Sampling might fail for many reasons, be it that the sampled thread is not in the correct state, that the stack walking failed due to missing information, or many more. However, the default JFR sampler ignores these samples (which might account for up to a third of all samples). This doesn’t make interpreting the “execution-time” profiles any easier.
CPU-time profiling
As shown in the video above, sampling every thread every n milliseconds of CPU time improves the situation. Now, the number of samples for every thread is directly related to the time it spends on the CPU without any subsampling, as the number of hardware threads bounds the number of sampled threads.
The ability to accurately and precisely measure CPU-cycle consumption was added to the Linux kernel in version 2.6.12 via a timer that emits signals at fixed intervals of CPU time rather than fixed intervals of elapsed real time. Most profilers on Linux use this mechanism to produce CPU-time profiles.
Some popular third-party Java tools, including async-profiler, use Linux’s CPU timer to produce CPU-time profiles of Java programs. However, to do so, such tools interact with the Java runtime through unsupported internal interfaces. This is inherently unsafe and can lead to process crashes.
We should enhance JFR to use the Linux kernel’s CPU timer to safely produce CPU-time profiles of Java programs. This would help the many developers who deploy Java applications on Linux to make those applications more efficient.
Please be aware that I don’t discourage using async-profiler. It’s a potent tool and is used by many people. But it is inherently hampered by not being embedded into the JDK. This is especially true with the new stackwalking at safepoints (see Taming the Bias: Unbiased* Safepoint-Based Stack Walking in JFR), making the current JFR sampler safer to use. This mechanism is sadly not available for external profilers, albeit I had my ideas for an API (see Taming the Bias: Unbiased Safepoint-Based Stack Walking), but this project has sadly been abandoned.
Let’s continue with the example from before.
FR will use Linux’s CPU-timer mechanism to sample the stack of every thread running Java code at fixed intervals of CPU time. Each such sample is recorded in a new type of event, jdk.CPUTimeSample. This event is not enabled by default.
This event is similar to the existing jdk.ExecutionSample event for execution-time sampling. Enabling CPU-time events does not affect execution-time events in any way, so the two can be collected simultaneously.
We can enable the new event in a recording started at launch like so:
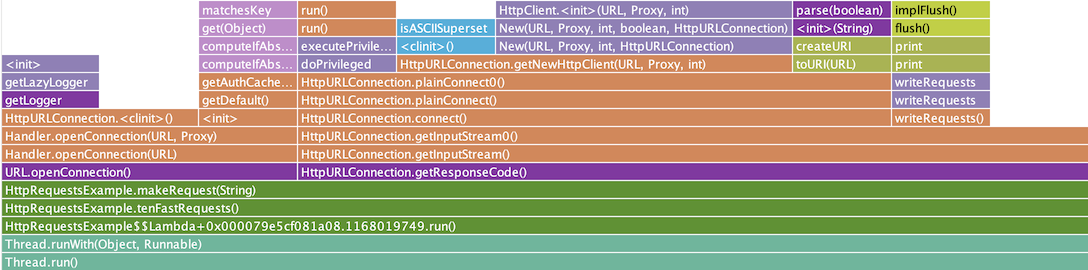
With the new CPU-time sampler, in the flame graph it becomes clear that the application spends nearly all of its CPU cycles in tenFastRequests:
A textual profile of the hot CPU methods, i.e., those that consume many CPU cycles in their own bodies rather than in calls to other methods, can be obtained like so:
$ jfr view cpu-time-hot-methods profile.jfr
However, in this particular example, the output is not as useful as the flame graph.
Notably, the CPU-time profiler also reports failed and missed samples, but more on that later.
Problems of the new Profiler
I pointed out all the problems in the current JFR method sampler, so I should probably point out my problems, too.
The most significant issue is platform support, or better, the lack of it: The new profiler only supports Linux for the time being. While this is probably not a problem for production profiling, as most systems use Linux anyway, it’s a problem for profiling on developer machines. Most development happens on Windows and Mac OS machines. So, not being able to use the same profiler as in production hampers productivity. But this is a problem for other profilers too. Async-profiler, for example, only supports wall-clock profiling on Mac OS and doesn’t support Windows at all. JetBrains has a closed-source version of async-profiler that might support cpu-time profiling on Windows (see GitHub issue). Still, I could not confirm as I don’t have a Windows machine and found no specific information online.
Another issue, of course, is that the profiler barely got in at the last minute, after Nicolai Parlog, for example, filmed his Java 25 update video.
Most users only use and get access to LTS versions of the JDK, so we wanted to get the feature into the LTS JDK 25 to allow people to experiment with it. To quote Markus Grönlund:
I am approving this PR for the following reasons:
We have reached a state that is “good enough” – I no longer see any fundamental design issues that can not be handled by follow-up bug fixes.
There are still many vague aspects included with this PR, as many has already pointed out, mostly related to the memory model and thread interactions – all those can, and should, be clarified, explained and exacted post-integration.
The feature as a whole is experimental and turned off by default.
Today is the penultimate day before JDK 25 cutoff. To give the feature a fair chance for making JDK25, it needs approval now.
Thanks a lot Johannes and all involved for your hard work getting this feature ready.
So, use the profiler with care. None of the currently known issues should break the JVM. But there are currently three important follow-up issues to the merged profiler:
I have already started work on the last issue and will be looking into the other two soon. Please test the profiler yourself and report all the issues you find.
The new CPUTimeSample Event
Where the old profiler had two events jdk.ExecutionSample and jdk.NativeMethodSampleThe new profiler has only one for simplicity, as it doesn’t treat threads in native and Java differently. As stated before, this event is called jdk.CPUTimeSample.
The event has five different fields:
stackTrace (nullable): Recorded stack trace
eventThread: Sampled thread
failed (boolean): Did the sampler fail to walk the stack trace? Implies that stackTrace is null
samplingPeriod: The actual sampling period, directly computed in the signal handler. More on that next week.
Internally, the profiler uses bounded queues, which might overflow; this can result in lost events. The number of these events is regularly recorded in the form of the jdk.CPUTimeSampleLoss event. The event has two fields:
lostSamples: Number of samples that have been lost since the last jdk.CPUTimeSampleLoss event
eventThread: Thread for which the samples are lost
Both events allow a pretty good view of the program’s execution, including a relatively exact view of the CPU time used.
Configuration of the CPU-time Profiler
The emission of two events of the current sampler is controlled via the period property. It allows the user to configure the sampling interval. The problem now with the CPU-time profiler is that it might produce too many events depending on the number of hardware threads. This is why the jdk.CPUTimeSample event is controlled via the throttle setting. This setting can be either a sampling interval or an upper bound for the number of emitted events.
When setting an interval directly like “10ms” (as in the default.jfc), then we sample every thread every 10ms of CPU-time. This can at most result in 100 * #[hardware threads] events per second. On a 10 hardware thread machine, this results in at most (when every thread is CPU-bound) 1000 events per second or 12800 on a 128 hardware thread machine.
Setting, on the other hand, throttle to a rate like “500/s” (as in the profile.jfc), limits the number of events per second to a fixed rate. This is implemented by choosing the proper sampling interval in relation to the number of hardware threads. For a rate of “500/s” and a ten hardware thread machine, this would be 20ms. On a 128 hardware thread machine, this would be 0.256.
In addition to the two new events, there are two new views that you can use via jfr view VIEW_NAME profile.jfr:
cpu-time-hot-methods shows you a list of the 25 most executed methods. These are methods that are on top of the stack the most (running the example with a 1ms throttle):
The second view is cpu-time-statistics which gives you the number of successful samples, failed samples, biased Samples, total samples, and lost samples:
CPU Time Sample Statistics
--------------------------
Successful Samples: 48
Failed Samples: 0
Biased Samples: 0
Total Samples: 48
Lost Samples: 14
All of the lost samples are caused by the sampled Java thread running VM internal code. This view is really helpful when checking whether the profiling contains the whole picture.
Conclusion
Getting this new profiler in JDK 25 was a real push, but I think it was worth it. OpenJDK now has a built-in CPU-time profiler that records missed samples. The implementation builds upon JFR’s new cooperative sampling approach, which also got into JDK 25 just days before. CPU-time profiling has many advantages, especially when you’re interested in the code that is actually wasting your CPU.
This is the first of a two-part series on the new profiler. You can expect a deep dive into the implementation of the profiler next week.
This blog post is part of my work in the SapMachine team at SAP, making profiling easier for everyone.
P.S.: I submitted to a few conferences the talk From Idea to JEP: An OpenJDK Developer’s Journey to Improve Profiling with the following description: Have you ever wondered how profiling, like JFR, works in OpenJDK and how we can improve it? In this talk, I’ll take you on my three-year journey to improve profiling, especially method sampling, with OpenJDK: from the initial ideas and problems of existing approaches to my different draft implementations and JEP versions, with all the setbacks and friends I made along the way. It’s a story of blood, sweat, and C++. It has sadly not been accepted yet.
Johannes Bechberger is a JVM developer working on profilers and their underlying technology in the SapMachine team at SAP. This includes improvements to async-profiler and its ecosystem, a website to view the different JFR event types, and improvements to the FirefoxProfiler, making it usable in the Java world. His work today comprises many open-source contributions and his blog, where he regularly writes on in-depth profiling and debugging topics. He also works on hello-ebpf, the first eBPF library for Java. His most recent contribution is the new CPU Time Profiler in JDK 25.
New posts like these come out at least every two weeks, to get notified about new posts, follow me on BlueSky, Twitter, Mastodon, or LinkedIn, or join the newsletter: