The second part of my journey down the Python debugger rabbit hole.
In this blog post, we extend and fix the debugger we created in part 1: We add the capability to
- single step over code, stepping over lines, into function calls, and out of functions,
- and adding conditions to breakpoints.
You can find the resulting MIT-licensed code on GitHub in the python-dbg repository in the file dbg.py. I added a README so you can glance at how to use it.
Fixes
To start with the fixes, I fixed minor issues but also one larger problem:
We had a dispatch function that we passed to sys.settrace, which is called upon every method entry/call:
    def _dispatch_trace(self, frame: types.FrameType, event, arg):
        if self.is_first_call and self._main_file == Path(frame.f_code.co_filename):
            self.is_first_call = False
            self._breakpoint()
            return
        if event == 'call':
            if self._has_break_point_in(frame.f_code):
                if event == 'line' or event == 'call':
                    self._handle_line(frame)
                elif event == 'return' or event == 'exception':
                    self._handle_return(frame)
We forgot to return the function that should be used for the inner events of methods and the check for event == 'line' doesn’t make any sense if we already checked that event == 'call'.
Fixing both issues and removing the return case as _handle_return is an empty function, we get:
    def _default_dispatch(self, frame: types.FrameType, event, arg):
        # trace all functions, as we don't know where the user
        # will dynamically set breakpoints
        if event == 'call':
            return self._dispatch_trace

    def _dispatch_trace(self, frame: types.FrameType, event, arg):
        if event == 'return' and frame.f_code.co_name == '<module>' and \
                frame.f_back and frame.f_back.f_code.co_filename == __file__:
            return
        if self._is_first_call and self._main_file == Path(frame.f_code.co_filename):
            self._is_first_call = False
            self._breakpoint(frame, show_context=False, reason="start")
            return self._default_dispatch(frame, event, arg)
        if event == 'call':
            if self._has_break_point_in(frame.f_code):
                return self._dispatch_trace
            else:
                return self._default_dispatch(frame, event, arg)
        elif event == 'line':
            self._handle_line(frame)
sys.settrace revisited
As I made this mistake with sys.settrace in the last blog post, let us revisit this method:
Set the system’s trace function, which allows you to implement a Python source code debugger in Python. […]
Trace functions should have three arguments: frame, event, and arg. frame is the current stack frame. event is a string:
'call','line','return','exception'or'opcode'. arg depends on the event type.The trace function is invoked (with event set to
'call') whenever a new local scope is entered; it should return a reference to a local trace function to be used for the new scope, orNoneif the scope shouldn’t be traced.The local trace function should return a reference to itself (or to another function for further tracing in that scope), or
Python Documentation For Sys.SettraceNoneto turn off tracing in that scope.
Assuming that the trace method is _dispatch_trace, then the following is called in an example program (focusing on the essential parts):
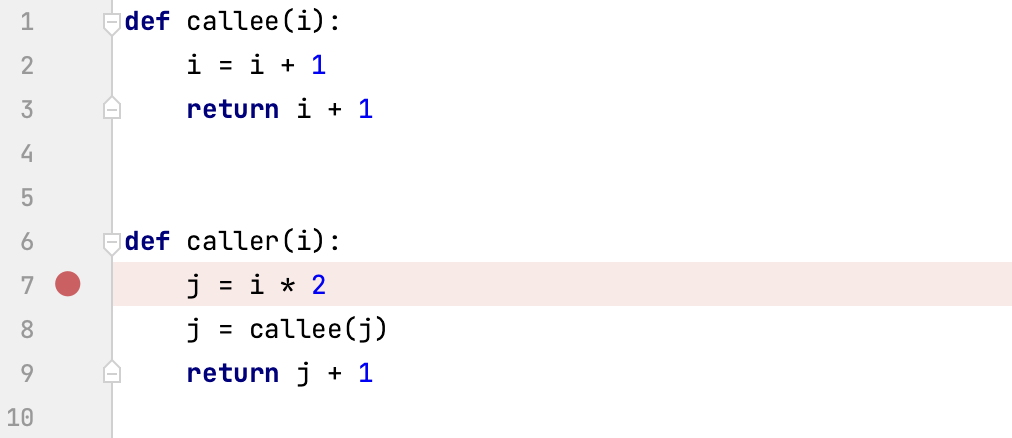
def callee(i):
    i = i + 1
    return i + 1


def caller(i):
    j = i * 2
    j = callee(j)
    return j + 1


caller(10)
caller(20)
You can find this code in the test.py file in the repository; it will be my example in the following sections.
- Call
_dispatch_traceon<module>the top-level code module with event call - if this returns a non-
Nonefunctionline_dispatch- then call
_dispatch_linewith the definitions ofcalleeandcaller, as well as thecaller(10)line each - else do nothing
- then call
- Call
_dispatch_traceon linecaller(10)to get the function called on every line in thecallerfunction while executing the call
This shows you that sys.settrace might be slightly confusing, yet a potent tool.
Conditional Breakpoints
Before we dive into the implementation of single stepping, I want to show you how to add conditions to breakpoints. Breakpoints are the bread-and-butter of debugging:

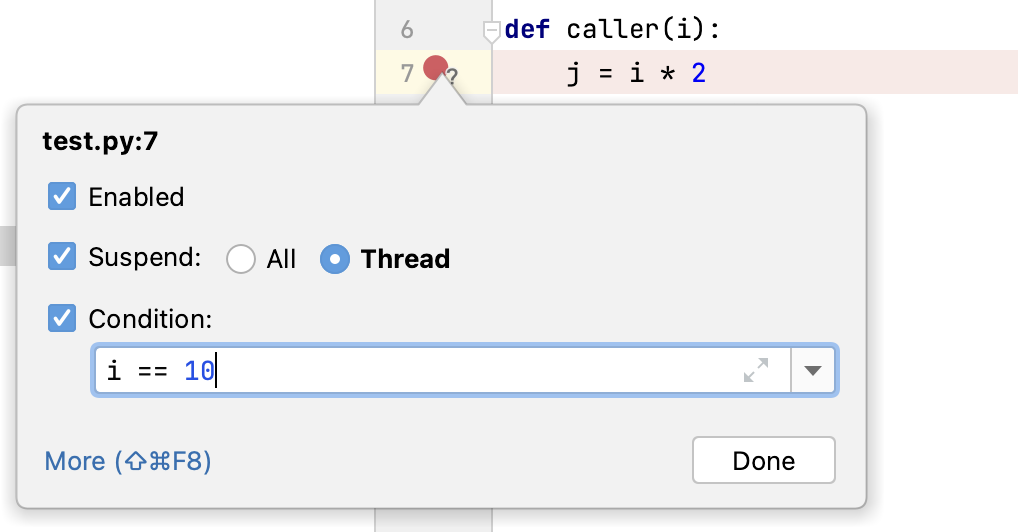
Extending them with conditions makes them even more versatile, especially in complex code. IDEs (like PyCharm) allow you to set arbitrary conditions evaluated at the specified breakpoint in the local context; the execution of the application is halted only if the condition is true.

Implementing them is straightforward. We store the conditions in a mapping of breakpoint (file + line) to condition…
self._breakpoint_to_scope_start: Dict[Path, Dict[int, int]] = {}
… and modify our breakpoint-setting-functions accordingly:
@func
def break_at_func(func: Callable = None, line: int = -1,
  condition: Optional[str] = None):
    # ...
We already have a function that we use to check if you should break at a specific frame, checking if there is a breakpoint at the frame’s current line of code called _should_break_at:
    def _should_break_at(self, frame: types.FrameType) -> bool:
        p = Path(frame.f_code.co_filename)
        return p in self._breakpoints_in_files and \
               frame.f_lineno in self._breakpoints_in_files[p]
To evaluate a breakpoint condition, we use the eval function and supply it with the frame’s local and global variables:
    def _should_break_at(self, frame: types.FrameType) -> bool:
        p = Path(frame.f_code.co_filename)
        if p in self._breakpoints_in_files and \
           frame.f_lineno in self._breakpoints_in_files[p]:
            if (p, frame.f_lineno) in self._breakpoint_conditions:
                return eval(self._breakpoint_conditions[(p, frame.f_lineno)],
                            frame.f_globals, frame.f_locals)
            return True
        return False
With this, we get conditional breakpoints like in PyCharm and can create them via the breakpoint functions:
>>> break_at_line("test.py", "callee", 2, "i == 10")
Breakpoint set
Now to the last significant feature missing in the debugger:
Single Stepping
The ability to single step through the code is great when exploring the context of breakpoints. It is so vital that debugging UIs in IDEs usually have buttons for the different types of steps prominently placed in the debug view:

There are three primary modes of stepping (and two miscellaneous that I omit):
- Stepping over lines: Step, but don’t step into called functions. Step out of functions if a function ended.
- Stepping into: Step over and into lines, and step out of functions if needed.
- Stepping out: Step out of the current function.
We encode these different modes in an enum:
class StepMode(Enum):
    """step modes"""
    over = 0
    """step over lines"""
    into = 1
    """step and step into functions"""
    out = 2
    """step out of the current function"""
And specify the current mode and the current frame in a state object:
@dataclass
class StepState:
    mode: StepMode
    frame: types.FrameType
    """current frame"""
Which we assign to a property:
self._single_step: Optional[StepState] = None
The basic idea behind the implementation of stepping is to check if the following dispatched line to conforms to the chosen stepping mode:
    def _should_single_step(self, frame: types.FrameType, event) -> bool:
        if not self._single_step:
            return False
        if self._single_step.mode == StepMode.over:
            # we don't want to step into function calls
            return frame == self._single_step.frame
        if self._single_step.mode == StepMode.into:
            return True
        if self._single_step.mode == StepMode.out and event == 'return':
            return frame == self._single_step.frame
        return False
We also check here for the return event, as this is required to be able to step out of functions. The _should_single_step function is used in the _dispatch_trace function, we trigger a breakpoint if necessary:
       if self._should_single_step(frame, event):
            if event == 'return':
                if frame.f_back:
                    self._single_step.frame = frame.f_back
                    self._breakpoint(frame.f_back, reason="step")
                return
            if self._single_step.mode == StepMode.out:
                return
            if event == 'line':
                self._single_step = None
                self._breakpoint(frame, reason="step")
                return
You may observe that treat returns, mainly because they are called in the returning function. Still, the return event occurs after the return line is executed, so we use the calling line as the current context.
For convenience, we also implement a single_stepping function that lets us step whenever we continue from the current break instead of going to the next breakpoint.
Example Debugging Session
We start the debugging session for the test.py file by calling test.py with the dbg module:
python3 -m dbg.py test.py
We can use the debugging shell to set a breakpoint in the callee function
at line 2:
Tiny debugger https://github.com/parttimenerd/python-dbg/
start at test.py:1 (<module>)
>>> break_at_line("test.py", "callee", 2)
>>> show("test.py")
>  1   def callee(i):         # current line, we are at the first line of the file
   2 *     i = i + 1          # * marks lines with breakpoints
   3       return i + 1
   4
   5
   6   def caller(i):
   7       j = i * 2
   8       j = callee(j)
   9       return j + 1
Ctrl-D / cont() let us continue execution until the breakpoint is hit:
>>> cont()
  1   def callee(i):
> 2 *     i = i + 1
  3       return i + 1
  4
  5
  6   def caller(i):


breakpoint at test.py:2 (callee)
>>> i
20
>>> locals()
{'i': 20}
>>> _frame
<frame at 0x106acbba0, file 'test.py', line 2, code callee>
We now use single_stepping and step through the code:
>>> single_stepping()
>>> cont()              # Ctrl-D is also fine
  1   def callee(i):
  2 *     i = i + 1
> 3       return i + 1
  4
  5
  6   def caller(i):
  7       j = i * 2


step at test.py:3 (callee)

>>> cont()
   4
   5
   6   def caller(i):
   7       j = i * 2
>  8       j = callee(j)
   9       return j + 1
  10
  11
  12   caller(10)
We then use step_out to step directly out of the caller function, aborting single-stepping mode:
step at test.py:8 (caller)
>>> step_out()
   8     j = callee(j)
   9     return j + 1
  10
  11
> 12 caller(10)
  13 caller(20)
With step and step_into, we can go into the second caller call and explore the values of i and j before quitting the debugging session:
step at test.py:12 (<module>)
>>> step()
   9     return j + 1
  10
  11
  12 caller(10)
> 13 caller(20)


step at test.py:13 (<module>)
>>> step_into()
   3     return i + 1
   4
   5
   6 def caller(i):
>  7     j = i * 2
   8     j = callee(j)
   9     return j + 1
  10


step at test.py:7 (caller)
>>> i
20
>>> step()
   4
   5
   6 def caller(i):
   7     j = i * 2
>  8     j = callee(j)
   9     return j + 1
  10
  11


step at test.py:8 (caller)

>>> step()
   5
   6 def caller(i):
   7     j = i * 2
   8     j = callee(j)
>  9     return j + 1
  10
  11
  12 caller(10)


step at test.py:9 (caller)
>>> j
42
>>> quit()
Conclusion
In the second part of this article series, we added conditional breakpoints and the ability to single-step through code. The resulting debugger thereby supports the major debugging features and is a usable command-line debugger. Remember that this debugger serves mainly an educational purpose, but it might be helpful when you want to customize your debugging session fully.
Writing this debugger together hopefully showed you that debuggers aren’t rocket science; implementing your own is a worthwhile experience. The following blog post in this series will cover the new “Low Impact Monitoring for CPython” API (PEP 669) introduced in Python 3.12 (released 2 October 2023), which allows us to create a debugger with less overhead.
Thanks for coming with me on this journey so far. It’s not my typical Java-related content, yet I hope it was still enjoyable.
Now, on to part 3.


