The following is a tutorial written for the sched_ext project, that gives you an introduction into writing a Linux scheduler directly in C. The tutorial is also present on the sched_ext scx wiki.
In the following a short tutorial for creating a minimal scheduler written with sched_ext in C. This scheduler uses a global scheduling queue from which every CPU gets its tasks to run for a time slice. The scheduler order is First-In-First-Out. So it essentially implements a round-robin scheduler:
This short tutorial covers the basics; to learn more, visit the resources from the scx wiki.
Almost to the day, a year ago, I published my blog post called Level-up your Java Debugging Skills with on-demand Debugging. In this blog post, I wrote about multiple rarely known and rarely used features of the Java debugging agent, including the onjcmd feature. To quote my own blog post:
JCmd triggered debugging
There are often cases where the code that you want to debug is executed later in your program’s run or after a specific issue appears. So don’t waste time running the debugging session from the start of your program, but use the onjcmd=y option to tell the JDWP agent to wait with the debugging session till it is triggered via jcmd.
The alternative to using this feature is to start the debugging session at the beginning and only connect to the JDWP agent when you want to start debugging. But this was, for a time, significantly slower than using the onjcmd feature (source):
This week, a short blog post on a question that bothered me this week: How can I get the operating systems thread ID for a given Java thread? This is useful when you want to deal with Java threads using native code (foreshadowing another blog post). The question was asked countless times on the internet, but I couldn’t find a comprehensive collection, so here’s my take. But first some background:
Background
In Java, normal threads are mapped 1:1 to operating system threads. This is not the case for virtual threads because they are multiplexed on fewer carrier threads than virtual threads, but we ignore these threads for simplicity here.
But what is an operating system thread? An operating system thread is an operating system task that shares the address space (and more) with other thread tasks of the same process/thread group. The main thread is the thread group leader; its operating system ID is the same as the process ID.
Be aware that the Java thread ID is not related to the operating system ID but rather to the Java thread creation order. Now, what different options do we have to translate between the two?
Different Options
During my research, I found three different mechanisms:
Using the gettid() method
Using JFR
Parsing thread dumps
In the end, I found that option 3 is best; you’ll see why in the following.
Or: Learn how to write a performant* Linux scheduler in 25 lines of Java code.
Welcome back to my series on ebpf. In the last post, I presented a recording of my JavaZone presentation on eBPF and a list of helpful resources for learning about the topic. Today, I’ll show you how to write a Linux scheduler in Java with eBPF. This blog post is the accompanying post to my eBPF summit keynote of the same title:
With my newest hello-ebpf addition, you can create a Linux scheduler by just implementing the methods of the Scheduler interface, allowing you to write a small scheduler with ease:
Is it really as easy as that? Of course not, at least not yet. Developing and running this scheduler requires a slightly modified version of hello-ebpf, which lives in the branch scx_demo, and a kernel patched with the sched-ext extension or a CachyOS instance with a 6.10 kernel, as well as some luck because it’s still slightly brittle.
Nonetheless, when you get it working, you can enter the wondrous world of people who build their schedulers with eBPF. You can find some of them on the sched-ext slack and many of their creation in the sched-ext/scx repository on GitHub. The kernel patches will hopefully be merged into the mainline kernel soon and will be available with version 6.12.
Welcome back to my series on ebpf. In the last post, I told you how to build a Firewall with Java and eBPF. I gave and will give the talk on the very same topic at multiple conferences, as mentioned at the end of the post. Last week, I gave it, together with Mohammed Aboullaite, at one of my favorite Java conferences: JavaZone. One of the reasons I recommend this conference to every upcoming speaker is that they create really good recordings of every talk and upload them to Vimeo almost immediately. So here is the recording of the talk:
Before I start, here is a disclaimer: The details of eBPF are hard, so I could only get the filtering of incoming packets to work reliably. Can I still call it a firewall? I would say yes, but please help me filter the outgoing packets if you disagree. Also, it’s my first Spring-Boot-based application, so please don’t judge it too harshly. Lastly, we only focus on IPv4 packets, so adding support for IPv6 rules is left to the reader.
Is it fast? Probably. I didn’t do any measurements myself, but research by Cloudflare suggests that XDP is far faster at dropping packets than the standard firewall.
Before we go into the details, first, the demo of the PacketLogger:
The logger captures the incoming and outgoing IP packets with their IP address, their protocol (TCP, UDP, OTHER), the TCP/UDP port, and the packet length. But before I show you how I implemented all this in Java, here is a short introduction to the Linux network stack:
Welcome back to my series on ebpf. In the last post, I told you about BTF and generating Java classes for all BPF types. This week, we’re using these classes to write a simple packet blocker in pure Java. This is the culmination of my efforts that started in my post Hello eBPF: Generating C Code (8), to reduce the amount of C code that you have to write to create your eBPF application.
This blog post took again longer than expected, but you’ll soon see why. And I dropped libbcc support along the way.
After my last blog post, you still had to write the eBPF methods in a String embedded in the Java application. So if you wanted to write a simple XDP-based packet blocker that blocks every third incoming packet, you wrote the actual XDP logic into a String-typed field named EBPF_PROGRAM. But we already can define the data types and global variables in Java, generating C code automatically. Can we do the same for the remaining C code? We can now. Introducing the new Java compiler plugin, that allows to you write the above in “pure” Java, using Java as a DSL for C (GitHub):
@BPF(license = "GPL") // define a license
public abstract class XDPDropEveryThirdPacket
  extends BPFProgram implements XDPHook {

    // declare the global variable
    final GlobalVariable<@Unsigned Integer> count =
        new GlobalVariable<>(0);

    @BPFFunction
    public boolean shouldDrop() {
        return count.get() % 3 == 1;
    }

    @Override // defined in XDPHook, compiled to C
    public xdp_action xdpHandlePacket(Ptr<xdp_md> ctx) {
        // update count
        count.set(count.get() + 1);
        // drop based on count
        return shouldDrop() ? xdp_action.XDP_DROP : xdp_action.XDP_PASS;
    }

    public static void main(String[] args)
      throws InterruptedException {
        try (XDPDropEveryThirdPacket program =
             BPFProgram.load(XDPDropEveryThirdPacket.class)) {
            program.xdpAttach(XDPUtil.getNetworkInterfaceIndex());
            while (true) {
                System.out.println("Packet count " +
                                   program.count.get());
                Thread.sleep(1000);
            }
        }
    }
}
Welcome back to my series on ebpf. In the last post, we learned how to use global variables to communicate easily between user and kernel land. In this post, you’ll learn about the BPF Type Format (BTF) and how and why we generate Java code from it.
We start with the simple question of what is BTF:
VMLinux Header
In all BPF programs that we’ve written in this blog series, we included a specific header:
#include "vmlinux.h"
This header contains all of the fundamental types and definitions we need when writing our BPF programs. It contains simple definitions like the integer types used in many of the examples:
I worked too much on other stuff, so I didn’t have time to blog, so here is a tiny post.
Java annotations are pretty nice: You can annotate many things to add more information. For example, you can add an @Nullable to a type used to tell static analyzers or IDEs that this the value of this type there might actually be null:
There are many other uses, especially in adding more information needed for code generation. In working on hello-ebpf, I used annotations and generated code with JavaPoet containing annotations. When we generate the code from above with JavaPoet, it produces:
This denotes a two-dimensional array of strings that might be null and might contain null, and its arrays might contain null. This is true to the language specification:
There is even an example in the specification that is similar to our example:
For example, given the field declaration:
@Foo int f;
@Foo is a declaration annotation on f if Foo is meta-annotated by @Target(ElementType.FIELD), and a type annotation on int if Foo is meta-annotated by @Target(ElementType.TYPE_USE). It is possible for @Foo to be both a declaration annotation and a type annotation simultaneously.
Type annotations can apply to an array type or any component type thereof (§10.1). For example, assuming that A, B, and C are annotation interfaces meta-annotated with @Target(ElementType.TYPE_USE), then given the field declaration:
@C int @A [] @B [] f;
@A applies to the array type int[][], @B applies to its component type int[], and @C applies to the element type int. For more examples, see §10.2.
An important property of this syntax is that, in two declarations that differ only in the number of array levels, the annotations to the left of the type refer to the same type. For example, @C applies to the type int in all of the following declarations:
Java never stops surprising me. This syntax looked weird when I first stumbled upon it, but after looking through the language specification, I see how useful and justified this placement of annotations is.
I hope you enjoyed this tiny blog post on annotations; see you in my next one.
Welcome back to my series on ebpf; in the last post, we learned how to write a simple XDP-based packet filter. In this post, we’ll continue the work on eBPF to make it easier to write more complex programs. Yes, I promised to write a load balancer but instead opted to add support for global variables to hello-ebpf, documenting it in this short post.
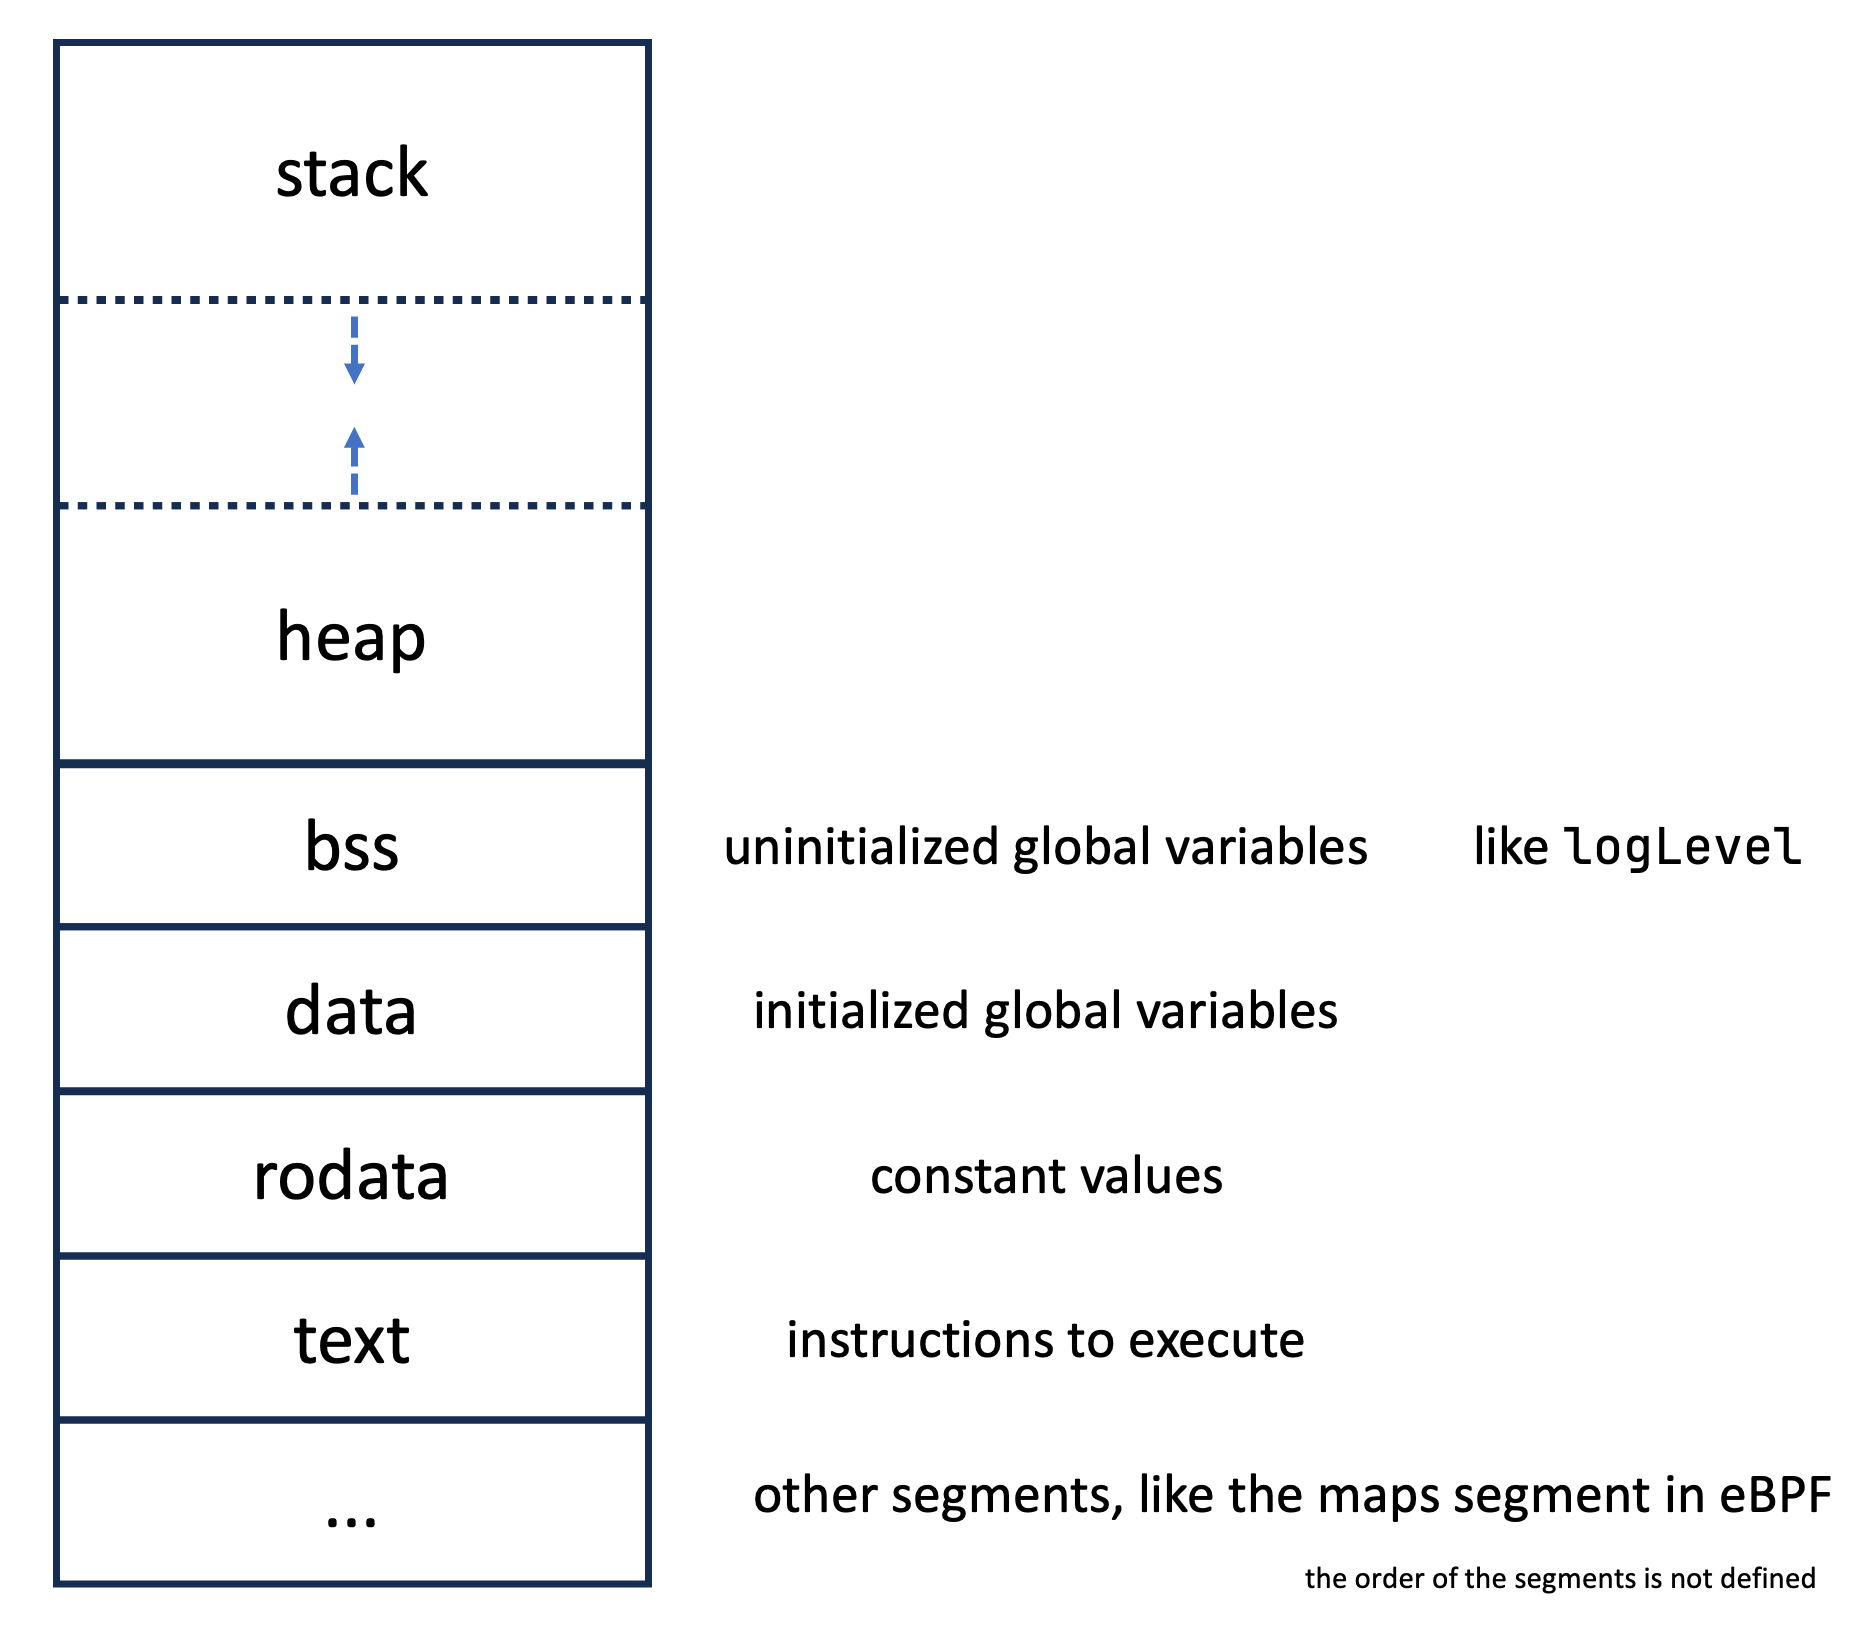
When we want to configure our eBPF program, say to set a simple logLevel setting, we currently have only one option: We could create an array map with one entry, our configuration value, and then use the usual methods to set its value and retrieve it. In Java, this would look like:
But how can we expose this to the user in user-land in a usable manner? We can extend the preprocessor to do its magic:
final GlobalVariable<Integer> logLevel =
    new GlobalVariable(/* initial value */ 42);

// later
program.logLevel.set(...);
// or
program.logLevel.get();
It is essential to state that the eBPF program can change the global variables, too, allowing us to have a simple communication channel between user-land and kernel-land.
This mechanism isn’t limited to scalar values; you can also store more complex values:
@Type
record Server(int ip, @Size(10) int[] ports, int portsCount) {}

final GlobalVariable<Server> server =
    new GlobalVariable<>(new Server(...,
        new int[]{22, 23, 0, 0, 0, 0, 0, 0, 0, 0}, 2));
Conclusion
Using global variables, we can easily configure our eBPF and communicate between user-land and kernel-land. Add some preprocessor magic, and we have a powerful new feature in hello-ebpf. With this at hand, we can finally start writing a load balancer.
Thanks for joining us on the journey to create an eBPF library for Java. I’ll see you in two weeks for the next installment.
This article is part of my work in the SapMachine team at SAP, making profiling and debugging easier for everyone. Thanks to Dylan Reimerink for answering all my questions and sharing all his knowledge on eBPF; this blog post is based on one of his answers on StackOverflow.
Fixing bugs in Spring Boot and Mockito by instrumenting them
Have you ever wondered how libraries like Spring and Mockito modify your code at run-time to implement all their advanced features? Wouldn’t it be cool to get a peek behind the curtains? This is the premise of my meta-agent, a Java agent to instrument instrumenters, to get these insights and what this blog post is about. This post is a collaboration with Mikaël Francoeur, who had the idea for the meta-agent and wrote most of this post. So it’s my first ever post-collaboration. But I start with a short introduction to the agent itself before Mikaël takes over with real-world examples.
Meta-Agent
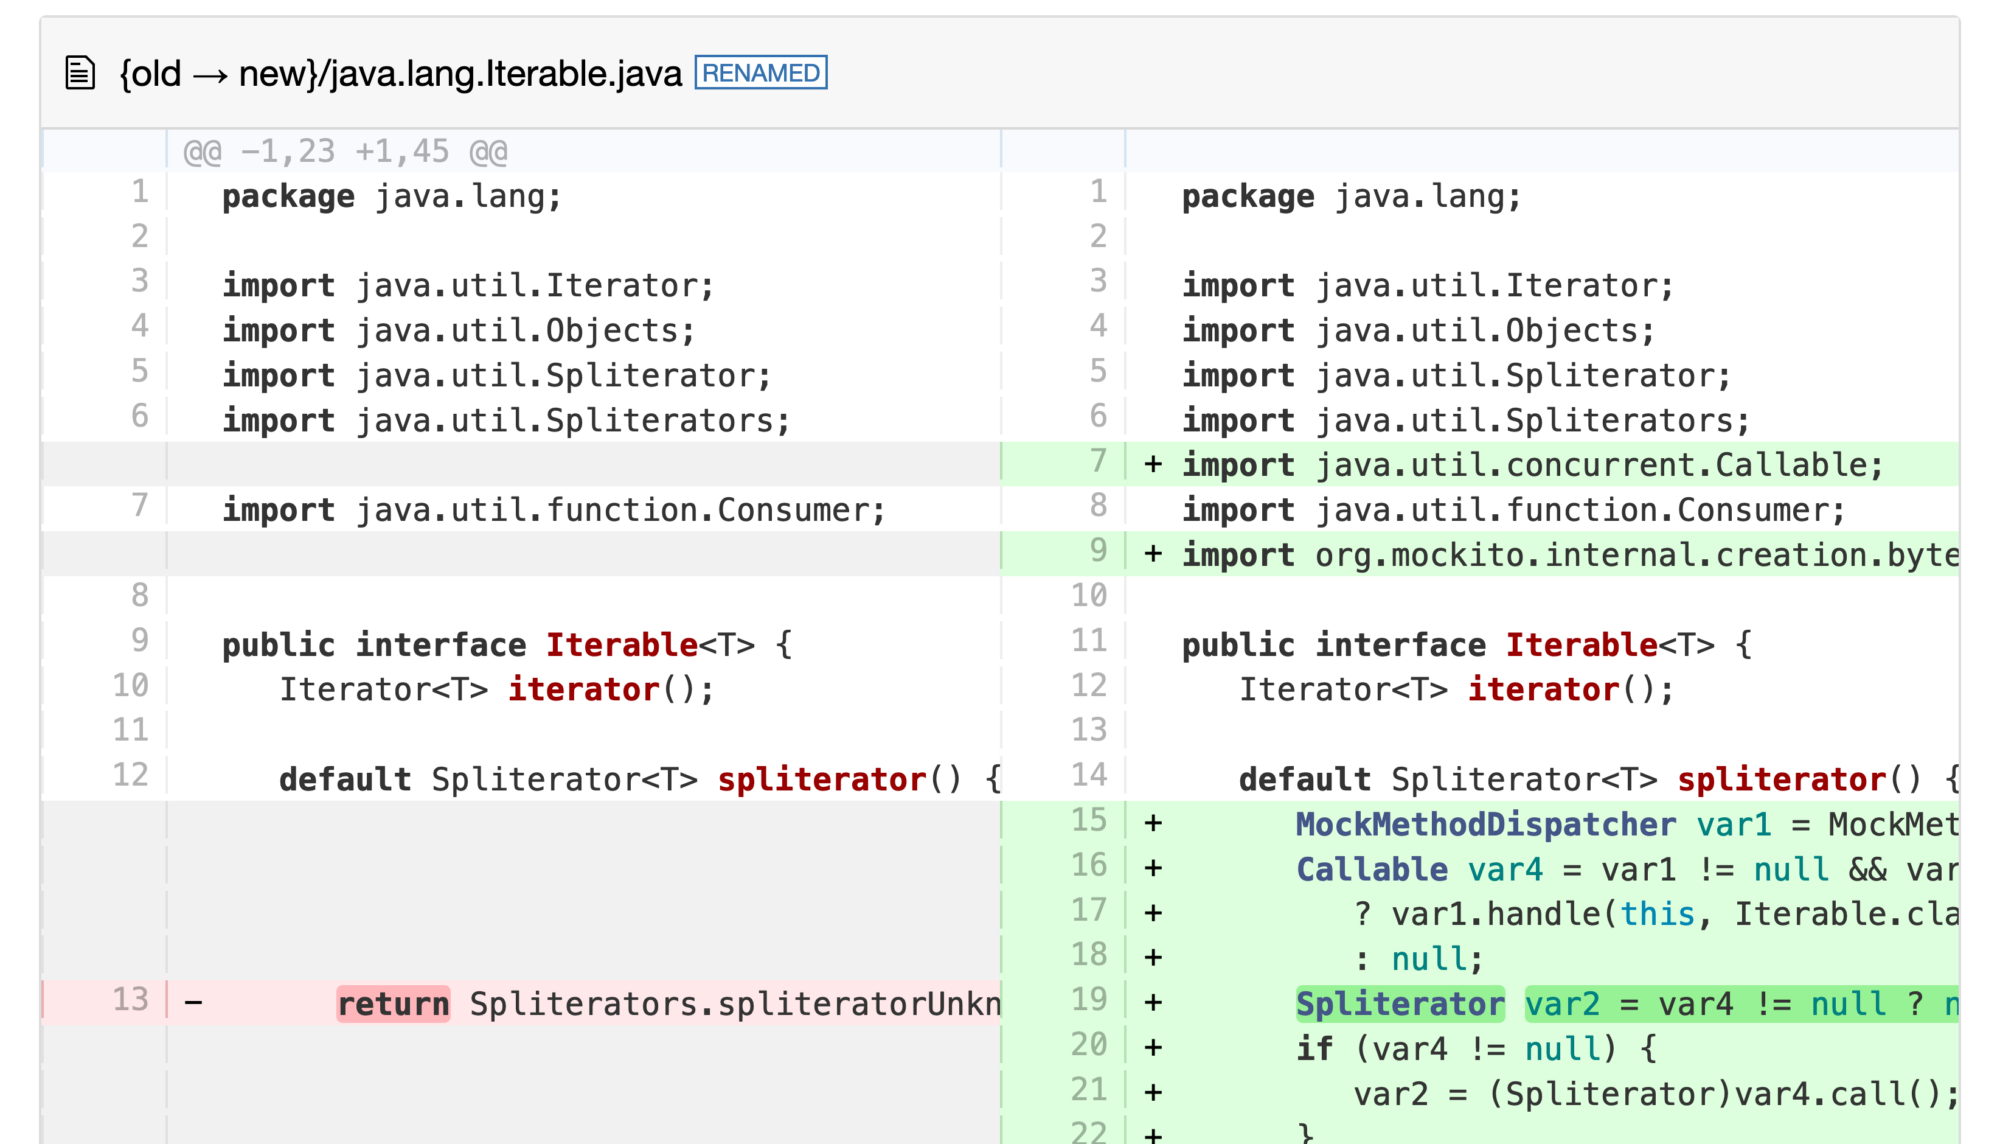
The meta-agent (GitHub) is a Java agent that instruments the Instrumentation.addTransformer methods agents use to add bytecode transformers and wrap the added transformers to capture bytecode before and after each transformation. This allows the agent to capture what every instrumenting agent does at run-time. I covered the basics of writing your own instrumenting agent before in my blog post Instrumenting Java Code to Find and Handle Unused Classes and my related talk. So, I’ll skip all the implementation details here.
But how can you use it? You first have to download the agent (or build it from scratch via mvn package -DskipTests), then you can just attach it to your JVM at the start:
Welcome back to my series on ebpf. In the last blog post, we learned how annotation processors can generate C code, simplifying writing eBPF applications. This week, we’ll use this work together with new support for XDP to create a simple package blocker for eBPF (GitHub):
./run_bpf.sh XDPPacketFilter twitter.com
This blocks all incoming IPv4 packages from twitter.com. We see how it works in this blog post. First, we start with some background on networking and explain what XDP is.
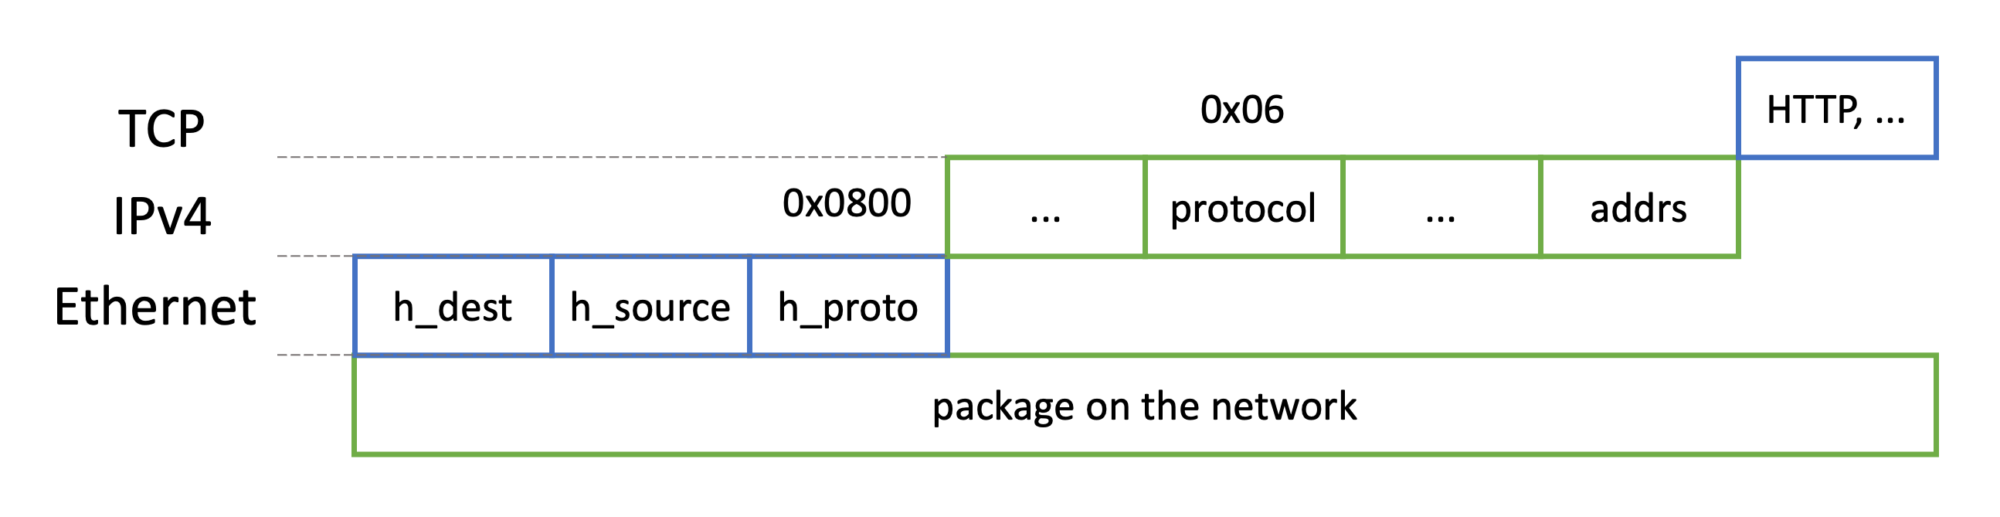
Network Packet
All networking is packet-based, with multiple layers of protocol from shared medium (e.g., Ethernet) to application level (e.g., HTTP):
This is a rather short blog post, but the implementation and fixing all the bugs took far more time then expected.
Generating Struct Definitions
We saw in the last blog post how powerful Java annotation processing is for generating Java code; this week, we’ll tackle the generation of C code: In the previous blog post, we still had to write the C struct and map definitions ourselves, but writing
when we already specified the data type properly in Java
record Event(@Unsigned int pid,
@Size(FILE_NAME_LEN) String filename,
@Size(TASK_COMM_LEN) String comm) {}
seems to be a great place to improve our annotation processor. There are only two problems:
The annotation processor needs to know about BPFTypes, so we have to move them in there. But the BPFTypes use the Panama API which requires the –enable-preview flag in JDK 21, making it unusable in Java 21. So we have to move the whole library over to JDK 22, as this version includes Panama.
There is no C code generation library like JavaPoet for generating Java code.
Regarding the first problem: Moving to JDK 22 is quite easy, the only changes I had to make are listed in this gist. The only major problem was getting the Lima VM to use a current JDK 22. In the end I resorted to just using sdkman, you can a look into the install.sh script to see how I did it.
Regarding the second problem: We can reduce the problem of generating C code into two steps:
Create an Abstract Syntax Tree (AST) for C
Create a pretty printer for this AST
To create an AST I resorted to an ANSI C grammar for inspiration. Each AST node implements the following interface:
We can then create a hierarchy of extending interfaces (PrimaryExpression, …) and implementing records (ConstantExpression, …). You can find the whole C AST on GitHub.
This leads us to an annotation processor that can add automatically insert struct definitions into the C code of our eBPF program, reducing the amount of hard-to-debug errors as it is guaranteed that both the Java specification and C representation of every type are compatible.
But can we do more with annotation processing?
Generating Map Definitions
There is another definition that we can auto-generate: Map definitions like
Our annotation-processor then turns this into the C definition from above and inserts code into the constructor of the Java program that properly initializes rb.
But how does the processor know what code it should generate? By parsing the BPFMapClass annotation on BPFRingBuffer (and any other class). This annotation contains the templates for both the C and the Java code:
@BPFMapClass(
cTemplate = """
struct {
__uint (type, BPF_MAP_TYPE_RINGBUF);
__uint (max_entries, $maxEntries);
} $field SEC(".maps");
""",
javaTemplate = """
new $class<>($fd, $b1)
""")
public class BPFRingBuffer<E> extends BPFMap {
}
Here $field is the Java field name, $maxEntries the value in the BPFMapDefinition annotation and $class the name of the Java class. $cX, $bX, $jX give the C type name, BPFType and Java class names related to the Xth type parameter.
Ring Buffer Sample Program
When we combine all this together we can have a much simpler ring buffer sample program (see TypeProcessingSample2 on GitHub):
@BPF(license = "GPL")
public abstract class TypeProcessingSample2 extends BPFProgram {
private static final int FILE_NAME_LEN = 256;
private static final int TASK_COMM_LEN = 16;
@Type(name = "event")
record Event(
@Unsigned int pid,
@Size(FILE_NAME_LEN) String filename,
@Size(TASK_COMM_LEN) String comm) {}
@BPFMapDefinition(maxEntries = 256 * 4096)
BPFRingBuffer<Event> rb;
static final String EBPF_PROGRAM = """
#include "vmlinux.h"
#include <bpf/bpf_helpers.h>
#include <bpf/bpf_tracing.h>
#include <string.h>
// This is where the struct and map
// definitions are inserted automatically
SEC ("kprobe/do_sys_openat2")
int kprobe__do_sys_openat2 (struct pt_regs *ctx)
{
// ... // as before
}
""";
public static void main(String[] args) {
try (TypeProcessingSample2 program =
BPFProgram.load(TypeProcessingSample2.class)) {
program.autoAttachProgram(
program.getProgramByName("kprobe__do_sys_openat2"));
// we can use the rb ring buffer directly
// but have to set the call back
program.rb.setCallback((buffer, event) -> {
System.out.printf(
"do_sys_openat2 called by:%s " +
"file:%s pid:%d\n",
event.comm(), event.filename(),
event.pid());
});
while (true) {
// consumes all registered ring buffers
program.consumeAndThrow();
}
}
}
}
There are two other things missing in the C code that are also auto-generated: Constant defining macros and the license definition. Macros are generated for all static final fields in the program class that are defined at compile time.
Conclusion
Using annotation processing allows to reduce the amount of C code we have to write and reduces errors by generating all definitions from the Java code. This simplifies writing eBPF applications.
See you in two weeks when we tackle global variables, moving closer and closer to making hello-ebpf’s bpf support able to write a small firewall.
This will also be the topic of a talk that I submitted together with Mohammed Aboullaite to several conferences for autumn.
Addendum
The more I work on writing my own ebpf library, the more I value the effort that the developers of other libraries like bcc, the Go or Rust ebpf libraries put it in to create usable libraries. They do this despite the lack of of proper documentation. A simple example is the deattaching of attached ebpf programs: There are multiple (undocumented) methods in libbpf that might be suitable; bpf_program__unload, bpf_link__detach, bpf_link__destroy, bpf_prog_detach, but only bpf_link__destroy properly detached a program.
This article is part of my work in the SapMachine team at SAP, making profiling and debugging easier for everyone.
Welcome back to my series on ebpf. In the last blog post, we learned how to use ring buffers with libbpf for efficient communication. This week, we’re looking into the memory layout and alignment of structs transferred between the kernel and user-land.
Alignment is essential; it specifies how the compiler layouts the structs and variables and where to put the data in memory. Take, for example, the struct that we defined in the previous blog post in the RingSample:
#define FILE_NAME_LEN 256
#define TASK_COMM_LEN 16
// Structure to store the data that we want to pass to user
struct event {
  u32 e_pid;
  char e_filename[FILE_NAME_LEN];
  char e_comm[TASK_COMM_LEN];
};
This means that the know also knows how to transform member accesses to this struct and can adequately place the event in the allocated memory:
You’ve actually seen the layouting information before, as the hello-ebpf project requires you to hand layout all structs manually:
record Event(@Unsigned int pid,
             @Size(FILE_NAME_LEN) String filename,
             @Size(TASK_COMM_LEN) String comm) {}
// define the event records layout
private static final BPFStructType<Event> eventType =
new BPFStructType<>("rb", List.of(
new BPFStructMember<>("e_pid",
BPFIntType.UINT32, 0, Event::pid),
new BPFStructMember<>("e_filename",
new StringType(FILE_NAME_LEN),
4, Event::filename),
new BPFStructMember<>("e_comm",
new StringType(TASK_COMM_LEN),
4 + FILE_NAME_LEN, Event::comm)
), new AnnotatedClass(Event.class, List.of()),
fields -> new Event((int)fields.get(0),
(String)fields.get(1), (String)fields.get(2)));
eBPF is agnostic regarding alignment, as the compiler on your system compiles the eBPF and the C code, so the compiler can decide how to align everything.
Alignment Rules
But where do these alignment rules come from? They come from how your CPU works. Your CPU usually only allows/is optimized for certain types of accesses. So, for example, x86 CPUs are optimized for accessing 32-bit integers that lay at addresses in memory that are a multiple of four. The rules are defined in the Application Binary Interface (ABI). The alignment rules for x86 (64-bit) on Linux are specified in the System V ABI Specification:
And more, but in general, scalar types are aligned by their size. Structs, unions, and arrays are, on the other hand, aligned based on their members:
Structures and unions assume the alignment of their most strictly aligned component. Each member is assigned to the lowest available offset with the appropriate alignment. The size of any object is always a multiple of the object‘s alignment.
An array uses the same alignment as its elements, except that a local or global array variable of length at least 16 bytes or a C99 variable-length array variable always has alignment of at least 16 bytes.
Structure and union objects can require padding to meet size and alignment constraints. The contents of any padding is undefined.
We can formulate the algorithm for structs as follows:
struct_alignment = 1
current_position = 0
for member in struct:
# compute the position of the member
# that is properly aligned
# this introduces padding (empty space between members)
# if there are alignment issues
current_position = \
math.ceil(current_position / alignment) * member.alignment
member.position = current_position
# the next position has to be after the current member
current_position += member.size
# the struct alignment is the maximum of all alignments
struct_alignment = max(struct_alignment, member.alignment)
With this at hand, we can look at a slightly more complex example:
Struct Example with Padding
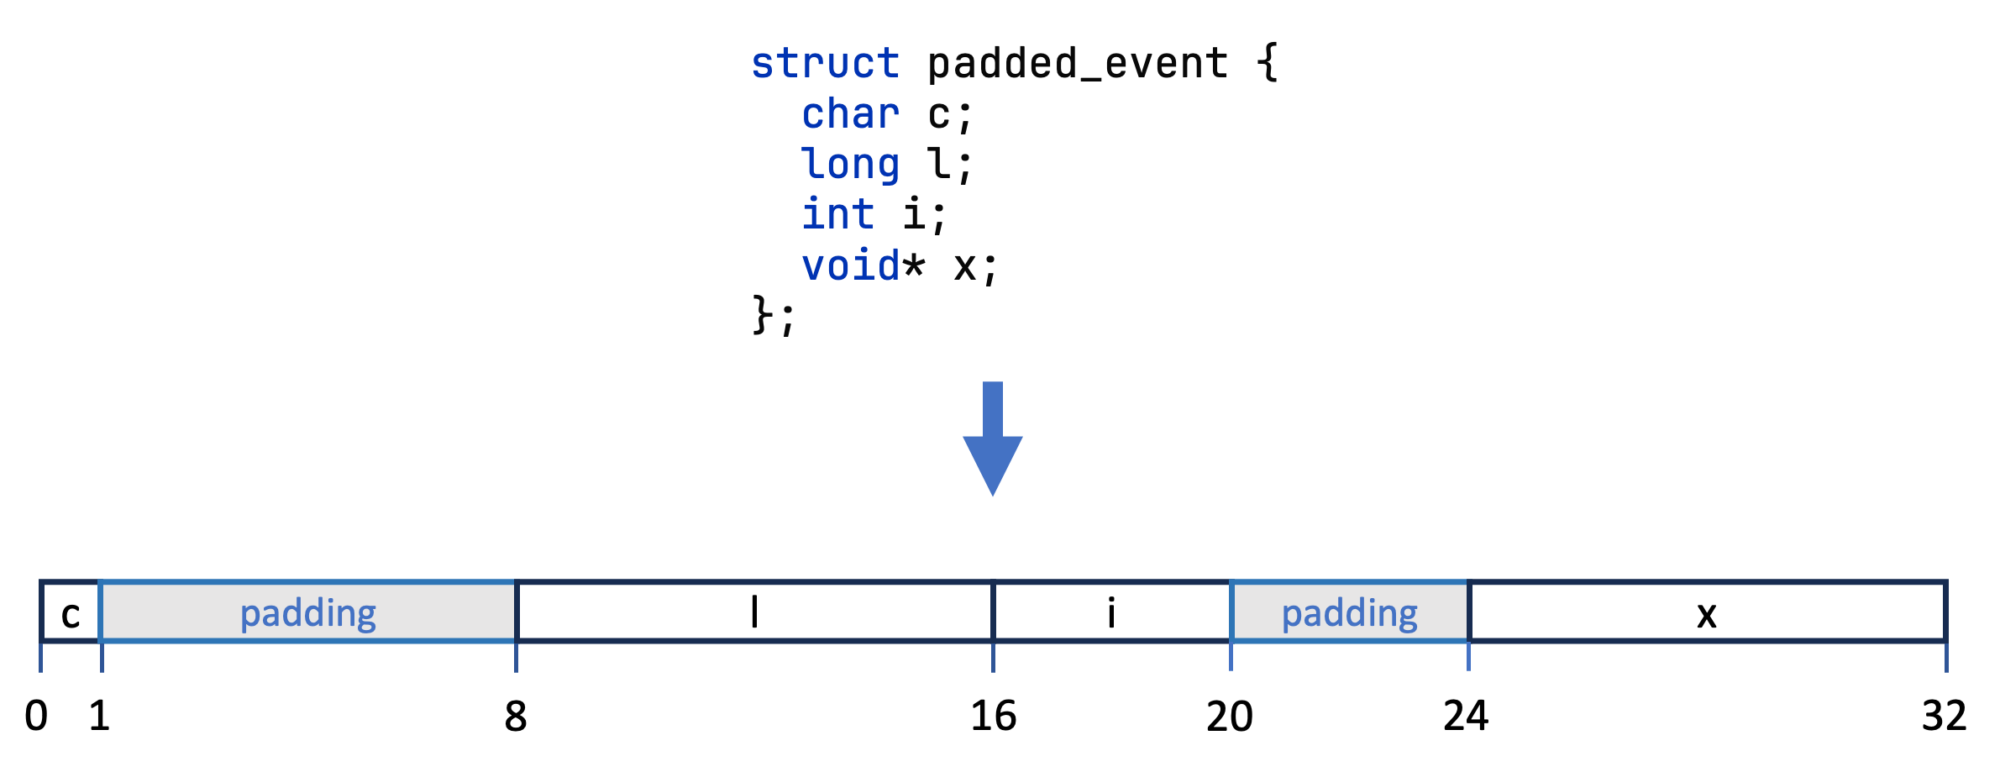
The compiler, at times, has to create an unused memory section between two members to satisfy the individual alignments. This can be seen in the following example:
struct padded_event {
char c; // single byte char, alignment of 1
long l; // alignment of 8
int i; // alignment of 4
void* x; // alignment of 8
};
Using Pahole again in the Compiler Explorer, we see the layout that the compiler generates:
Pahole tells us that it had to introduce 11 bytes of padding. We can visualize this as follows:
This means that we’re essentially wasting memory. I recommend reading The Lost Art of Structure Packing by Eric S. Raymond to learn more about this. If we really want to save memory, we could reorder the int with the long member, thereby only needing the padding after the char, leading to an object with 24 bytes and only 3 bytes of padding. This is really important when storing many of these structs in arrays, where the wasted memory accumulates.
But what do we do with this knowledge?
Auto-Layouting in hello-ebpf
The record that we defined in Java before contains all the information to auto-generate the BPFStructType for the class; we just need a little bit of annotation processor magic:
@Type
record Event(@Unsigned int pid,
@Size(FILE_NAME_LEN) String filename,
@Size(TASK_COMM_LEN) String comm) {}
This record is processed, and out comes the suitable BPFStructType:
We implemented the auto-layouting in the BPFStructType class to reduce the amount of logic in the annotation processor.
@BPF
public abstract class TypeProcessingSample extends BPFProgram {
static final String EBPF_PROGRAM = """...""";
private static final int FILE_NAME_LEN = 256;
private static final int TASK_COMM_LEN = 16;
@Type
record Event(@Unsigned int pid,
@Size(FILE_NAME_LEN) String filename,
@Size(TASK_COMM_LEN) String comm) {}
public static void main(String[] args) {
try (TypeProcessingSample program = BPFProgram.load(TypeProcessingSample.class)) {
program.autoAttachProgram(
program.getProgramByName("kprobe__do_sys_openat2"));
// get the generated struct type
var eventType = program.getTypeForClass(Event.class);
var ringBuffer = program.getRingBufferByName("rb", eventType,
(buffer, event) -> {
System.out.printf("do_sys_openat2 called by:%s file:%s pid:%d\n",
event.comm(), event.filename(), event.pid());
});
while (true) {
ringBuffer.consumeAndThrow();
}
}
}
}
The annotation processor currently supports the following members in records:
integer types (int, long, …), optionally annotated with @Unsigned if unsigned
String types, annotated with @Size to specify the size
Other @Type annotated types in the same scope
@Type.Member annotated member to specify the BPFType directly
You can find the up-to-date list in the documentation for the Type annotation.
Conclusion
We have to model all C types that we use in both eBPF and Java in Java, too; this includes placing the different members of structs in memory and keeping them properly aligned. We saw that the general algorithm behind the layouting is straightforward. This algorithm can be used in the hello-ebpf library with an annotation processor to make writing eBPF applications more concise and less error-prone.
I hope you liked this introduction to struct layouts. See you in two weeks when we start supporting more features of libbpf.
This article is part of my work in the SapMachine team at SAP, making profiling and debugging easier for everyone.
Last year was my first year blogging, speaking at conferences, meeting incredible people, and seeing places I’ve never been before. It was at times quite arduous but at the same time energizing, as you can read in my post Looking back on one year of speaking and blogging. I didn’t want it to be a one-off year, so I dutifully started a new blog series on eBPF and applied for conferences… And I got accepted at a few of them, which was really great because I started missing traveling after almost three months of being home. In this blog post, I’ll cover my first three conferences this year: FOSDEM in Brussels, ConFoo in Montreal, and Voxxed Days Zurich; they all happened between early February and early March.
It was the most travel, distance (and continent) wise, that I ever did before, by quite some margin:
Welcome back to my blog series on eBPF. Two weeks ago, I got started in using libbpf instead of libbcc. This week, I show you how to use ring buffers, port the code from Ansil H’s blog post eBPF for Linux Admins: Part IX from C to Java, and add tests to the underlying map implementation.
My libbpf-based implementation advances slower than the bcc-based, as I thoroughly test all added functionality and develop a proper Java API, not just a clone.
But first, what are eBPF ring buffers:
Ring buffers
In Hello eBPF: Recording data in event buffers (3), I showed you how to use perf event buffers, which are the predecessor to ring buffers and allow us to communicate between kernel and user-land using events. But perf buffers have problems:
It works great in practice, but due to its per-CPU design it has two major short-comings that prove to be inconvenient in practice: inefficient use of memory and event re-ordering.
To address these issues, starting from Linux 5.8, BPF provides a new BPF data structure (BPF map): BPF ring buffer (ringbuf). It is a multi-producer, single-consumer (MPSC) queue and can be safely shared across multiple CPUs simultaneously.
Their usage is similar to the perf event buffers we’ve seen before. The significant difference is that we implemented the perf event buffers using the libbcc-based eBPF code, which made creating a buffer easy:
BPF_PERF_OUTPUT(rb);
Libbcc compiles the C code with macros. With libbpf, we have to write all that ourselves:
// anonymous struct assigned to rb variable
struct
{
// specify the type, eBPF specific syntax
__uint (type, BPF_MAP_TYPE_RINGBUF);
// specify the size of the buffer
// has to be a multiple of the page size
__uint (max_entries, 256 * 4096);
} rb SEC (".maps") /* placed in maps section */;
long bpf_ringbuf_output(void *ringbuf, void *data, __u64 size, __u64 flags)
Copy the specified number of bytes of data into the ring buffer and send notifications to user-land. This function returns a negative number on error and zero on success.
Reserve a specified number of bytes in the ring buffer and return a pointer to the start. This lets us write events directly into the ring buffer’s memory (source).
Submit the reserved ring buffer event (reserved via bpf_ringbuf_reserve).
You might assume that you can build your own bpf_ringbuf_output with just bpf_ringbuf_reserve and bpf_ringbuf_submit and you’re correct. When we look into the actual implementation of bpf_ringbuf_output, we see that it is not that much more:
BPF_CALL_4(bpf_ringbuf_output, struct bpf_map *, map,
void *, data, u64, size,
u64, flags)
{
struct bpf_ringbuf_map *rb_map;
void *rec;
// check flags
if (unlikely(flags & ~(BPF_RB_NO_WAKEUP | BPF_RB_FORCE_WAKEUP)))
return -EINVAL;
// reserve the memory
rb_map = container_of(map, struct bpf_ringbuf_map, map);
rec = __bpf_ringbuf_reserve(rb_map->rb, size);
if (!rec)
return -EAGAIN;
// copy the data into the reserved memory
memcpy(rec, data, size);
// equivalent to bpf_ringbuf_submit(rec, flags)
bpf_ringbuf_commit(rec, flags, false /* discard */);
return 0;
}
Query various characteristics of provided ring buffer. What exactly is queries is determined by flags:
BPF_RB_AVAIL_DATA: Amount of data not yet consumed.
BPF_RB_RING_SIZE: The size of ring buffer.
BPF_RB_CONS_POS: Consumer position (can wrap around).
BPF_RB_PROD_POS: Producer(s) position (can wrap around).
Data returned is just a momentary snapshot of actual values and could be inaccurate, so this facility should be used to power heuristics and for reporting, not to make 100% correct calculation.
Return: Requested value, or 0, if flags are not recognized.
Linux kernel source code, as you saw above, can give us insights that no documentation can provide us with
Ring Buffer eBPF Example
After I’ve shown you what ring buffers are on the eBPF side, we can look at the eBPF example that writes an event for every openat call, capturing the process id, filename, and process name and comes as an addition from Ansil H’s blog post eBPF for Linux Admins: Part IX:
#include "vmlinux.h"
#include <bpf/bpf_helpers.h>
#include <bpf/bpf_tracing.h>
#include <string.h>
#define TARGET_NAME "sample_write"
#define MAX_ENTRIES 10
#define FILE_NAME_LEN 256
#define TASK_COMM_LEN 256
// Structure to store the data that we want to pass to user
struct event
{
u32 e_pid;
char e_filename[FILE_NAME_LEN];
char e_comm[TASK_COMM_LEN];
};
// eBPF map reference
 struct
 {
   __uint (type, BPF_MAP_TYPE_RINGBUF);
   __uint (max_entries, 256 * 4096);
 } rb SEC (".maps");
// The ebpf auto-attach logic needs the SEC
SEC ("kprobe/do_sys_openat2")
int kprobe__do_sys_openat2(struct pt_regs *ctx)
{
char filename[256];
char comm[TASK_COMM_LEN] = { };
struct event *evt;
const char fmt_str[] = "do_sys_openat2 called by:%s file:%s pid:%d";
// Reserve the ring-buffer
evt = bpf_ringbuf_reserve(&rb, sizeof (struct event), 0);
if (!evt) {
return 0;
}
// Get the PID of the process.
evt->e_pid = bpf_get_current_pid_tgid();
// Read the filename from the second argument
// The x86 arch/ABI have first argument
// in di and second in si registers (man syscall)
bpf_probe_read(evt->e_filename, sizeof(filename),
(char *) ctx->si);
// Read the current process name
bpf_get_current_comm(evt->e_comm, sizeof(comm));
bpf_trace_printk(fmt_str, sizeof(fmt_str), evt->e_comm,
evt->e_filename, evt->e_pid);
// Also send the same message to the ring-buffer
bpf_ringbuf_submit(evt, 0);
return 0;
}
char _license[] SEC ("license") = "GPL";
Ring Buffer Java Example
With this in hand, we can implement the RingSample using the newly added functionality in hello-ebpf:
@BPF
public abstract class RingSample extends BPFProgram {

  static final String EBPF_PROGRAM = """
              // ...
            """;

  private static final int FILE_NAME_LEN = 256;
  private static final int TASK_COMM_LEN = 16;

  // event record
  record Event(@Unsigned int pid,
               String filename,
               @Size(TASK_COMM_LEN) String comm) {}

  // define the event records layout
  private static final BPFStructType<Event> eventType =
          new BPFStructType<>("rb", List.of(
          new BPFStructMember<>("e_pid",
                  BPFIntType.UINT32, 0, Event::pid),
          new BPFStructMember<>("e_filename",
                  new StringType(FILE_NAME_LEN),
                  4, Event::filename),
          new BPFStructMember<>("e_comm",
                  new StringType(TASK_COMM_LEN),
                  4 + FILE_NAME_LEN, Event::comm)
  ), new AnnotatedClass(Event.class, List.of()),
  fields -> new Event((int)fields.get(0),
          (String)fields.get(1), (String)fields.get(2)));

  public static void main(String[] args) {
    try (RingSample program = BPFProgram.load(RingSample.class)) {
      // attach the kprobe
      program.autoAttachProgram(
              program.getProgramByName("kprobe__do_sys_openat2"));
      // obtain the ringbuffer
      // and write a message every time a new event is obtained
      var ringBuffer = program.getRingBufferByName("rb", eventType,
              (buffer, event) -> {
        System.out.printf("do_sys_openat2 called by:%s file:%s pid:%d\n",
                event.comm(), event.filename(), event.pid());
      });
      while (true) {
        // consume and throw any captured
        // Java exception from the event handler
        ringBuffer.consumeAndThrow();
      }
    }
  }
}
You can run the example via ./run_bpf.sh RingSample:
do_sys_openat2 called by:C1 CompilerThre file:/sys/fs/cgroup/user.slice/user-1000.slice/user@1000.service/app.slice/snap.intellij-idea-community.intellij-idea-community-a46a168b-28d0-4bb9-9e15-f3a966353efe.scope/memory.max pid:69817
do_sys_openat2 called by:C1 CompilerThre file:/sys/fs/cgroup/user.slice/user-1000.slice/user@1000.service/app.slice/snap.intellij-idea-community.intellij-idea-community-a46a168b-28d0-4bb9-9e15-f3a966353efe.scope/memory.max pid:69812
do_sys_openat2 called by:java file:/home/i560383/.sdkman/candidates/java/21.0.2-sapmchn/lib/libjimage.so pid:69797
Conclusion
The libbpf part of hello-ebpf keeps evolving. With this blog post, I added support for the first kind of eBPF maps and ring buffers, with a simplified Java API and five unit tests. I’ll most likely work on the libbpf part in the future, as it is far easier to work with than with libbcc.
Thanks for joining me on this journey to create a proper Java API for eBPF. Feel free to try the examples for yourself or even write new ones and join the discussions on GitHub. See you in my next blog post about my journey to Canada or in two weeks for the next installment of this series.
This article is part of my work in the SapMachine team at SAP, making profiling and debugging easier for everyone.
With my current libbcc-based approach, we essentially embed the executed eBPF program into our programs as a string into our applications and compile them on the fly for every run:
public class HelloWorld {
    public static void main(String[] args) {
        try (BPF b = BPF.builder("""
                int kprobe__sys_clone(void *ctx) {
                   bpf_trace_printk("Hello, World!");
                   return 0;
                }
                """).build()) {
            b.trace_print();
        }
    }
}
Problems with Libbcc
Using libbcc and porting the Python wrapper made it easy to start developing a user-land Java library and offers some syntactic sugar, but it has major disadvantages, to quote Andrii Nakryiko:
Clang/LLVM combo is a big library, resulting in big fat binaries that need to be distributed with your application.
Clang/LLVM combo is resource-heavy, so when you are compiling BPF code at start up, you’ll use a significant amount of resources, potentially tipping over a carefully balanced production workfload. And vice versa, on a busy host, compiling a small BPF program might take minutes in some cases.
BPF program testing and development iteration is quite painful as well, as you are going to get even most trivial compilation errors only in run-time, once you recompile and restart your user-space control application. This certainly increases friction and is not helping to iterate fast.
Additionally, the libbcc binaries in the official Ubuntu package repositories are outdated, so we’re accumulating technical debt using them.
BPF-based Library
So what is the alternative? We compile the embedded C code in our application to eBPF bytecode at build time using a custom annotation processor and load the bytecode using libbpf at run-time:
This allows us to create self-contained JARs that will eventually neatly package our eBPF application.
With this new chapter of the hello-ebpf project, I am trying to create a proper Java API that
builds on top of libbpf
isn’t bound to mimic the Python API, thus making it easier to understand for Java developers
is tested with a growing number of tests so that it is safe to use
prefers usability (and a small API) over speed
The annotation processor for this lives in the bpf-processor, and the central part of the library is in the bpf folder. It is in its earliest stages, but you can expect more features and tests in the following months.
HelloWorld Example
Writing programs with libbpf is not too dissimilar to using my libbcc wrapper:
@BPF // annotation to trigger the BPF annotation processor
public abstract class HelloWorld extends BPFProgram {

    // eBPF program code that is compiled at build
    // time using clang
    static final String EBPF_PROGRAM = """
            #include "vmlinux.h"
            #include <bpf/bpf_helpers.h>
            #include <bpf/bpf_tracing.h>

            SEC ("kprobe/do_sys_openat2")
            int kprobe__do_sys_openat2(struct pt_regs *ctx){
                bpf_printk("Hello, World from BPF and more!");
                return 0;
            }

            char _license[] SEC ("license") = "GPL";
            """;

    public static void main(String[] args) {
        // load an instance of the HelloWorld implementation
        try (HelloWorld program = BPFProgram.load(HelloWorld.class)) {
            // attach to the kprobe
            program.autoAttachProgram(
                program.getProgramByName("kprobe__do_sys_openat2"));
            program.tracePrintLoop(f ->
                String.format("%d: %s: %s", (int)f.ts(), f.task(), f.msg()));
        }
    }
}
Running this class via ./run_bpf.sh HelloWorld will then print the following:
3385: irqbalance: Hello, World from BPF and more!
3385: irqbalance: Hello, World from BPF and more!
3385: irqbalance: Hello, World from BPF and more!
3385: irqbalance: Hello, World from BPF and more!
3385: irqbalance: Hello, World from BPF and more!
3385: irqbalance: Hello, World from BPF and more!
3385: irqbalance: Hello, World from BPF and more!
3385: C2 CompilerThre: Hello, World from BPF and more!
The annotation processor created an implementation of the HelloWorld class, which overrides the getByteCode method:
public final class HelloWorldImpl extends HelloWorld {
    /**
     * Base64 encoded gzipped eBPF byte-code
     */
    private static final String BYTE_CODE = "H4sIAA...n5q6hfQNFV+sgDAAA=";

    @Override
    public byte[] getByteCode() {
        return Util.decodeGzippedBase64(BYTE_CODE);
    }
}
Compiler Errors
But what happens when you make a mistake in your eBPF program, for example, not writing a semicolon after the bpf_printk call? Then, the annotation processor throws an error at build-time and prints the following error message when calling mvn package:
Processing BPFProgram: me.bechberger.ebpf.samples.HelloWorld
Obtaining vmlinux.h header file
Could not compile eBPF program
HelloWorld.java:[19,66]  error: expected ';' after expression
    bpf_printk("Hello, World from BPF and more!")
                                                 ^
                                                 ;
1 error generated.
The annotation processor compiles the eBPF program using Clang and post-processes the error messages to show the location in the Java program. Using libbcc, we only get this error at run-time, which makes finding these issues far harder.
Conclusion
Using libbpf instead of libbcc has many advantages: Smaller, self-contained JARs, better developer support, and a more modern library. The hello-ebpf project will evolve to focus on libbpf to become a fully functional and tested eBPF user-land library. Using an annotation processor offers so many possibilities, so stay tuned.
Thanks for joining me on this journey to create a proper Java API for eBPF. I’ll see you in two weeks for the next installment in this series, and possibly before for a trip report on my current travels.
This article is part of my work in the SapMachine team at SAP, making profiling and debugging easier for everyone. This article was written in Canada, thanks to ConFoo and Theresa Mammarella, who made this trip possible. Inspiration came from Ansil H’s series on eBPF.
Please be aware that this blog post uses the discontinued libbcc-based API in hello-ebpf.
Welcome back to my blog series on eBPF. Two weeks ago, I showed you how to use perf event buffers to stream data from the eBPF program to the Java application. This week, we will finish chapter 2 of the Learning eBPF book, learn how to use tail calls and the hello-ebpf project as a library and implement one of the book’s exercises. We start with function and tail calls:
Function Calls
Regular C programs are divided into functions that call each other; so far in this series, all our eBPF programs consist of just a single function that calls kernel functions. But can we call other eBPF functions? End of 2017, Daniel Borkman et al. introduced the ability to call other functions defined in eBPF:
It allows for better optimized code and finally allows to introduce the core bpf libraries that can be reused in different projects, since programs are no longer limited by single elf file. With function calls bpf can be compiled into multiple .o files.
Before this change, you had to inline the functions essentially. There is just one problem with this approach: Every new function call takes space on the stack for its call frame that contains its parameters and local variables:
The maximum stack size is limited to 512 bytes, so every call frame counts for larger eBPF programs. Modern compilers will, therefore, try to inline the function calls and save space. To reduce the required stack memory, we have essentially two options besides inlining: We can either use static variables or tail calls. Andrii Nakryiko describes the former:
Declaring a variable as static, e.g. static int x, means that the value is stored as a global variable, existing once per program run. This is not a problem if a function doesn’t transitively call itself, which is true for all functions you would typically want to write in eBPF.
Tail Calls
Now to tail calls. If the function calls another function directly before returning (or as an argument to the return statement), then the call frames can be replaced. This is called a tail call and avoids growing the stack. In eBPF, it is possible to tail call one eBPF program (entry function that gets passed a context) from another program:
A tail call is achieved by storing the other program in a program array, which maps a 4-byte int to an eBPF program. The kernel function bpf_tail_call(ctx, program_array, index) can then be used to call a specific program:
This special helper is used to trigger a “tail call”, or in other words, to jump into another eBPF program. The same stack frame is used (but values on stack and in registers for the caller are not accessible to the callee). This mechanism allows for program chaining, either for raising the maximum number of available eBPF instructions, or to execute given programs in conditional blocks. For security reasons, there is an upper limit to the number of successive tail calls that can be performed.
Upon call of this helper, the program attempts to jump into a program referenced at index index in prog_array_map, a special map of type BPF_MAP_TYPE_PROG_ARRAY, and passes ctx, a pointer to the context.
This function only returns when it encounters an error, returning a negative error code.
Tail Call Example
Let’s create, as an example, an entry function that is triggered for every system call and tail calls another function using the stored ebpf programs for each system call number, based on the example in the Learning eBPF book:
BPF_PROG_ARRAY(syscall, 300);

int hello(struct bpf_raw_tracepoint_args *ctx) {
    // args[1] is here the syscall number
    int nr = ctx->args[1];
    // this is the BCC syntax for bpf_tail_call
    syscall.call(ctx, nr);
    // we only reach the print if the
    // syscall number is not associated
    // with a function
    bpf_trace_printk("Another syscall: %d", nr);
    return 0;
}

int hello_exec(void *ctx) {
    bpf_trace_printk("Executing a program");
    return 0;
}

int hello_timer(struct bpf_raw_tracepoint_args *ctx) {
    int nr = ctx->args[1];
    switch (nr) {
        case 222:
            bpf_trace_printk("Creating a timer");
            break;
        case 226:
            bpf_trace_printk("Deleting a timer");
            break;
        default:
            bpf_trace_printk("Some other timer operation");
            break;
    }
    return 0;
}

int ignore_nr(void *ctx) {
    return 0;
}
We can now store a function for every system call in the syscall program array, register the hello for every system call and tail call the specified function for every system call number.
You can find this example in the hello-ebpf repository. This includes all the Java code required to attach the eBPF program and log the result. I could just show you the example code, but let’s do something different this time:
Tail Example Application
I recently released the hello-ebpf library, which mainly consists of the bcc and annotation libraries, in Sonatype’s snapshot repository. Let’s use these releases to create our first application. This first application is a version of the HelloTail example from before.
We start by cloning my new sample-bcc-project, which we subsequently modify. This sample project contains essentially the following three parts:
src/main/java/Main.java: Main class for our Maven-based build
pom.xml: Maven pom that uses the snapshot repository to depend on the me.bechberger.bcc library. It also allows you to build a JAR with all dependencies included via mvn package.
run.sh: run the built JAR with the required flags “–enable-preview –enable-native-access=ALL-UNNAMED“
README.md: Information on how to run the program and more.
We only have to change the Main class to develop our application, adding our system-call-logging-related code. Our application should be able only to log execve, and itimer-related system calls when passed the --skip-others flag on the command line. So, we start with implementing the argument parsing:
record Arguments(boolean skipOthers) {
    static Arguments parseArgs(String[] args) {
        boolean skipOthers = false;
        if (args.length > 0) {
            if (args.length == 1 && args[0].equals("--skip-others")) {
                skipOthers = true;
            } else {
                // print usage for all other arguments, this
                // includes --help
                System.err.println("""
                Usage: app [--skip-others]

                   --skip-others: Only log execve and itimer system calls
                """);
                System.exit(1);
            }
        }
        return new Arguments(skipOthers);
    }
}
We then define the eBPF program, as well as some system calls that come up a lot, as static variables:
Now to the important part: The main and run methods that contain the central part of our application:
public static void main(String[] args) {
    run(Arguments.parseArgs(args));
}

static void run(Arguments args) {
    try (var b = BPF.builder(EBPF_PROGRAM).build()) {
        // attach to the tracepoint that is
        // called at the start of every system call
        b.attach_raw_tracepoint("sys_enter", "hello");

        // get the function ids of all defined functions
        var ignoreFn = b.load_raw_tracepoint_func("ignore_nr");
        var execFn = b.load_raw_tracepoint_func("hello_exec");
        var timerFn = b.load_raw_tracepoint_func("hello_timer");

        // obtain the program array
        var progArray = b.get_table("syscall",
            BPFTable.ProgArray.createProvider());

        // map the system call execve to the hello_exec function
        progArray.set(Syscalls.getSyscall("execve").number(),
                      execFn);

        // map the itimer system calls to the hello_timer function
        for (String syscall : new String[]{
                "timer_create", "timer_gettime",
                "timer_getoverrun", "timer_settime",
                "timer_delete"}) {
            progArray.set(Syscalls.getSyscall(syscall).number(),
                          timerFn);
        }

        // ignore some system calls that come up a lot
        for (int i : IGNORED_SYSCALLS) {
            progArray.set(i, ignoreFn);
        }

        // print the trace using a custom formatter
        b.trace_print(f -> formatTrace(f, args.skipOthers));
    }
}
This code uses the Syscalls class from the bcc library to map system calls to their number. The only part left now is the custom formatter, which takes care of the –skip-others option:
static @Nullable String formatTrace(BPF.TraceFields f,
  boolean skipOthers) {
    String another = "Another syscall: ";
    String line = f.line().replace("bpf_trace_printk: ", "");
    // replace other syscall with their names
    if (line.contains(another)) {
        // skip these lines if --skip-others is passed
        if (skipOthers) {
            return null;
        }
        var syscall =
                Syscalls.getSyscall(
                        Integer.parseInt(
                                line.substring(
                                        line.indexOf(another) +
                                                another.length())));
        return line.replace(another + syscall.number(),
                another + syscall.name());
    }
    return line;
}
This gives us an application that we can build via mvn package, and run:
> sudo -s PATH=$PATH
> ./run.sh --skip-others
     ps-26459   [031] ...2. 91897.197604: Executing a program
    git-26551   [052] ...2. 91935.368240: Executing a program
    git-26553   [031] ...2. 91935.373159: Executing a program
    git-26555   [016] ...2. 91935.378132: Executing a program
  <...>-26558   [053] ...2. 91935.383839: Executing a program
   tail-26561   [004] ...2. 91935.388621: Executing a program
    git-26562   [099] ...2. 91935.388970: Executing a program
   ...
> ./run.sh
  <...>-3277    [122] ...2. 91946.796677: Another syscall: recvmsg
   Xorg-3045    [121] ...2. 91946.796678: Another syscall: setitimer
  <...>-26461   [074] ...2. 91946.796680: Another syscall: readlink
   Xorg-3045    [121] ...2. 91946.796680: Another syscall: epoll_wait
  <...>-3457    [068] ...2. 91946.796681: Another syscall: recvmsg
  <...>-3277    [122] ...2. 91946.796682: Another syscall: recvmsg
  <...>-26461   [074] ...2. 91946.796684: Another syscall: readlink
  <...>-3277    [122] ...2. 91946.796685: Another syscall: recvmsg
  <...>-3457    [068] ...2. 91946.796689: Another syscall: recvmsg
  <...>-3277    [122] ...2. 91946.796690: Another syscall: recvmsg
  ...
You can run this either on a Linux machine with Java 21 and libbcc installed or on Mac using the Lima VM:
In this blog post, I showed you how to use tail calls and develop your first standalone eBPF application using the hello-ebpf library. Most of the bcc implementation was present two weeks ago when I wrote my previous blog post of this series, but now it’s slightly more polished. The hello-ebpf libaries’ releases are currently live in the snapshot repository.
Now, on to you: There are exercises at the end of chapter 2 of the Learning eBPF book. Can you implement them on your own? Clone the sample-bcc-project and give it a try. I’m happy to showcase any cool forks in my next blog post.
Thanks for joining me on this journey to create a proper Java API for eBPF. I’m looking forward to finishing porting the whole bcc API and starting with the next iteration of this project. I’ll keep you posted; see you in my next post.
This article is part of my work in the SapMachine team at SAP, making profiling and debugging easier for everyone.
A few months ago, I told you about the onjcmd feature in my blog post Level-up your Java Debugging Skills with on-demand Debugging (which is coming to JavaLand 2024). The short version is that adding onjcmd=y to the list of JDWP options allows you to delay accepting the incoming connection request in the JDWP agent until jcmd <JVM pid> VM.start_java_debugging is called.
The main idea is that the JDWP agent
only listens on the debugging port after it is triggered, which could have some security benefits
and that the JDWP agent causes less overhead while waiting, compared to just accepting connections from the beginning.
The first point is debatable; one can find arguments for and against it. But for the second point, we can run some benchmarks. After renewed discussions, I started benchmarking to conclude whether the onjcmd feature improves on-demand debugging performance. Spoiler alert: It doesn’t.
Renaissance is a modern, open, and diversified benchmark suite for the JVM, aimed at testing JIT compilers, garbage collectors, profilers, analyzers and other tools.
Renaissance is a benchmarking suite that contains a range of modern workloads, comprising of various popular systems, frameworks and applications made for the JVM.
Renaissance benchmarks exercise a range of programming paradigms, including concurrent, parallel, functional and object-oriented programming.
Renaissance typically runs the sub-benchmarks in multiple iterations. Still, I decided to run the sub-benchmarks just once per Renaissance run (via -r 1) and instead run Renaissance itself ten times using hyperfine to get a proper run-time distribution. I compared three different executions of Renaissance for this blog post:
without JDWP: Running Renaissance without any debugging enabled, to have an appropriate baseline, via java -jar renaissance.jar all -r 1
with JDWP: Running Renaissance in debugging mode, with the JDWP agent accepting debugging connections the whole time without suspending the JVM, via java -agentlib:jdwp=transport=dt_socket,server=y,suspend=n,address=*:5005 -jar renaissance.jar all -r 1
with onjcmd: Running Renaissance in debugging mode, with the JDWP agent accepting debugging connections only after the jcmd call without suspending the JVM, via java -agentlib:jdwp=transport=dt_socket,server=y,suspend=n,onjcmd=y,address=*:5005 -jar renaissance.jar all -r 1
Remember that we never start a debugging session or use jcmd, as we’re only interested in the performance of the JVM while waiting for a debugging connection in the JDWP agent.
Yes, I know that Renaissance uses different iteration numbers for the sub-benchmarks, but this should not affect the overall conclusions from the benchmark.
Results
Now to the results. For a current JDK 21 on my Ubuntu 23.10 machine with a ThreadRipper 3995WX CPU, hyperfine obtains the following benchmarks:
Benchmark 1: without JDWP
  Time (mean ± σ):     211.075 s ±  1.307 s    [User: 4413.810 s, System: 1438.235 s]
  Range (min … max):   209.667 s … 213.361 s    10 runs

Benchmark 2: with JDWP
  Time (mean ± σ):     218.985 s ±  1.924 s    [User: 4533.024 s, System: 1133.126 s]
  Range (min … max):   216.673 s … 222.249 s    10 runs

Benchmark 3: with onjcmd
  Time (mean ± σ):     219.469 s ±  1.185 s    [User: 4537.213 s, System: 1181.856 s]
  Range (min … max):   217.824 s … 221.316 s    10 runs

Summary
  "without JDWP" ran
    1.04 ± 0.01 times faster than "with JDWP"
    1.04 ± 0.01 times faster than "with onjcmd"
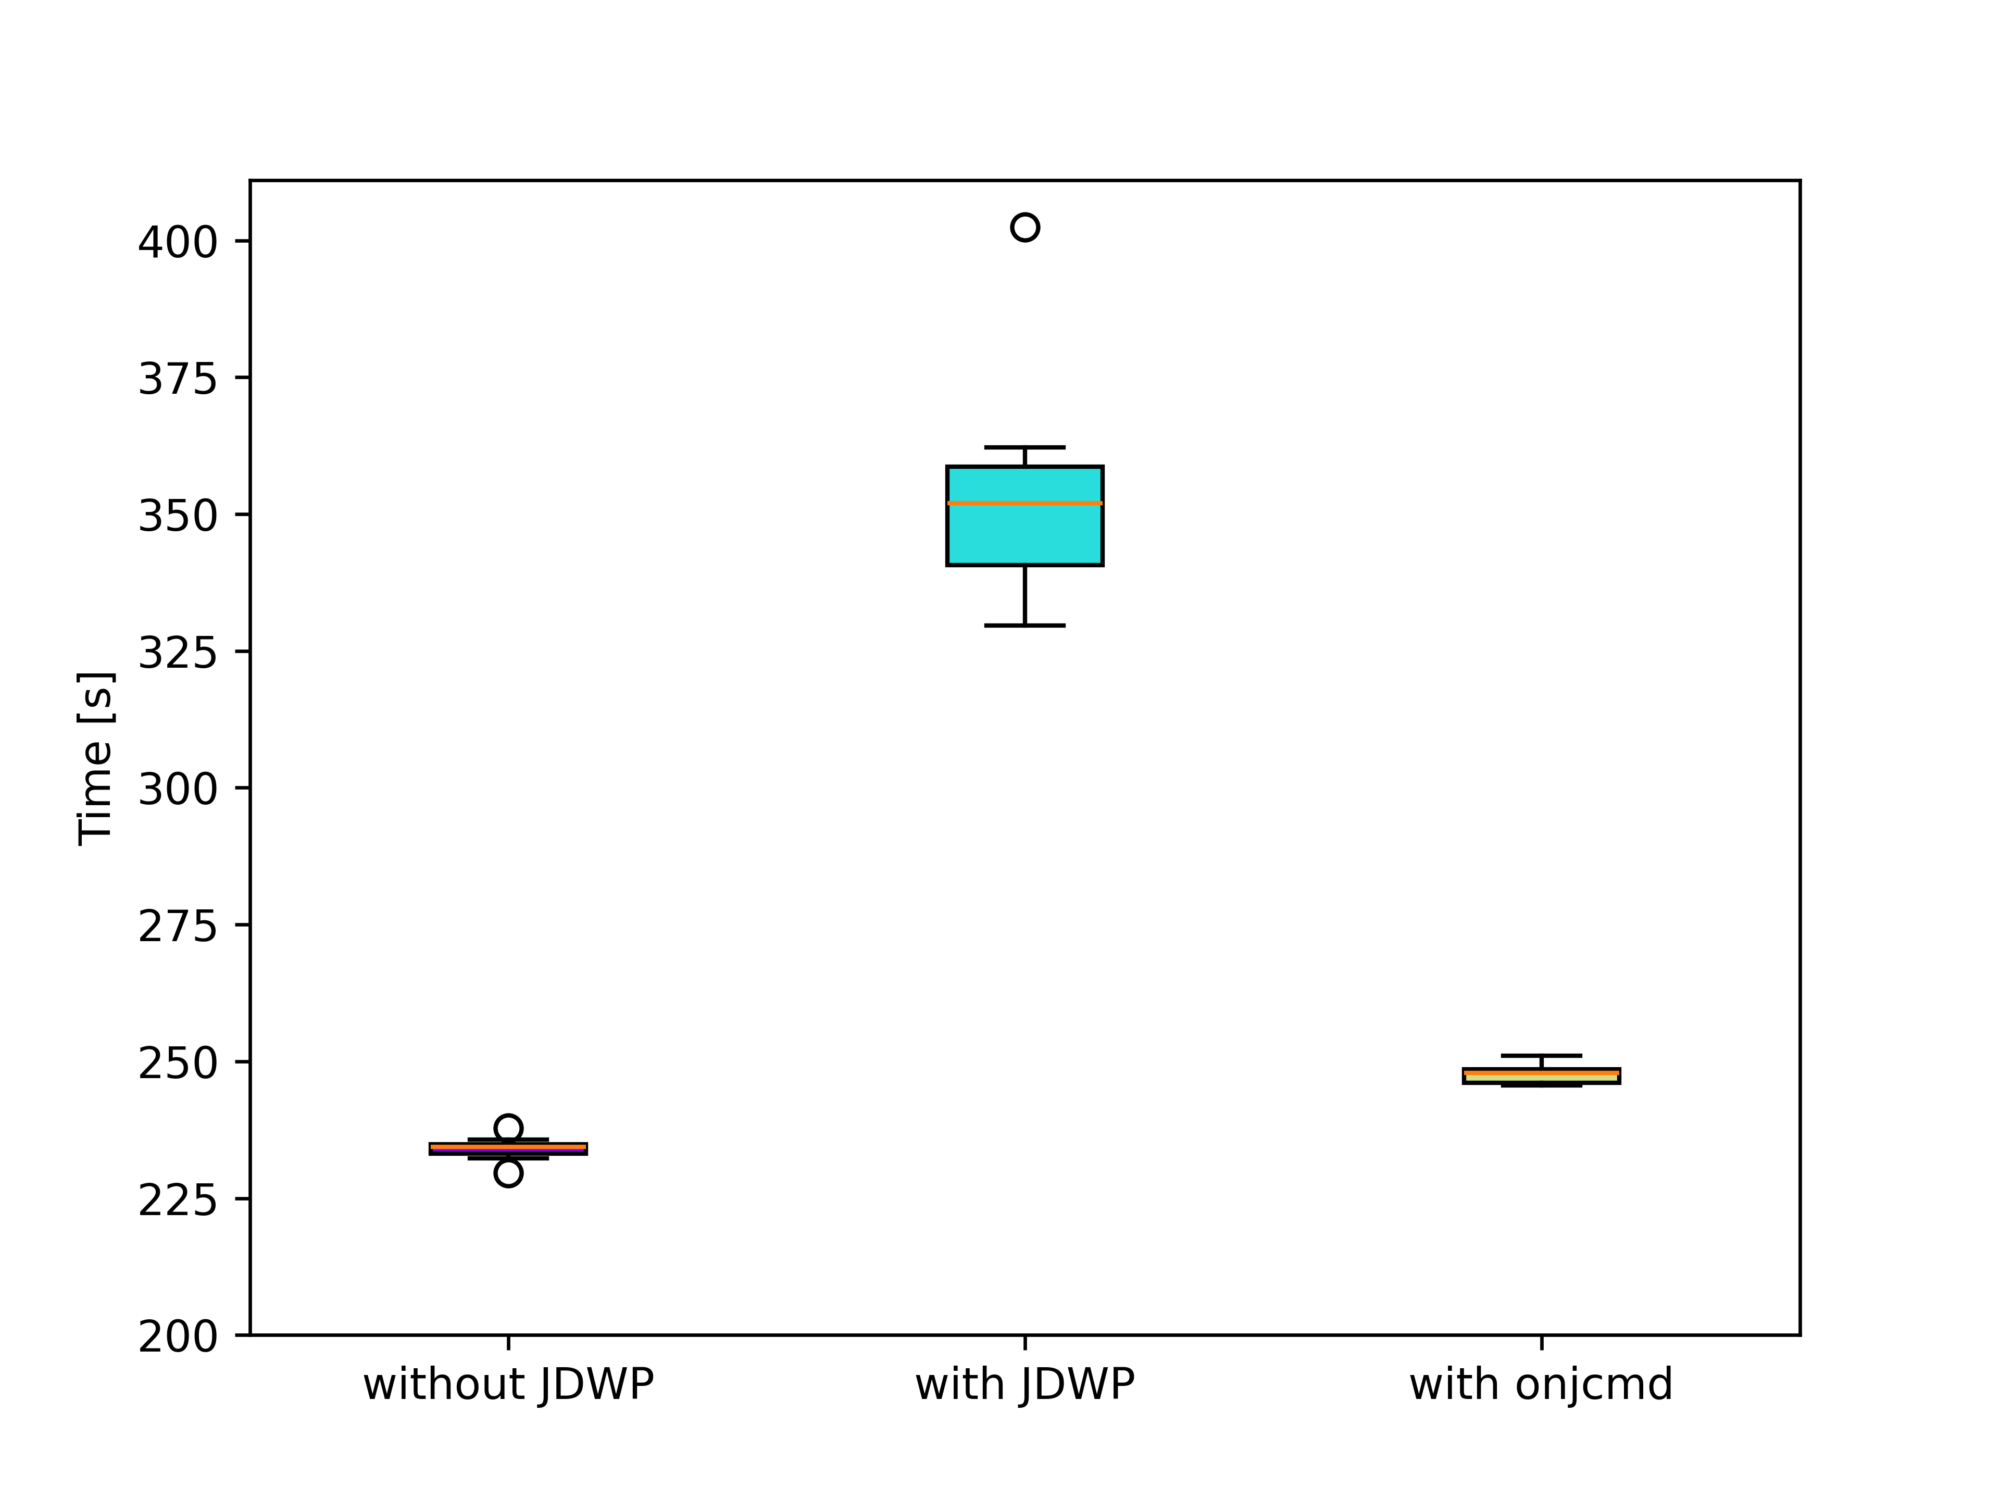
You can see that the run-time difference between “with JDWP” and “with onjcmd” is 0.5s, way below the standard deviations of both benchmarks. Plotting the benchmark results using box plots visualizes this fact:
Or, more analytically, Welch’s t-test doesn’t rule out the possibility of both benchmarks producing the same run-time distribution with p=0.5. There is, therefore, no measurable effect on the performance if we use the onjcmd feature. But what we do notice is that enabling the JDWP agent results in an increase in the run-time by 4%.
The question is then: Why has it been implemented in the JDK at all? Let’s run Renaissance on JDK 11.0.3, the first release supporting onjcmd.
Results on JDK 11.0.3
Here, using onjcmd results in a significant performance improvement of a factor of 1.5 (from 354 to 248 seconds) compared to running the JDWP agent without it:
Benchmark 1: without JDWP
  Time (mean ± σ):     234.011 s ±  2.182 s    [User: 5336.885 s, System: 706.926 s]
  Range (min … max):   229.605 s … 237.845 s    10 runs

Benchmark 2: with JDWP
  Time (mean ± σ):     353.572 s ± 20.300 s    [User: 4680.987 s, System: 643.978 s]
  Range (min … max):   329.610 s … 402.410 s    10 runs

Benchmark 3: with onjcmd
  Time (mean ± σ):     247.766 s ±  1.907 s    [User: 4690.555 s, System: 609.904 s]
  Range (min … max):   245.575 s … 251.026 s    10 runs
Summary
  "without JDWP" ran
    1.06 ± 0.01 times faster than "with onjcmd"
    1.51 ± 0.09 times faster than "with JDWP"
We excluded the finagle-chirper sub-benchmark here, as it causes the run-time to increase drastically. The sub-benchmark alone does not cause any problems, so the GC run possibly causes the performance hit before the sub-benchmark, which cleans up after the dotty sub-benchmark. Dotty is run directly before finagle-chirper.
Please be aware that the run sub-benchmarks on JDK 11 differ from the run on JDK 21, so don’t compare it to the results for JDK 21.
But what explains this difference?
Fixes since JDK 11.0.3
Between JDK 11.0.3 and JDK 21, there have been improvements to the OpenJDK, some of which drastically improved the performance of the JVM in debugging mode. Most notable is the fix for JDK-8227269 by Roman Kennke. The issue, reported by Egor Ushakov, reads as follows:
Slow class loading when running with JDWP
When debug mode is active (-agentlib:jdwp), an application spends a lot of time in JVM internals like Unsafe.defineAnonymousClass or Class.getDeclaredConstructors.Sometimes this happens on EDT and UI freezes occur.
If we look into the code, we’ll see that whenever a new class is loaded and an event about it is delivered, when a garbage collection has occurred, classTrack_processUnloads iterates over all loaded classes to see if any of them have been unloaded. This leads to O(classCount * gcCount) performance, which in case of frequent GCs (and they are frequent, especially the minor ones) is close to O(classCount^2). In IDEA, we have quite a lot of classes, especially counting all lambdas, so this results in quite significant overhead.
This change came into the JDK with 11.0.9. We see the 11.0.3 results with 11.0.8, but with 11.0.9, we see the results of the current JDK 11:
Benchmark 1: without JDWP
  Time (mean ± σ):     234.647 s ±  2.731 s    [User: 5331.145 s, System: 701.760 s]
  Range (min … max):   228.510 s … 238.323 s    10 runs

Benchmark 2: with JDWP
  Time (mean ± σ):     250.043 s ±  3.587 s    [User: 4628.578 s, System: 716.737 s]
  Range (min … max):   242.515 s … 254.456 s    10 runs

Benchmark 3: with onjcmd
  Time (mean ± σ):     249.689 s ±  1.765 s    [User: 4788.539 s, System: 729.207 s]
  Range (min … max):   246.324 s … 251.559 s    10 runs

Summary
  "without JDWP" ran
    1.06 ± 0.01 times faster than "with onjcmd"
    1.07 ± 0.02 times faster than "with JDWP"
This clearly shows the significant impact of the change. 11.0.3 came out on Apr 18, 2019, and 11.0.9 on Jul 15, 2020, so the onjcmd improved on-demand debugging for almost a year.
Want to try this out yourself? Get the binaries from SapMachine and run the benchmarks yourself. This kind of performance archaeology is quite rewarding, giving you insights into critical performance issues.
Conclusion
A few years ago, it was definitely a good idea to add the onjcmd feature to have usable on-demand debugging performance-wise. But nowadays, we can just start the JDWP agent to wait for a connection and connect to it whenever we want to, without any measurable performance penalty (in the Renaissance benchmark).
This shows us that it is always valuable to reevaluate if specific features are worth the maintenance cost. I hope this blog post gave you some insights into the performance of on-demand debugging. See you next week for the next installment in my hello-ebpf series.
This article is part of my work in the SapMachine team at SAP, making profiling and debugging easier for everyone.