Let’s create a Python Debugger together: Part 4 (Python 3.12 edition)

The fourth part of my journey down the Python debugger rabbit hole (part 1, part 2, and part 3).

In this article, we’ll be looking into how changes introduced in Python 3.12 can help us with one of the most significant pain points of our current debugger implementation: The Python interpreter essentially calls our callback at every line of code, regardless if we have a breakpoint in the currently running method. But why is this the case?

Continue reading

Let’s create a Python Debugger together: Part 3 (Refactoring)

This is the necessary third part of my journey down the Python debugger rabbit hole; if you’re new to the series, please take a look at part 1 and part 2 first.

I promised in the last part of this series that I’ll show you how to use the new Python APIs. However, some code refactoring is necessary before I can finally proceed. The implementation in dbg.py mixes the sys.settrace related code and code that can be reused for other debugging implementations. So, this is a short blog post covering the result of the refactoring. The code can be found in dbg2.py.

Continue reading

Who killed the JVM? Attaching a debugger twice

A few weeks back, I told you about on-demand debugging in my Level-up your Java Debugging Skills with on-demand Debugging blog post, enabling you to delay a debugging session till:

  • You gave orders via jcmd (onjcmd=y option), a feature contributed by the SapMachine team
  • the program threw a specific exception (onthrow=<exception>)
  • The program threw an uncaught exception (onuncaught=y)

This is quite useful because the JDWP agent has to do substantial initialization before it can start listening for the attaching debugger:

The triggering event invokes the bulk of the initialization, including creation of threads and monitors, transport setup, and installation of a new event callback which handles the complete set of events.

Comment in JDWP-agent Source Code

Other things, like class loading, were slower with an attached debugger in older JDK versions (see JDK-8227269).

But what happens after you end the debugging session? Is your debugged program aborted, and if not, can you reattach your debugger at a later point in time? The answer is as always: It depends. Or, more precisely: It depends on the remote debugger you’re using and how you terminate the debugging session.

But why should you disconnect and then reattach a debugger? It allows you to not run the debugger during longer ignorable stretches of your application’s execution. The overhead of running the JDWP agent waiting for a connection is minimal compared to the plethora of events sent from the agent to the debugger during a debugging session (like class loading events, see A short primer on Java debugging internals).

Before we cover how to (re)attach a debugger in IDEs, we’ll see how this works on the JDWP/JDI level:

On JVM Level

The JDWP agent does not prevent the debugger from reattaching. There are two ways that Debugging sessions can be closed by the debugger: dispose and exit. Disposing of a connection via the JDWP Dispose command is the least intrusive way. This command is exposed to the debugger in JDI via the VirtualMachine#dispose() method:

Invalidates this virtual machine mirror. The communication channel to the target VM is closed, and the target VM prepares to accept another subsequent connection from this debugger or another debugger, including the following tasks:

Any current method invocations executing in the target VM are continued after the disconnection. Upon completion of any such method invocation, the invoking thread continues from the location where it was originally stopped.

JDI Documentation

This essentially means that disposing of a debugging connection does not prevent the currently debugged application from continuing to run.

The other way is using the exit command, exposed as VirtualMachine#exit(int exitCode):

Causes the mirrored VM to terminate with the given error code. All resources associated with this VirtualMachine are freed. If the mirrored VM is remote, the communication channel to it will be closed.

JDI DOCUMENTATION

This, of course, prevents the debugger from reattaching.

Reattaching with IDEs

NetBeans, IntelliJ IDEA, and Eclipse all support reattaching after ending a debugging session by just creating a new remote debugging session. Be aware that this only works straightforwardly when using remote debugging, as the local debugging UI is usually directly intertwined with the UI for running the application. I would recommend trying remote debugging once in a while, even when debugging on your local machine, to be able to use all the advanced features.

Terminating an Application with IDEs

NetBeans is the only IDE of the three that does not support this (as far as I can ascertain). IntelliJ IDEA and Eclipse both support it, with Eclipse having the more straight-forward UI:

If the terminate button is not active, then you might have to tick the Allow termination of remote VM check-box in the remote configuration settings:

IntelliJ IDEA’s UI is, in this instance, arguably less discoverable: To terminate the application, you have to close the specific debugging session tab explicitly.

This then results in a popup that offers you the ability to terminate:

Conclusion

The ability to disconnect and then reattach debuggers is helpful for many complex debugging scenarios and can help you debug faster. Being able to terminate the application directly from the debugger is an additional time saver when working with remote debugging sessions. Both are often overlooked gems of Java debugging, showing once more how versatile the JDWP agent and UI debuggers are.

I hope you enjoyed this addendum to my Level-up your Java Debugging Skills with on-demand Debugging blog post. If you want even more debugging from me, come to my talk on debugging at JUG Karlsruhe on the 7th of November, to the ConFoo conference in Montreal on the 23rd of February, and hopefully, next year a conference or user group near you.

This article is part of my work in the SapMachine team at SAP, making profiling and debugging easier for everyone. It was supported by rainy weather and the subsequent afternoon in a cafe in Bratislava:

Loom is just HyperThreading in Java

While sitting in Cay Horstmann‘s “Looming Changes in Java Concurrency” talk at BaselOne, I had an epiphany: Aren’t virtual threads with Loom just a version of HyperThreading on the JVM?

Both try to utilize a computation resource fully, be it hardware core or platform thread, by multiplexing multiple tasks onto it, despite many tasks waiting regularly for IO operations to complete:

When one task waits, another can be scheduled, improving overall throughput. This works especially well when longer IO operations follow short bursts of computation.

There are, of course, differences between the two, most notably: HyperThreading doesn’t need the tasks to cooperate, as Loom does, so a virtual core can’t starve other virtual cores. Also noteworthy is that the scheduler for Hyper-Threading is implemented in silicon and cannot be configured or even changed, while the virtual thread execution can be targeted to one’s needs.

I hope you found this small insight helpful in understanding virtual threads and putting them into context. You can find more about these topics in resources like JEP 444 (Virtual Threads) and the “Hyper-Threading Technology Architecture and Microarchitecture” paper.

This article is part of my work in the SapMachine team at SAP, making profiling and debugging easier for everyone.

Putting JFR into Context

Have you ever wanted to bring your JFR events into context? Adding information on sessions, user IDs, and more can improve your ability to make sense of all the events in your profile. Currently, we can only add context by creating custom JFR events, as I presented in my Profiling Talks:

We can use these custom events (see Custom JFR Events: A Short Introduction and Custom Events in the Blocky World: Using JFR in Minecraft) to store away the information and later relate them to all the other events by using the event’s time, duration, and thread. This works out-of-the-box but has one major problem: Relating events is quite fuzzy, as time stamps are not as accurate (see JFR Timestamps and System.nanoTime), and we do all of this in post-processing.

But couldn’t we just attach some context to every JFR event we’re interested in? Not yet, but Jaroslav Bachorik from DataDog is working on it. Recently, he wrote three blog posts (1, 2, 3). The following is a different take on his idea, showing how to use it in a small file server example.

The main idea of Jaroslav’s approach is to store a context in thread-local memory and attach it to every JFR event as configured. But before I dive into the custom context, I want to show you the example program, which you can find, as always, MIT-licensed on GitHub.

Example

We create a simple file server via Javalin, which allows a user to

  • Register (URL schema register/{user})
  • Store data in a file (store/{user}/{file}/{content})
  • Retrieve file content (load/{user}/{file})
  • Delete files (delete/{user}/{file})

The URLs are simple to use, and we don’t bother about error handling, user authentication, or large files, as this would complicate our example. I leave it as an exercise for the inclined reader. The following is the most essential part of the application: the server declaration:

FileStorage storage = new FileStorage();                                                               
try (Javalin lin = Javalin.create(conf -> {                                                            
            conf.jetty.server(() ->                                                                    
                    new Server(new QueuedThreadPool(4))                                                
            );                                                                                         
        })                                                                                             
        .exception(Exception.class, (e, ctx) -> {                                                      
            ctx.status(500);                                                                           
            ctx.result("Error: " + e.getMessage());                                                    
            e.printStackTrace();                                                                       
        })                                                                                             
        .get("/register/{user}", ctx -> {                                                              
            String user = ctx.pathParam("user");                                                       
            storage.register(user);                                                                    
            ctx.result("registered");                                                                  
        })                                                                                             
        .get("/store/{user}/{file}/{content}", ctx -> {                                                
            String user = ctx.pathParam("user");                                                       
            String file = ctx.pathParam("file");                                                       
            storage.store(user, file, ctx.pathParam("content"));                                       
            ctx.result("stored");                                                                      
        })                                                                                             
        .get("/load/{user}/{file}", ctx -> {                                                           
            String user = ctx.pathParam("user");                                                       
            String file = ctx.pathParam("file");                                                       
            ctx.result(storage.load(user, file));                                                      
        })                                                                                             
        .get("/delete/{user}/{file}", ctx -> {                                                         
            String user = ctx.pathParam("user");                                                       
            String file = ctx.pathParam("file");                                                       
            storage.delete(user, file);                                                                
            ctx.result("deleted");                                                                     
        })) {                                                                                          
    lin.start(port);                                                                                   
    Thread.sleep(100000000);                                                                           
} catch (InterruptedException ignored) {                                                               
}                                                                                                      

This example runs on Jaroslav’s OpenJDK fork (commit 6ea2b4f), so if you want to run it in its complete form, please build the fork and make sure that you’re PATH and JAVA_HOME environment variables are set accordingly.

You can build the server using mvn package and
start it, listening on the port 1000, via:

java -jar target/jfr-context-example.jar 1000

You can then use it via your browser or curl:

# start the server
java -XX:StartFlightRecording=filename=flight.jfr,settings=config.jfc \
-jar target/jfr-context-example.jar 1000 &
pid=$!

# register a user
curl http://localhost:1000/register/moe

# store a file
curl http://localhost:1000/store/moe/hello_file/Hello

# load the file
curl http://localhost:1000/load/moe/hello_file
-> Hello

# delete the file
curl http://localhost:1000/delete/moe/hello_file

kill $pid

# this results in the flight.jfr file

To make testing easier, I created the test.sh script, which starts the server, registers a few users and stores, loads, and deletes a few files, creating a JFR file along the way. We're using a custom JFR configuration to enable the IO events without any threshold. This is not recommended for production but is required in our toy example to get any such event:

<?xml version="1.0" encoding="UTF-8"?>

<configuration version="2.0" label="Custom" description="Custom config for the example"
  provider="Johannes Bechberger">
    <event name="jdk.FileRead" withContext="true">
        <setting name="enabled">true</setting>
        <setting name="stackTrace">true</setting>
        <setting name="threshold" control="file-threshold">0 ms</setting>
    </event>

    <event name="jdk.FileWrite" withContext="true">
        <setting name="enabled">true</setting>
        <setting name="stackTrace">true</setting>
        <setting name="threshold" control="file-threshold">0 ms</setting>
    </event>
</configuration>

We can use the jfr tool to easily print all the jdk.FileRead events from the created flight.jfr file in JSON format:

jfr print --events jdk.FileRead --json flight.jfr

This prints a list of events like:

{
  "type": "jdk.FileRead", 
  "values": {
    "startTime": "2023-10-18T14:31:56.369071625+02:00", 
    "duration": "PT0.000013042S", 
    "eventThread": {
      "osName": "qtp2119992687-32", 
      ...
    }, 
    "stackTrace": {
      "truncated": false, 
      "frames": [...]
    }, 
    "path": "\/var\/folders\/nd\/b8fyk_lx25b1ndyj4kmb2hk403cmxz\/T\/tmp13266469351066000997\/moe\/test_1", 
    "bytesRead": 8, 
    "endOfFile": false
  }
}

You can find more information on this and other events in my JFR Event Collection:

There are, of course, other events, but in our file server example, we’re only interested in file events for now (this might change as Jaroslav adds more features to his fork).

Now, we can start bringing the events into context.

Adding Custom Context

Before we can add the context, we have to define it, as described in Jaroslav’s blog post. We create a context that stores the current user, action, trace ID, and optional file:

@Name("tracer-context")
@Description("Tracer context type tuple")
public class TracerContextType extends ContextType implements AutoCloseable {

    private static final AtomicLong traceIdCounter = new AtomicLong(0);

    // attributes are defined as plain public fields annotated by at least @Name annotation
    @Name("user")
    @Description("Registered user")
    public String user;

    @Name("action")
    @Description("Action: register, store, load, delete")
    public String action;

    @Name("file")
    @Description("File if passed")
    public String file;

    // currently no primitives allowed here
    @Name("trace")
    public String traceId;

    public TracerContextType(String user, String action, String file) {
        this.user = user;
        this.action = action;
        this.file = file;
        this.traceId = "" + traceIdCounter.incrementAndGet();
        this.set();
    }

    public TracerContextType(String user, String action) {
        this(user, action,"");
    }

    @Override
    public void close() throws Exception {
        unset();
    }
}

A context has to be set and then later unset, which can be cumbersome in the face of exceptions. Implementing the AutoClosable interface solves this by allowing us to wrap code in a try-with-resources statement:

try (var t = new TracerContextType(/* ... */)) {
    // ...
}

All JFR events with enabled context that happen in the body of the statement are associated with the TracerContextType instance. We can use the code of all request handlers in our server with such a construct, e.g.:

.get("/store/{user}/{file}/{content}", ctx -> {                 
    String user = ctx.pathParam("user");                        
    String file = ctx.pathParam("file");                        
    try (var t = new TracerContextType(user, "store", file)) {  
        storage.store(user, file, ctx.pathParam("content"));    
        ctx.result("stored");                                   
    }                                                           
})                                                              

One last thing before we can analyze the annotated events: JFR has to know about your context before the recording starts. We do this by creating a registration class registered as a service.

@AutoService(ContextType.Registration.class)
public class TraceContextTypeRegistration implements ContextType.Registration {

    @Override
    public Stream<Class<? extends ContextType>> types() {
        return Stream.of(TracerContextType.class);
    }
}

We use the auto-service project by Google to automatically create the required build files (read more in this blog post by Pedro Rijo.

Using the Custom Context

After adding the context, we can see it in the jdk.FileRead events:

{
  "type": "jdk.FileRead", 
  "values": {
    "startTime": "2023-10-18T14:31:56.369071625+02:00", 
    "duration": "PT0.000013042S", 
    "eventThread": {
      "osName": "qtp2119992687-32", 
      ...
    }, 
    "stackTrace": {
      "truncated": false, 
      "frames": [...]
    }, 
    "tracer-context_user": "moe", 
    "tracer-context_action": "load", 
    "tracer-context_file": "test_1", 
    "tracer-context_trace": "114", 
    "path": "\/var\/folders\/nd\/b8fyk_lx25b1ndyj4kmb2hk403cmxz\/T\/tmp13266469351066000997\/moe\/test_1", 
    "bytesRead": 8, 
    "endOfFile": false
  }
}

We clearly see the stored context information (tracer-context_*).

Using the jq tool, we can analyze the events, like calculating how many bytes the server has read for each user:

➜ jfr print --events jdk.FileRead --json flight.jfr |
  jq -r '
    .recording.events
    | group_by(.values."tracer-context_user")
    | map({
      user: .[0].values."tracer-context_user",
      bytesRead: (map(.values.bytesRead) | add)
    })
   | map([.user, .bytesRead])
   | ["User", "Bytes Read"]
   , .[]
   | @tsv
 '
User    Bytes Read
        3390101
bob     80
curly   100
frank   100
joe     80
john    90
larry   100
mary    90
moe     80
sally   100
sue     80

The empty user is for all the bytes read unrelated to any specific user (like class files), which is quite helpful.

Conclusion

This small example is just a glimpse of what is possible with JFR contexts. Jaroslav’s prototypical implementation is still limited; it, e.g., doesn’t support contexts at method sampling events, but it is already a significant improvement over the status quo. I’ll be creating follow-up blog posts as the prototype evolves and matures.

Thanks for coming so far, and see you next week for another blog post and maybe at a meet-up or conference (see Talks).

This article is part of my work in the SapMachine team at SAP, making profiling and debugging easier for everyone.

JDWP, onthrow and a mysterious error

In my previous Java-related blog post called Level-up your Java Debugging Skills with on-demand Debugging, I showed you how to use the onthrow option of the JDWP agent to start the debugging session on the first throw of a specific exception. This gave us a mysterious error in JDB:

And I asked if somebody had any ideas. No one had, but I was at Devoxx Belgium and happened to talk with Aleksey Shipilev about it at the Corretto booth:

Two OpenJDK developers having fun at Devoxx: Investigating a jdb bug with Shipilev
in the Coretto booth (Tweet)

We got a rough idea of what was happening, and now that I’m back from Devoxx, I have the time to investigate it properly. But to recap: How can you use the onthrow option and reproduce the bug?

Recap

We use a simple example program with throws and catches the exception Ex twice:

public class OnThrowAndJCmd {

    public static void main(String[] args) throws InterruptedException {
        System.out.println("Hello world!");
        try {
            throw new Ex("");
        } catch (Ex e) {
            System.out.println("Caught");
        }
        try {
            throw new Ex("");
        } catch (Ex e) {
            System.out.println("Caught");
        }
        for (int i = 0; i < 1000; i++) {
            System.out.print(i + " ");
            Thread.sleep(2000);
        }
    }
}

class Ex extends RuntimeException {
    public Ex(String msg) {
        super(msg);
    }
}

We then use one terminal to run the program with the JDWP agent attached and the other to run JDB:

java "-agentlib:jdwp=transport=dt_socket,server=y,suspend=y,address=*:5005,onthrow=Ex,launch=exit" src/test/java/OnThrowAndJCmd.java

# in another terminal
jdb -attach 5005

Then JDB prints us the expected error trace:

Exception in thread "event-handler" java.lang.NullPointerException: Cannot invoke "com.sun.jdi.ObjectReference.referenceType()" because the return value of "com.sun.jdi.event.ExceptionEvent.exception()" is null
        at jdk.jdi/com.sun.tools.example.debug.tty.TTY.exceptionEvent(TTY.java:171)
        at jdk.jdi/com.sun.tools.example.debug.tty.EventHandler.exceptionEvent(EventHandler.java:295)
        at jdk.jdi/com.sun.tools.example.debug.tty.EventHandler.handleEvent(EventHandler.java:133)
        at jdk.jdi/com.sun.tools.example.debug.tty.EventHandler.run(EventHandler.java:78)
        at java.base/java.lang.Thread.run(Thread.java:1583)

This might be, and I’m foreshadowing, the reason why IDEs like IntelliJ IDEA don’t support attaching to a JDWP agent with onthrow enabled.

Remember that this issue might be fixed with your current JDK; the bug is reproducible with a JDK build older than the 10th of October.

Update: This bug does not appear in JDK 1.4, but in JDK 1.5 and ever since.

Looking for the culprit

In our preliminary investigation, Aleksey and I realized that JDB was probably not to blame. The problem is that the JDWP-agent sends an exception event after JDB is attached, related to the thrown Ex exception, but this event does not adhere to the specification. The JDWP specification tells us that every exception event contains the following:

TypeNameDescription
intrequestIDRequest that generated event 
threadIDthreadThread with exception
locationlocationLocation of exception throw (or first non-native location after throw if thrown from a native method) 
tagged-objectIDexceptionThrown exception 
locationcatchLocationLocation of catch, or 0 if not caught. An exception is considered to be caught if, at the point of the throw, the current location is dynamically enclosed in a try statement that handles the exception. […]

So clearly, none of the properties should be null in our case. Exception events are written in the writeExceptionEvent method of the JDWP agent. We can modify this method to print all accessed exception fields and check that the problem really is related to the agent. For good measure, we also tell JDB to get notified of all other triggered Ex exceptions (> catch Ex), so we can obtain the printed information for the initial and the second exception:

Exception event: 
    thread: 0x0
    clazz: 0x0
    method: 0x0
    location: 0
    object: 0x0
    catch_clazz: 0x0
    catch_method: 0x0
    catch_location: 0
Caught
Exception event: 
    thread: 0x12b50fb02
    clazz: 0x12b50fb0a
    method: 0x12b188290
    location: 36
    object: 0x12b50fb12
    catch_clazz: 0x12b50fb1a
    catch_method: 0x12b188290
    catch_location: 37

This clearly shows that the exception that started the debugging session was not sent correctly.

How does onthrow work?

When the JDWP agent starts, it registers a JVMTI Exception event callback called cbEarlyException via SetEventCallBacks:

void JNICALL Exception(
  jvmtiEnv *jvmti_env,
  JNIEnv* jni_env, 
  jthread thread,
  jmethodID method, 
  jlocation location, 
  jobject exception, 
  jmethodID catch_method, 
  jlocation catch_location)

Exception events are generated whenever an exception is first detected in a Java programming language method.

JVMTI Documentation

On every exception, this handler checks if the exception has the name passed to the onthrow option. If the exception matches, then the agent initializes the debugging session:

The only problem here is that cbEarlyException is passed all the exception information but doesn’t pass it to the initialize method. This causes the JDWP-agent to send out an Exception event with all fields being null, as you saw in the previous section.

Fixing the bug

Now that we know exactly what went wrong, we can create an issue in the official JDK Bug System (JDK-8317920). Then, we can fix it by creating the event in the cbEarlyException handler itself and passing it to the new opt_info parameter of the initialize method (see GitHub):

static void JNICALL
cbEarlyException(jvmtiEnv *jvmti_env, JNIEnv *env,
        jthread thread, jmethodID method, jlocation location,
        jobject exception,
        jmethodID catch_method, jlocation catch_location)
{
    // ...
    EventInfo info;
    info.ei = EI_EXCEPTION;
    info.thread = thread;
    info.clazz = JNI_FUNC_PTR(env,GetObjectClass)(env, exception);
    info.method = method;
    info.location = location;
    info.object = exception;
    if (gdata->vthreadsSupported) {
        info.is_vthread = isVThread(thread);
    }
    info.u.exception.catch_clazz = getMethodClass(jvmti_env, catch_method);
    info.u.exception.catch_method = catch_method;
    info.u.exception.catch_location = catch_location;
    // ... // check if exception matches
    initialize(env, thread, EI_EXCEPTION, &info);
    // ...
}

The related Pull Request on GitHub is #16145. It will hopefully be merged soon. The last time someone reported and fixed an issue related to the onthrow option was in early 2002, so it is the first change in more than 20 years. The issue was about onthrow requiring the launch option to be present.

It works (even with your IDE)

With this fix in place, it works. JDB even selects the main thread as the current thread:

➜ jdb -attach 5005
Set uncaught java.lang.Throwable
Set deferred uncaught java.lang.Throwable
Initializing jdb ...
> 
Exception occurred: Ex (to be caught at: OnThrowAndJCmd.main(), line=7 bci=18)"thread=main", OnThrowAndJCmd.main(), line=6 bci=17

main[1]

But does fixing this issue also mean that IDEs like IntelliJ IDEA now support attaching to agents with onthrow enabled? Yes, at least if we set a breakpoint somewhere after the first exception has been thrown (like with the onjcmd option):

Conclusion

Collaborating with other people from different companies in an Open-Source project is great. Aleksey found the bug interesting enough to spend half an hour looking into it with me, which persuaded me to look into it again after returning from Devoxx. Fixing these bugs allows users to fully use on-demand debugging, speeding up their error-finding sessions.

I hope you liked this walk down the rabbit hole. See you next week with another article on debugging or my trip to Devoxx trip (or both). Feel free to ask any questions or to suggest new article ideas.

I’ll be giving a few talks on debugging this autumn; you can find specifics on my Talks page. I’m happy to speak on your meet-up or user group; just let me know.

This article is part of my work in the SapMachine team at SAP, making profiling and debugging easier for everyone.

Let’s create a Python Debugger together: Part 2

The second part of my journey down the Python debugger rabbit hole.

In this blog post, we extend and fix the debugger we created in part 1: We add the capability to

  • single step over code, stepping over lines, into function calls, and out of functions,
  • and adding conditions to breakpoints.

You can find the resulting MIT-licensed code on GitHub in the python-dbg repository in the file dbg.py. I added a README so you can glance at how to use it.

Continue reading

Level-up your Java Debugging Skills with on-demand Debugging

Debugging is one of the most common tasks in software development, so one would assume that all features of debuggers have ample coverage in tutorials and guides. Yet there are three hidden gems of the Java Debugging (JDWP) agent that allow you to delay the start of the debugging session till

  • you gave orders via jcmd (onjcmd=y option)
  • the program threw a specific exception (onthrow=<exception>)
  • the program threw an uncaught exception (onuncaught=y)

Before I tell you more about the specific options, I want to start with the basics of how to apply them:

Option Application

When you debug remotely in your IDE (IntelliJ IDEA in my case), the “Debug Configurations” dialog tells you which options you should pass to your remote JVM:

Just append more options by adding them to the -agentlib option, or by setting the _JAVA_JDWP_OPTIONS environment variable, which is comma-appended to the options.

All options only work correctly in the server mode (server=y) of the JDWP agent (suspend=y or suspend=n seem to exhibit the same behavior with onjcmd).

I’m now showing you how the three hidden gems work:

JCmd triggered debugging

There are often cases where the code that you want to debug is executed later in your program’s run or after a specific issue appears. So don’t waste time running the debugging session from the start of your program, but use the onjcmd=y option to tell the JDWP agent to wait with the debugging session till it is triggered via jcmd:

 ➜ java "-agentlib:jdwp=transport=dt_socket,server=y,suspend=y,address=*:5005,onjcmd=y" src/test/java/OnThrowAndJCmd.java &
 ➜ echo $! # get pid
 # wait some time and then start debugging on demand
 ➜ jcmd $! VM.start_java_debugging
jcmd 97145 VM.start_java_debugging
97145:
Debugging has been started.
Transport : dt_socket
Address : *:5005

jps is your friend if you want to find the process id of an already running JVM.

I created a sample class in my java-dbg repository on GitHub with a small sample program for this article. To use JCmd triggered with our IDE, we first have to create a remote debug configuration (see previous section); we can then start the sample program in the shell and trigger the start of the debugging session. Then, we start the remote debug configuration in the IDE and debug our program:

A similar feature long existed in the SAPJVM. In 2019 Christoph Langer from SAP decided to add it to the OpenJDK, where it was implemented in JDK 12 and has been there ever since. It is one of the many significant contributions of the SapMachine team.

Disclaimer: I’m part of this magnificent team, albeit not in 2019.

Exception triggered debugging

Far older than jcmd triggered are exception-triggered debugging sessions. There are two types:

  1. The throwing of a specific exception (byte-code or normal name, inner classes with $) can start the debugging session by using onthrow=<exception>. This is especially nice if you want to debug the cause of this specific exception. This feature can easily be used in combination with your favorite IDE.
  2. The existence of an uncaught exception can trigger the start of a debugging session by using onuncaught=y. The debugging context is your outermost main method, but it’s still helpful if you want to inspect the exception or the state of your application. A problem is that you cannot use the debuggers from IntelliJ IDEA or NetBeans to explore the context; you have to use the command line debugger jdb instead.

Due to historical reasons, you also have to supply a command that is executed when the debugging session starts via the launch option, but setting it to exit works just fine.

Using both trigger types is similar to the JCmd triggered debugging:

 ➜ java "-agentlib:jdwp=transport=dt_socket,server=y,suspend=y,address=*:5005,onthrow=Ex,launch=exit" src/test/java/OnThrowAndJCmd.java
# or
 ➜ java "-agentlib:jdwp=transport=dt_socket,server=y,suspend=y,address=*:5005,onuncaught=y,launch=exit" src/test/java/OnThrowAndJCmd.java

If you’re okay with using jdb, you can also use the launch option to call a script that starts jdb in a new tmux session, in our case, tmux_jdb.sh:

#!/bin/sh
tmux new-session -d -s jdb -- jdb -attach $2

We run our application using the JDWP agent with the onthrow=Ex,launch=sh tmux_jdb.sh option to start the jdb the first time the Ex exception is thrown and attach to the tmux session:

➜ java "-agentlib:jdwp=transport=dt_socket,server=y,suspend=y,address=*:5005,onthrow=Ex,launch=sh tmux_jdb.sh" src/test/java/OnThrowAndJCmd.java
# in another console after the exception is thrown
➜ tmux attach -t jdb

Where we can explore the current state of the application:

Debugging a specific exception has never been easier.

jdb and the JDWP on* options aren’t as widely used as graphical debuggers, so you might still find some bugs. I don’t know whether the stack trace in the second-to-last screenshot is a bug. Feel free to comment if you know the answer.

How to discover these features

You can either be like me and just drop into the JDK source and look into the debugInit.c file, the official documentation, or you use help option, which prints the following with JDK 21:

➜ java "-agentlib:jdwp=help"
               Java Debugger JDWP Agent Library
               --------------------------------

  (See the "VM Invocation Options" section of the JPDA
   "Connection and Invocation Details" document for more information.)

jdwp usage: java -agentlib:jdwp=[help]|[<option>=<value>, ...]

Option Name and Value            Description                       Default
---------------------            -----------                       -------
suspend=y|n                      wait on startup?                  y
transport=<name>                 transport spec                    none
address=<listen/attach address>  transport spec                    ""
server=y|n                       listen for debugger?              n
launch=<command line>            run debugger on event             none
onthrow=<exception name>         debug on throw                    none
onuncaught=y|n                   debug on any uncaught?            n
onjcmd=y|n                       start debug via jcmd?             n
timeout=<timeout value>          for listen/attach in milliseconds n
includevirtualthreads=y|n        List of all threads includes virtual threads as well as platform threads.
                                                                   n
mutf8=y|n                        output modified utf-8             n
quiet=y|n                        control over terminal messages    n

Obsolete Options
----------------
strict=y|n
stdalloc=y|n

Examples
--------
  - Using sockets connect to a debugger at a specific address:
    java -agentlib:jdwp=transport=dt_socket,address=localhost:8000 ...
  - Using sockets listen for a debugger to attach:
    java -agentlib:jdwp=transport=dt_socket,server=y,suspend=y ...

Notes
-----
  - A timeout value of 0 (the default) is no timeout.

Warnings
--------
  - The older -Xrunjdwp interface can still be used, but will be removed in
    a future release, for example:
        java -Xrunjdwp:[help]|[<option>=<value>, ...]

Of course, this only gives you a glance at the options, so reading the source code still revealed much of what I had before.

Conclusion

Hidden gems are everywhere in the Java ecosystem, even in widely used tools like debugging agents. Especially onthrow and onjcmd can improve the performance of on-demand debugging, as this allows us to trigger the start of the debugging session from outside the debugger.

I hope you can apply your newly gained knowledge the next time you have a complex problem to debug. Still curious about debugging? Come back next week for another blog post.

This article is part of my work in the SapMachine team at SAP, making profiling and debugging easier for everyone. Thanks to Thomas Darimont, with whom I discovered the hidden features while preparing for my talks on Java Debugging. I wrote this article on the train to Devoxx Belgium.

Report of my trip to JavaZone and northern Germany

Between 2nd and 17th September, I gave three talks in three different cities:

I traveled from Karlsruhe to Oslo (via Stuttgart Airport) and from Oslo to Hanover via plane, then to Hamburg, Hanover, back to Hamburg, and the end via Bonn back to Karlsruhe via train:

This was my first time traveling to a conference by plane because traveling to Oslo by train takes far longer (20 hours or more).

This was my second two-week-long tour giving talks, after my tour d’Europe in May/June this year (see Report of my small Tour d’Europe), but this time it consisted solely of talks at conferences. The following is a short report of my trip that saw me brewing beer, giving a talk at one of my favorite conferences, and visiting Hamburg for the first time.

Oslo

I started by traveling to Oslo on Saturday before the conference, which began on Tuesday with workshops. My journey started with the 2:30 am bus from Karlsruhe to Stuttgart, where I took the 6:30 am flight to Paris and from there to Oslo. Flying in the early hours of the morning is something extraordinary:

I’ve never really been to Oslo before, except as a toddler, according to my parents, so I wanted to explore the city. I arrived in Oslo Saturday afternoon and stayed till Tuesday morning at the home of a friendly expat that I met via the couch-surfing platform BeBelcome.org, staying there till Tuesday morning. It was great: I had the opportunity to visit the famous Fram Polar Exploration Museum, hike around the Vettakollen, and brew beer with my host:

JavaZone

Then, on Tuesday, it was time for the workshop day of JavaZone. I’ve been drawn to this conference since I got introduced to their conference trailers in my first semester at university:

So, speaking, there was a great honor; I can recommend this experience to anyone. It is a lovely venue with good food and great organizers who care about their speakers (shout out to Felix Rabe, Rafael Winterhalter, and Marek Machnik).

I started the conference by attending the “A little taste of testing the Java compiler” workshop by Hasnae Rehioui:

Hasnae Rehioui, in her workshop

If you want to start with building the OpenJDK and running JTREG tests, her accompanying website is an excellent place to start.

At the end of the day, I went to the speaker dinner, where I met the organizers and people like Fabian Stäber and Gunnar Morling. The view from the restaurant was majestic:

Then, the next day, the conference began. The conference paid for the hotel during the week. I met Pasha Finkelshtein and Marit van Dijk from JetBrains at the breakfast buffet. I was that day in many talks, including the Maven Puzzlers talk by Andres Almiray and Ixchel Ruiz:

The day ended with eating with a few of my fellow speakers and going to the AweZone party at Himkok bar, but only after a musical performance by Mr. Orkester:

What a great way to inform all JavaZone participants of the looming AweZone event.

The next day was full of talks, including mine and eating great food. I now understand why some people call JavaZone affectionately FoodZone, with all the food served all day. My talk was in the first slot at 9:00 am; I was amazed that around 150 people turned up to attend it after the long night at the bar:

Thank you to Inna Belyantseva for the great Math-as-a-Service logo and valuable feedback on my presentation style in the weeks before the conference.

Later in the day, I went to Theresa Mammarella’s talk on CVEs:

I was introduced to her the evening before, and it was great to see the only other young JDK developer (in her case, OpenJ9) on stage.

In the evening, I ate dinner with a couple of my fellow speakers, including Marit van Dijk, Rustam Mehmandarov, Gerrit Grunwald, Raquel Pau, Tim te Beek, Steve Poole, Alina Yurenko, Theresa Mammarella, Mads Opheim and Ko Turk. Afterward, we went to Himkok bar to relax after two days at the conference:

The next day was my last in Oslo before moving to northern Germany. So I took the chance to explore the city center once more and made a photograph of the speaker’s gift:

A Viking duke in front of the Oslo Stock Exchange

I had to say goodbye to Oslo and then traveled to Hamburg via Hanover Airport to stay with a friend in Hamburg.

Hamburg

The problem was that JavaZone pays the hotel till Friday, and the speaker dinner for Java Forum Nord is Monday evening. I knew someone in Hamburg, so I stayed in Hamburg from Friday night till Monday afternoon. I used the time to look into Python debugging, which eventually resulted in my Let’s create a Python Debugger together: Part 1 blog post, went sightseeing, watched the dark comedy Sophia, der Tod und Ich, and visited the Hamburger Miniaturwunderland:

While there, I had the pleasure of traveling with light luggage, as my luggage didn’t arrive in Hamburg till Wednesday because it was somehow stuck in Amsterdam airport, where I had a stopover.

Java Forum Nord

The second conference on my journey was the Java Forum Nord in Hanover on Tuesday. This conference is a small community-run event, without many sponsors and many talks in German. It was my first German Java conference, so there were many German-only speakers that I hadn’t seen at a conference before. I met a few of them at the speaker’s dinner on Monday and at the after-party on Tuesday:

Speakers’ dinner with alcohol-free beer and Spätzle in Hanover

I enjoyed meeting Marit van Dijk again and getting to know Sandra Parsick and Karl Heinz Marbaise.

The day after, I traveled back to Hamburg for the code.talks conference.

Code.Talks

This was the third conference in a row and the only one without a focus on Java. The talks were on various technologies, from NFTs to creativity. The most memorable of the conference was by far the speaker’s dinner at the open kitchen restaurant Hensslers Küche and visiting the Heavens Bar & Kitchen rooftop bar in St. Pauli with Jacqueline Franßen, Hannes Drittler, and Samir Ar after the second day of the conference:

While there, I also started preparing an upcoming talk for JCon World with Marit van Dijk and had an online meeting with Jaroslav Bachorik and Erik Österlund on the future of my JEP, so stay tuned.

I traveled back to Karlsruhe via Bonn, where I met a good friend and attended a Haydn concert in the Kreuzkirche, closing the eventful two weeks cooking flammkuchen together with her and one of her new flatmates.

Conclusion

Giving three talks at conferences in a row was an experience I’m grateful for. Talking with many new and old acquaintances was, at times, taxing, yet definitely worthwhile. Especially JavaZone was a conference I never dreamt of being able to speak at.

I’m looking forward to giving many more in the future and happy that the SapMachine team at SAP allows me to do so and fully supports me in my endeavors.

If you want to attend one of my talks, just come to Devoxx Belgium, BaselOne, or J-Fall, where I’ll speak this autumn. You can find all the meet-ups and conferences that I’ve confirmed on my Talks page. I’m happy to talk at your meet-up or conference; just ask me.

This project is part of my work in the SapMachine team at SAP, making profiling easier for everyone.

C2 might slow down your builds

At the JavaForumNord two weeks ago, I had a friendly chat with Karl Heinz Marbaise (Chairman of the Apache Maven Project), where he mentioned that he wanted to start profiling maven. This sounded interesting, so I started looking into the performance and bottlenecks of maven. I began by using the Maven build of maven itself as a starting point (excluding the tests). The following is my first observation related to maven builds in CIs.

Maven is one of the most used build systems in the Java ecosystem (JetBrains 2022 survey), and many projects, especially open-source projects, use GitHub Actions to create artifacts and run tests automatically. The free tier of GitHub Actions has two cores (see GitHub docs), so we only have limited parallelism compared to the usual developer machines.

Maven uses the Plexus compiler wrapper Java API around the javax.tools.JavaCompiler API to compile every Java file. The underlying JVM then essentially has three tasks running while compiling:

  • Maven main thread that does the compilation
  • Garbage Collection thread for memory management
  • JIT compilation thread to compile the maven byte code (it’s getting meta), enabling it to run faster (see Mastering the Art of Controlling the JIT: Unlocking Reproducible Profiler Tests for more information). Especially the C2 compiler takes some time. This is our example in a shared thread with the GC.

Small builds

This is problematic on short builds (like building maven itself in 30s), as the C2 JIT does cost a significant amount of cpu-time, more than is saved by the faster execution of the jitted code. The maven self-built, for example, spent more than half of its cpu-time in the C2 compiler:

Maven 4 (f24266eb64) was built with maven 3.8.7 on SapMachine 17.0.8.1 and profiled with async-profiler; click to view the full flame graph

We can use the information by async-profiler to get the cpu-time proportions for significant parts of the built:

Partcpu-time percentagesamples
Launcher.main38 %3200
C2Compiler::compile_method47 %4000
Compiler::compile_method (C1 compiler)8 %650

The whole maven build took 44s (82s cpu-time) on two cores of my ThreadRipper 3995WX. Compare this to a run with a disabled C2 which took 41s (50s cpu-time):

Maven 4 (f24266eb64) built with maven 3.8.7 on SapMachine 17.0.8.1 and MVN_OPTS="-XX:TieredStopAtLevel=1" (but stopping at a higher C1 level is unusual, see dzone) profiled with async-profiler, click to view the full flame graph

The proportions are as expected:

Partcpu-time percentagesamples
Launcher.main71 %3700
C2Compiler::compile_method0 %0
Compiler::compile_method (C1 compiler)14 %750

The time to complete the task changes only by 3s, but the CPU time and, by proxy, the energy use drops significantly. These results are stable over multiple runs with different JDKs.

Side note: Maven only compiles with one thread, compiling with two threads (-T2 option) reduces the build time further by 10 to 15% with C2 and without.

Does this mean that you should always disable C2 in CI builds? No. At a certain project size, the performance increase by the faster, compiled methods outweighs the C2 compilation costs.

Large builds

Take, for example, quarkus: A clean build on two cores runs for 430s (710s cpu-time) with C2 enabled:

Quarkus (af4208a05e) built with maven 3.8.8 on SapMachine 17.0.8.1 and ./mvnd -Dquickly

The runtime proportions are less skewed in the direction of C2:

Partcpu-time percentagesamples
MavenWrapperMain.main45 %39200
C2Compiler::compile_method30 %26200
Compiler::compile_method (C1 compiler)2 %1750

The built without C2 runs in comparison for 880s (1000s cpu-time), so it doesn’t make any sense to disable C2 with this build. For completeness, the proportion table:

Partcpu-time percentagesamples
MavenWrapperMain.main57 %52700
C2Compiler::compile_method0 %0
Compiler::compile_method (C1 compiler)7 %6150

Conclusion

Disabling C2 can be an option to speed up builds of smaller Java applications in CI systems, mainly when restricted to one or two CPU cores. I would recommend exploring this for every maven build that runs under a minute, as it is not too hard to integrate (MVN_OPTS="-XX:TieredStopAtLevel=1"), yet might result in less CPU usage. Preliminary findings also show that it reduces memory usage. But my findings also show that it is not helpful for large builds.

I hope you enjoyed this explorative blog post in the realm of JIT compilation. It’s preliminary research; maybe if there’s enough interest, I can do a more thorough investigation. See you in my next blog post on debugging, which should be ready by the end of this week.

Additional Literature: I would recommend reading Startup, containers & Tiered Compilation by Jean-Philippe Bempel if you want to get another take on the impact of C2 on startup time in constrained environments.

This project is part of my work in the SapMachine team at SAP, making profiling easier for everyone. Thank you to Francesco Nigro for the idea to check whether disabling the JIT improves the build times.

Taming the Bias: Unbiased Safepoint-Based Stack Walking

Walking only at safepoints has advantages: The main one is that you aren’t walking the stack in a signal handler but synchronously to the executed program. Therefore you can allocate memory, acquire locks and rematerialize virtual thread / Loom frames. The latter is significant because virtual threads are the new Java feature that cannot support using signal-handler-based APIs like AsyncGetCallTrace.

This blog post is based on the ideas of Erik Österlund, and the second one is related to these new ideas. The first one is AsyncGetCallTrace Reworked: Frame by Frame with an Iterative Touch!, which you should read before continuing with this post. For a refresher on safepoints, please read The Inner Workings of Safepoints.

Erik summed up the problems with my previous JEP proposal, and in a way with AsyncGetCallTrace, quite nicely:

Well the current proposal doesn’t have a clear story for
1) Making it safe
2) Working with virtual threads
3) Supporting incremental stack scanning
4) Supporting concurrent stack scanning

He proposed that walking Java threads only at safepoints while obtaining some information in the signal handler might do the trick. So I got to work, implementing an API that does just this.

Idea

The current interaction between a sampler of the profiler and the Java Threads looks like the following:

The sampler thread signals every Java thread using POSIX signals and then obtains the full trace directly in the signal handler while the thread is paused at an arbitrary location. I explored variations of this approach in my post Couldn’t we just Use AsyncGetCallTrace in a Separate Thread?

My new approach, on the contrary, walks the Java thread in a signal handler till we find the first bytecode-backed Java frame, stores this in the thread-local queue, triggers a safepoint, and then walks the full Java stack at these safepoints for all enqueued top-frames. We, therefore, have a two-step process:

Instead of just walking the stack in the signal handler:

The new API exploits a few implementation details of the OpenJDK:

  1. There is a safepoint check at least at the end of every non-inlined method (and sometimes there is not, but this is a bug, see The Inner Workings of Safepoints). OpenJ9 doesn’t have checks at returns, so the whole approach I am proposing doesn’t work for them.
  2. When we are at the return of a non-inlined method, we have enough information to obtain all relevant information of the top inlined and the first non-inlined frame using only the program counter, stack pointer, frame pointer, and bytecode pointer obtained in the signal handler. We focus on the first non-inlined method/frame, as inlined methods don’t have physical frames, and walking them would result in walking using Java internal information, which we explicitly want to avoid.

Proposed API

This API builds upon the API defined in jmethodIDs in Profiling: A Tale of Nightmares and the iterator API defined in AsyncGetCallTrace Reworked: Frame by Frame with an Iterative Touch!

But, in contrast to the other parts of the API, this new safepoint-based part only works when the previously defined conditions hold. This is not the case in OpenJ9, so I propose making the new feature optional. But how do profilers know whether an implementation supports an optional part of the API? By using the ASGST_Capabilities:

// Implementations don't have to implement all methods,
// only the iterator related and those that match 
// their capabilities
enum ASGST_Capabilities {
  ASGST_REGISTER_QUEUE = 1, // everything safepoint queue related
  ASGST_MARK_FRAME     = 2  // frame marking related
};

Profilers can query the capability bit map by calling the int ASGST_Capabilities() and should use the signal handler-based approach whenever the capability bit ASGST_REGISTER_QUEUE is absent. ASGST_MARK_FRAME foreshadows a new feature based on stack watermarks, see JEP 376, which I cover in a follow-up blog post. Calling an unsupported API method is undefined.

Now back to the actual API itself. The main two methods of the proposed API are ASGST_RegisterQueue and ASGST_Enqueue. You typically first register a queue for the current thread using ASGST_RegisterQueue, typically in a ThreadStart JVMTI event handler:

typedef void (*ASGST_Handler)(ASGST_Iterator*,
                              void* queue_arg,
                              void* arg);

// Register a queue to the current thread 
// (or the one passed via env)
// @param fun handler called at a safe point with iterators,
//   the argument for RegisterQueue and the argument 
//   passed via Enqueue
//
// The handler can only call safe point safe methods, 
// which excludes all JVMTI methods, but the handler 
// is not called inside a signal handler, so allocating 
// or obtaining locks is possible
//
// Not signal safe, requires ASGST_REGISTER_QUEUE capability
ASGST_Queue* ASGST_RegisterQueue(JNIEnv* env, int size, 
  int options, ASGST_Handler fun, void* argument);

A queue has a fixed size and has a registered handler, which is called for every queue item in insertion order at every safepoint, after which the queue elements are removed. Be aware that you cannot obtain the top frames using the queue handler and cannot call any JVMTI methods, but also that you aren’t bound to signal safe methods in the handler.

The ASGST_Enqueue method obtains and enqueues the top frame into the passed queue, as well as triggering a thread-local handshake/safepoint:

// Enqueue the processing of the current stack 
// at the end of the queue and return the kind 
// (or error if <= 0)
// you have to deal with the top C and native frames 
// yourself (but there is an option for this)
//
// @param argument argument passed through 
//   to the ASGST_Handler for the queue as the third argument
// @return kind or error, 
//   returns ASGST_ENQUEUE_FULL_QUEUE if queue is full
//   or ASGST_ENQUEUE_NO_QUEUE if queue is null
//
// Signal safe, but has to be called with a queue 
// that belongs to the current thread, or the thread
// has to be stopped during the duration of this call
// Requires ASGST_REGISTER_QUEUE capability
int ASGST_Enqueue(ASGST_Queue* queue, void* ucontext, 
  void* argument);

The passed argument is passed directly to the last parameter of the queue handler. Be aware of handling the case that the queue is full. Typically one falls back onto walking the stack in the signal handler or compressing the queue. The elements of a queue, including the arguments, can be obtained using the ASGST_GetQueueElement method:

// Returns the nth element in the queue (from the front),
// 0 gives you the first/oldest element.
// -1 gives you the youngest element, ..., -size the oldest.
//
// Modification of the returned element are allowed, 
// as long as the queue's size has not been modified 
// between the call to ASGST_GetQueueElement and the 
// modification (e.g. by calling ASGST_ResizeQueue).
//
// Modifiying anything besides the arg field
// is highly discouraged.
//
// @returns null if n is out of bounds
//
// Signal safe
ASGST_QueueElement* ASGST_GetQueueElement(ASGST_Queue* queue, 
  int n);

The critical detail is that modifying the arg field is supported; this allows us to do queue compression: In the signal handler, we obtain the last element in the queue using the ASGST_GetQueueElement method and then get the currently enqueuable element using ASGST_GetEnqueuableElement. We can then check whether both elements are equal and then update the argument, omitting to enqueue the current ucontext.

Another helper method is ASGST_ResizeQueue which can be used to set the queue size:

// Trigger the resizing of the queue at end of the next safepoint
// (or the current if currently processing one)
//
// Signal safe, but has to be called with a queue 
// that belongs to the current thread
// Requires ASGST_REGISTER_QUEUE capability
void ASGST_ResizeQueue(ASGST_Queue* queue, int size);

The current queue size and more can be obtained using ASGST_QueueSizeInfo:

typedef struct {
  jint size; // size of the queue
  jint capacity; // capacity of the queue
  jint attempts; // attempts to enqueue since last safepoint end
} ASGST_QueueSizeInfo;

// Returns the number of elements in the queue, its capacity,
// and the number of attempts since finishing the previous 
// safepoint
//
// Signal safe, but only proper values in queues thread
ASGST_QueueSizeInfo ASGST_GetQueueSizeInfo(ASGST_Queue* queue);

This returns the defined size/capacity, the current number of elements, and the number of enqueue attempts, including unsuccessful ones. This can be used in combination with ASGST_ResizeQueue to dynamically adjust the size of these queues.

One might want to remove a queue from a thread; this can be done using the non-signal safe method ASGST_DeregisterQueue.

Lastly, one might want to be triggered before and after a non-empty queue is processed:

// Handler that is called at a safe point with enqueued samples
// before and after processing
//
// called with the queue, a frame iterator, and the OnQueue 
// argument frame iterator is null if offerIterator at handler 
// registration was false
typedef void (*ASGST_OnQueueSafepointHandler)(ASGST_Queue*, 
                                              ASGST_Iterator*, 
                                              void*);

// Set the handler that is called at a safe point before 
// the elements in the (non-empty) queue are processed.
//
// @param before handler or null to remove the handler
//
// Not signal safe, requires ASGST_REGISTER_QUEUE capability
void ASGST_SetOnQueueProcessingStart(ASGST_Queue* queue, 
  int options, bool offerIterator, 
  ASGST_OnQueueSafepointHandler before, void* arg);

// Set the handler that is called at a safe point after 
// the elements in the (non-empty) queue are processed.
//
// @param after handler or null to remove the handler
//
// Not signal safe, requires ASGST_REGISTER_QUEUE capability
void ASGST_SetOnQueueProcessingEnd(ASGST_Queue* queue,
  int options, bool offerIterator, 
  ASGST_OnQueueSafepointHandler end, void* arg);

This should enable performance optimizations, enabling the profiler to walk the whole stack, e.g., only once per queue processing safepoint.

This is the whole API that can be found in my OpenJDK fork with the profile2.h header. The current implementation is, of course, a prototype; there are, e.g., known inaccuracies with native (C to Java) frames on which I’m currently working.

But how can we use this API? I use the same profiler from the AsyncGetCallTrace Reworked: Frame by Frame with an Iterative Touch! blog post to demonstrate using the new API.

Implementing a Small Profiler

The best thing: The code gets more straightforward and uses locks to handle concurrency. Writing code that runs at safepoints is far easier than code in signal handlers; the new API moves complexity from the profiler into the JVM.

But first, you have to build and use my modified OpenJDK as before. This JDK has been tested on x86 and aarch64. The profiler API implementation is still a prototype and contains known errors, but it works well enough to build a small profiler. Feel free to review the code; I’m open to help, suggestions, or sample programs and tests.

To use this new API, you have to include the profile2.h header file, there might be some linker issues on Mac OS, so add -L$JAVA_HOME/lib/server -ljvm to your compiler options.

Now to the significant changes to the version that walks the stack in the signal handler written for the previous blog post. First, we have to register a queue into every thread; we do this in the ThreadStart JVMTI event handler and store the result in a thread-local queue variable:

thread_local ASGST_Queue* queue;
// ...
void JNICALL
OnThreadStart(jvmtiEnv *jvmti_env,
            JNIEnv* jni_env,
            jthread thread) {
  // the queue is large, but aren't doing any  compression, 
  // so we need it
  queue = ASGST_RegisterQueue(jni_env, 10'000, 0, &asgstHandler, 
    (void*)nullptr);
  // ...
}

We then have to enqueue the last Java frames into the queue in the signal handler:

static void signalHandler(int signo, siginfo_t* siginfo, 
 void* ucontext) {
  totalTraces++;
  // queue has not been initialized
  if (queue == nullptr) {
    failedTraces++;
    return;
  }
  int res = ASGST_Enqueue(queue, ucontext, (void*)nullptr);
  if (res != 1) { // not Java trace
    failedTraces++;
    if (res == ASGST_ENQUEUE_FULL_QUEUE) {
      // we could do some compression here
      // but not in this example
      queueFullTraces++;
    }
  }
}

We record the total traces, the failed traces, and the number of times the queue had been full. The enqueued frames are processed using the asgstHandler method at every safepoint. This method obtains the current trace and stores it directly in the flame graph, acquiring the lock to prevent data races:

// we can acquire locks during safepoints
std::mutex nodeLock;
Node node{"main"};

void asgstHandler(ASGST_Iterator* iterator, void* queueArg, 
 void* arg) {
  std::vector<std::string> names;
  ASGST_Frame frame;
  int count;
  for (count = 0; ASGST_NextFrame(iterator, &frame) == 1 &&
         count < MAX_DEPTH; count++) {
    names.push_back(methodToString(frame.method));
  }
  // lets use locks to deal with the concurrency
  std::lock_guard<std::mutex> lock{nodeLock};
  node.addTrace(names);
}

That’s all. I might write a blog post on compression in the future, as the queues tend to fill up in wall-clock mode for threads that wait in native.

You can find the complete code on GitHub; feel free to ask any yet unanswered questions. To use the profiler, just run it from the command line as before:

java -agentpath:libSmallProfiler.so=output=flames.html \
  -cp samples math.MathParser

This assumes that you use the modified OpenJDK. MathParser is a demo program that generates and evaluates simple mathematical expressions. The resulting flame graph should look something like this:

Conclusion

The new API can be used to write profilers easier and walk stacks in a safe yet flexible manner. A prototypical implementation of the API showed accuracy comparable to AsyncGetCallTrace when we ignore the native frames. Using the queues offers ample opportunities for profile compression and incremental stack walking, only walking the new stacks for every queue element.

I want to come back to the quote from Erik that I wrote in the beginning, answering his concerns one by one:

Well the current proposal doesn’t have a clear story for
1) Making it safe
2) Working with virtual threads
3) Supporting incremental stack scanning
4) Supporting concurrent stack scanning

  1. Walking at Java frames at safepoints out of signal handlers makes the stack walking safer, and using improved method ids helps with the post-processing.
  2. Walking only at safepoints should make walking virtual threads possible; it is yet to be decided how to expose virtual threads in the API. But the current API is flexible enough to accommodate it.
  3. and 4. Stack watermarks allow profilers to implement incremental and concurrent stack walking, which should improve performance and offer the ability to compress stack traces—more on this in a future blog post.

Thank you for joining me on my API journey; I’m open to any suggestions; please reach me using the typical channels.

Just keep in mind:

This project is part of my work in the SapMachine team at SAP, making profiling easier for everyone. Thanks to Erik Österlund for the basic idea, and to Jaroslav Bachorik for all the feedback and help on the JEP.

AsyncGetCallTrace Reworked: Frame by Frame with an Iterative Touch!

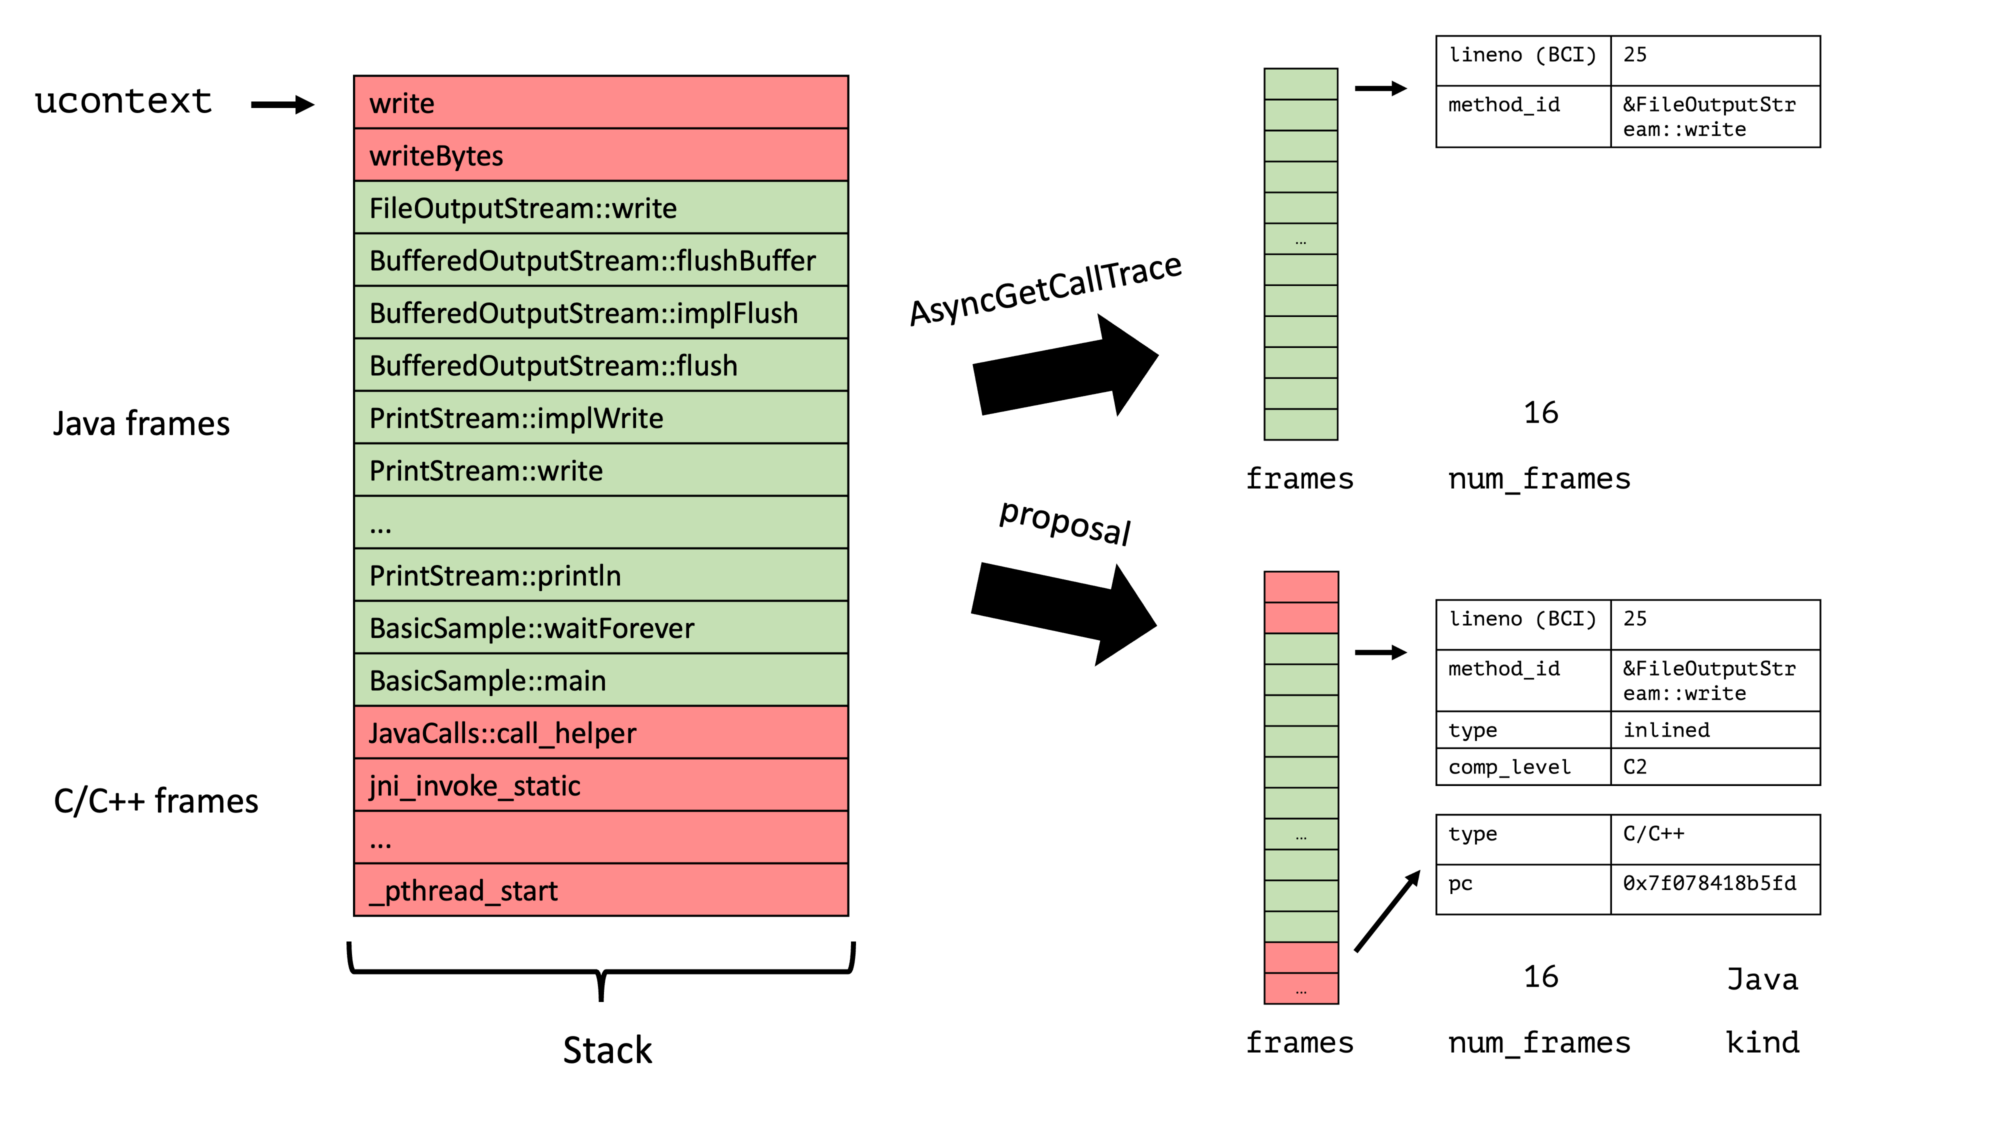
AsyncGetCallTrace is an API to obtain the top n Java frames of a thread asynchronously in a signal handler. This API is widely used but has its problems; see JEP 435 and my various blog posts (AsyncGetStackTrace: A better Stack Trace API for the JVM, jmethodIDs in Profiling: A Tale of Nightmares, …). My original approach with my JEP proposal was to build a replacement of the API, which could be used as a drop-in for AsyncGetCallTrace: Still a single method that populates a preallocated frame list:

No doubt this solves a few of the problems, the new API would be officially supported, return more information, and could return the program counter for C/C++ frames. But it eventually felt more like a band-aid, hindered by trying to mimic AsyncGetCallTrace. In recent months, I had a few discussions with Erik Österlund and Jaroslav Bachorik in which we concluded that what we really need is a completely redesigned profiling API that isn’t just an AsyncGetCallTrace v2.

The new API should be more flexible, safer, and future-proof than the current version. It should, if possible, allow incremental stack scanning and support virtual threads. So I got to work redesigning and, more crucially, rethinking the profiling API inspired by Erik Österlunds ideas.

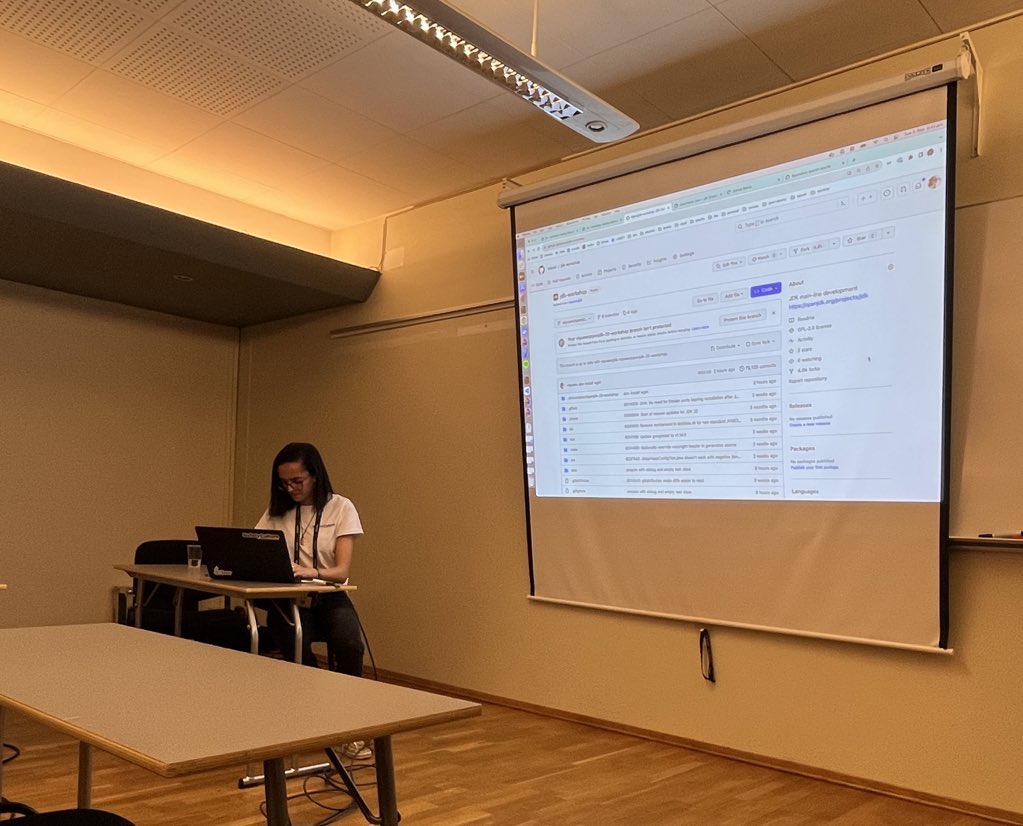
This blog post is the first of two blog posts covering the draft of a new iterator-based stack walking API, which builds the base for the follow-up blog post on safepoint-based profiling. The following blog post will come out on Wednesday as a special for the OpenJDK Committers’ Workshop.

Iterators

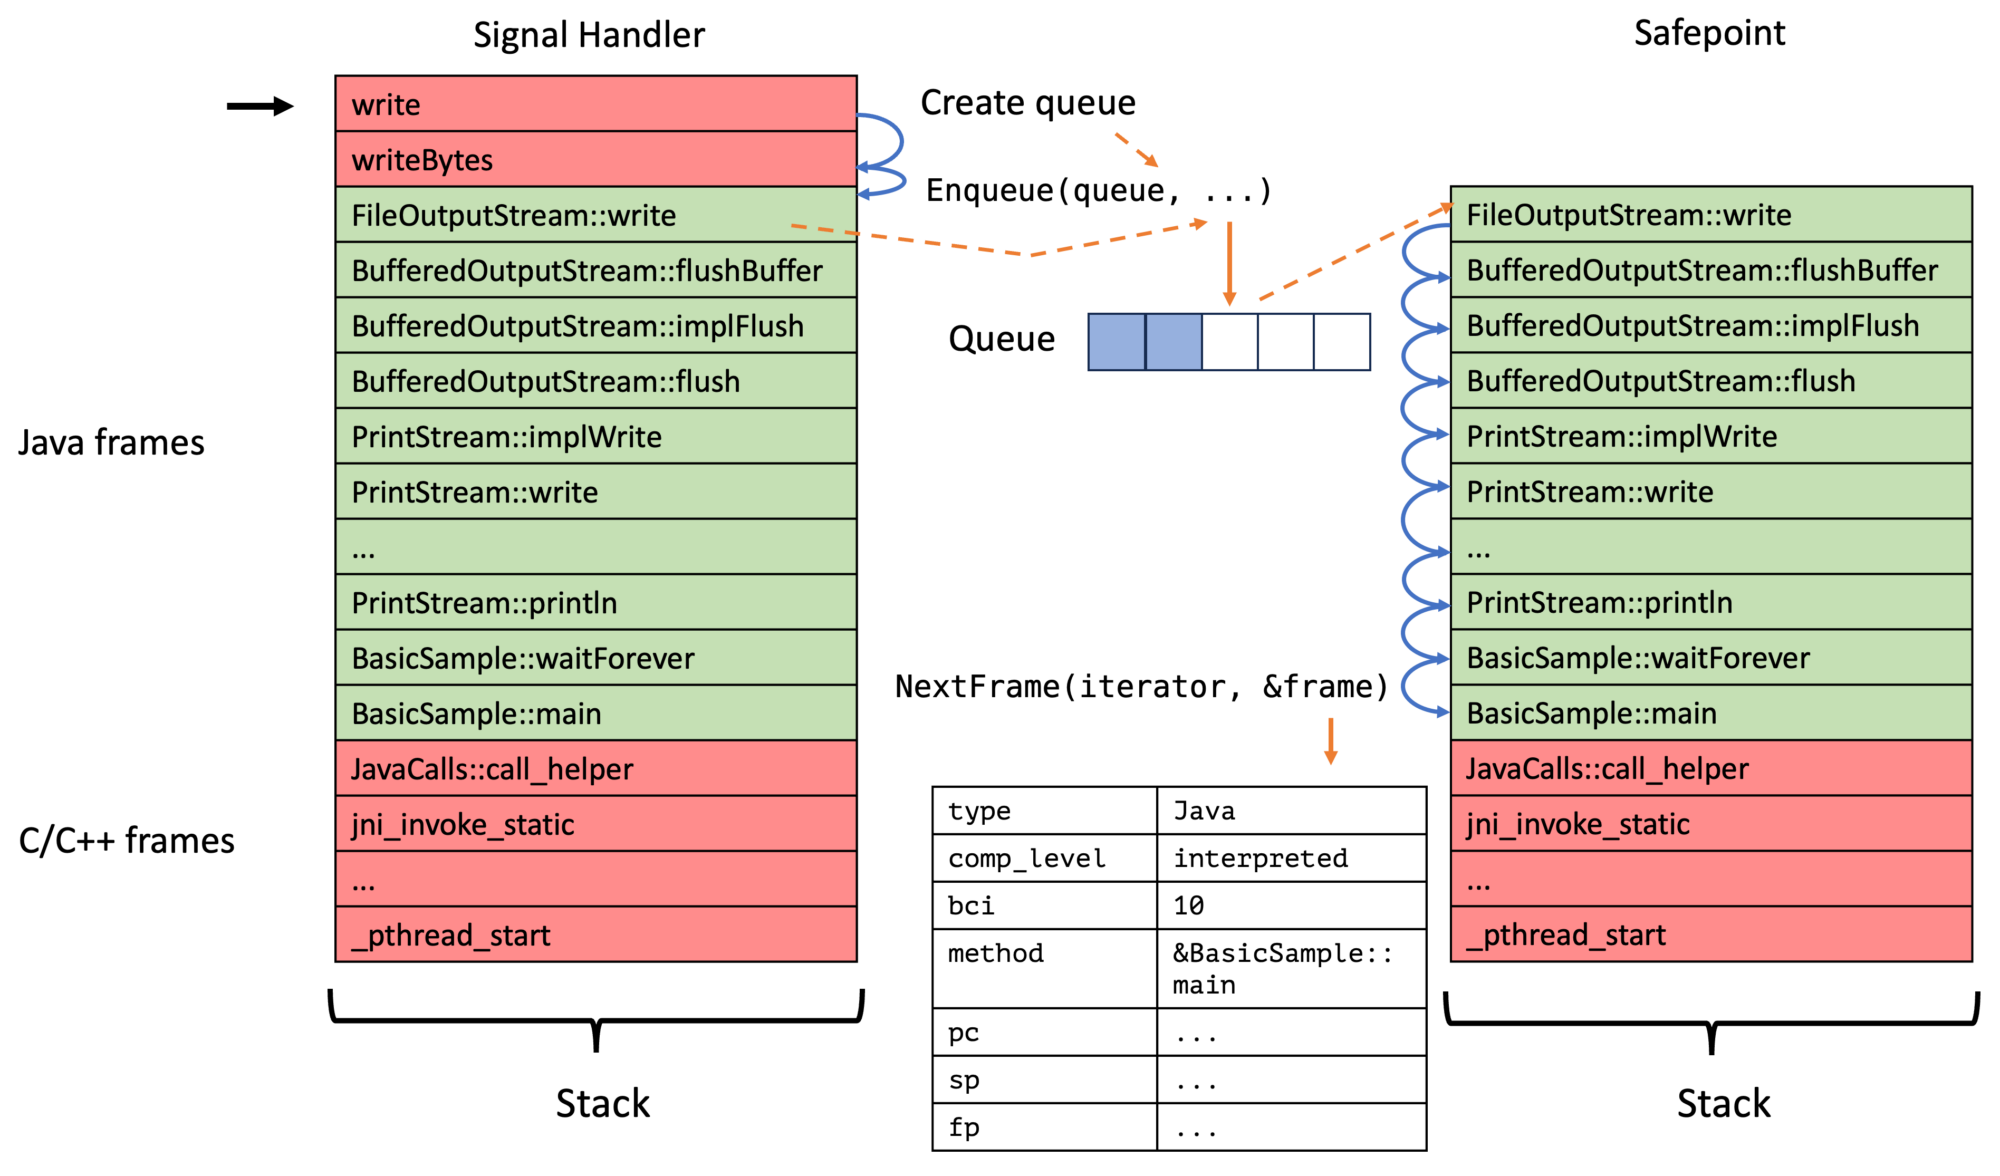
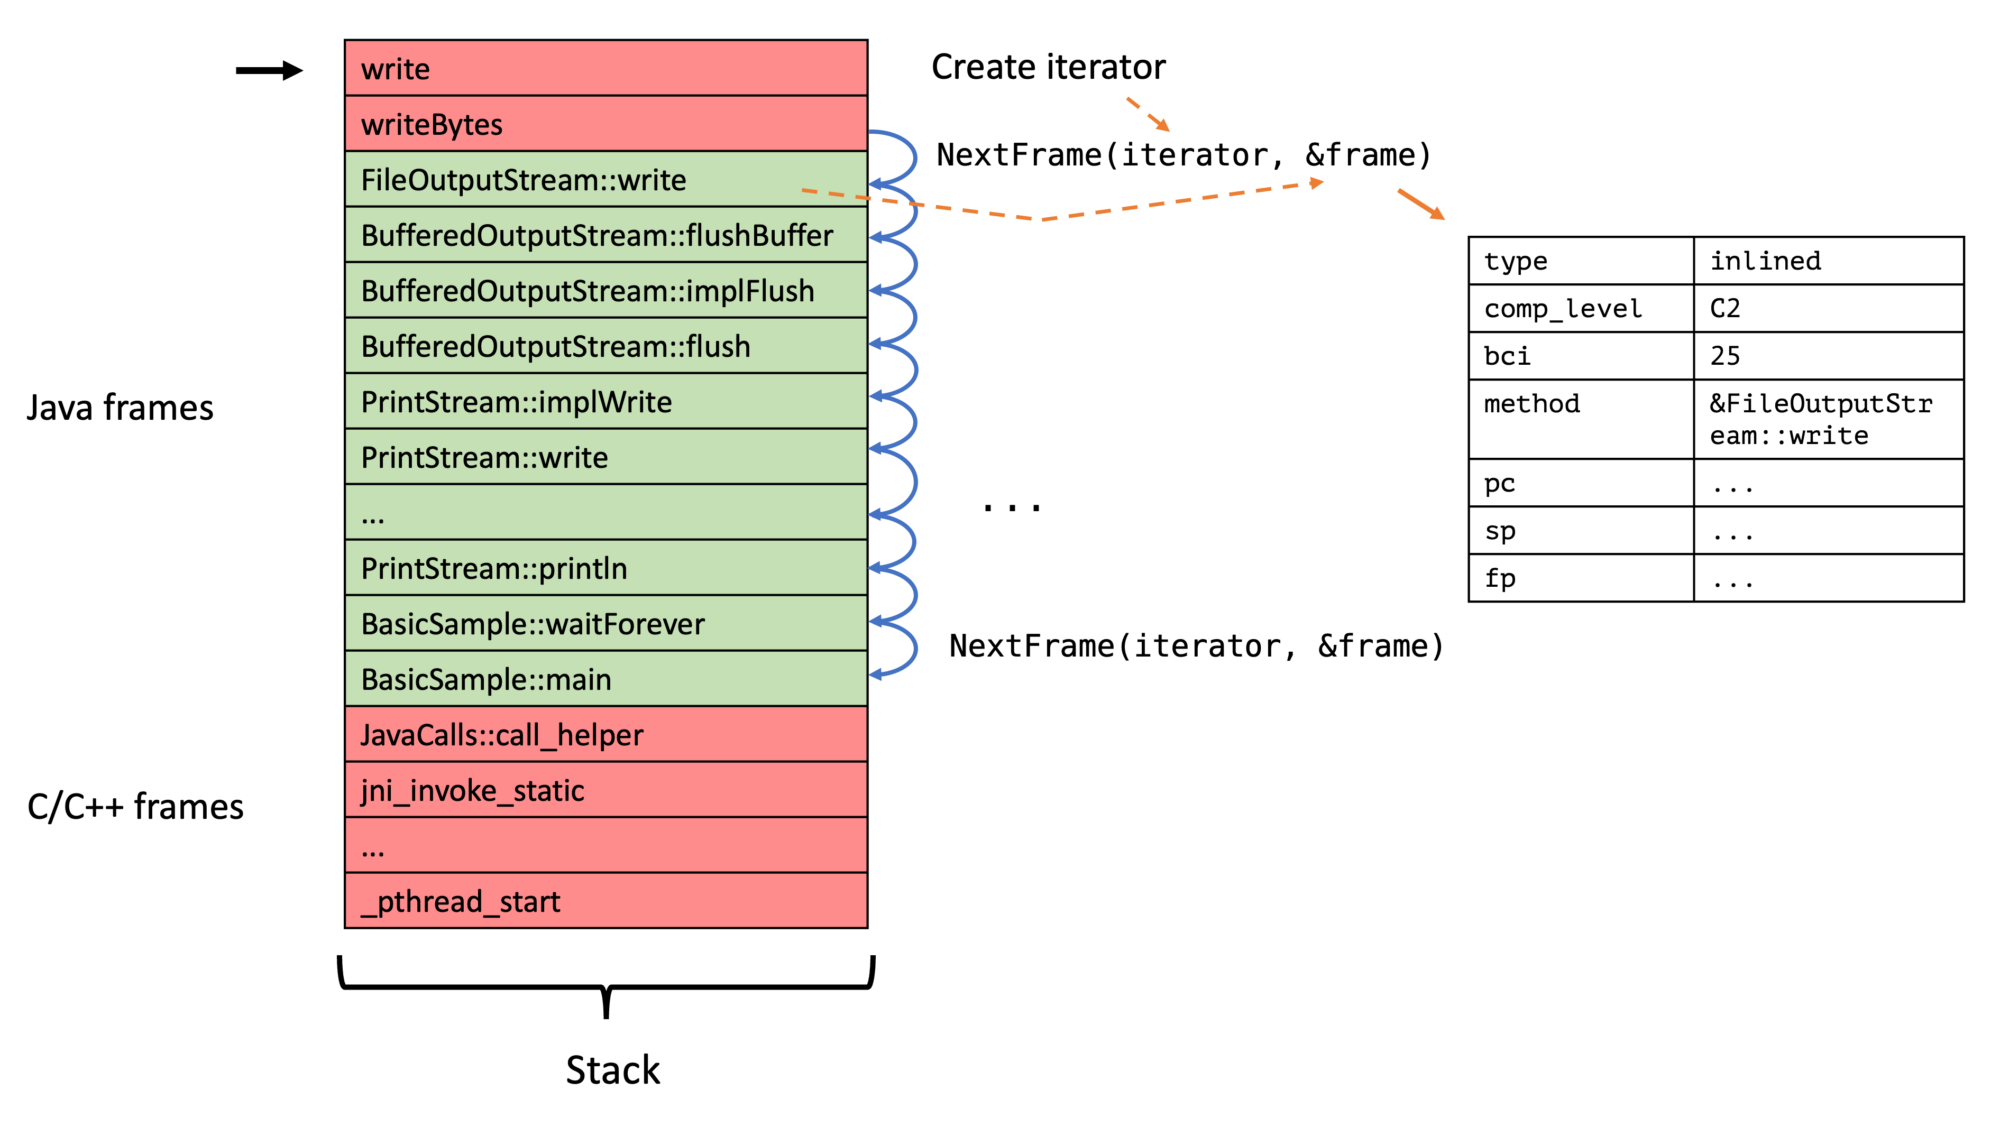
AsyncGetCallTrace fills a preallocated list of frames, which has the most profound expected stack trace length, and many profilers just store away this list. This limits the amount the data we can give for each frame. We don’t have this problem with an iterator-based API, where we first create an iterator for the current stack and then walk from frame to frame:

The API can offer all the valuable information the JVM has, and the profiler developer can pick the relevant information. This API is, therefore, much more flexible; it allows the profiler writer to …

  • … walk at frames without a limit
  • … obtain program counter, stack pointer, and frame pointer to use their stack walking code for C/C++ frames between Java frames
  • … use their compression scheme for the data
  • don’t worry about allocating too much data on the stack because the API doesn’t force you to preallocate a large number of frames

This API can be used to develop your version of AsyncGetCallTrace, allowing seamless integration into existing applications.

Using the API in a signal handler and writing it using C declarations imposes some constraints, which result in a slightly more complex API which I cover in the following section.

Proposed API

When running in a signal handler, a significant constraint is that we have to allocate everything on the stack. This includes the iterator. The problem is that we don’t want to specify the size of the iterator in the API because this iterator is based on an internal stack walker and is subject to change. Therefore, we have to allocate the iterator on the stack inside an API method, but this iterator is only valid in the method’s scope. This is the reason for the ASGST_RunWithIterator which creates an iterator and passes it to a handler:

// Create an iterator and pass it to fun alongside 
// the passed argument.
// @param options ASGST_INCLUDE_NON_JAVA_FRAMES, ...
// @return error or kind
int ASGST_RunWithIterator(void* ucontext, 
    int32_t options, 
    ASGST_IteratorHandler fun, 
    void* argument);

The iterator handler is a pointer to a method in which the ASGST_RunWithIterator calls with an iterator and the argument. Yes, this could be nicer in C++, which lambdas and more, but we are constrained to a C API. It’s easy to develop a helper library in C++ that offers zero-cost abstractions, but this is out-of-scope for the initial proposal.

Now to the iterator itself. The main method is ASGST_NextFrame:

// Obtains the next frame from the iterator
// @returns 1 if successful, else error code (< 0) / end (0)
// @see ASGST_State
//
// Typically used in a loop like:
//
// ASGST_Frame frame;
// while (ASGST_NextFrame(iterator, &frame) == 1) {
//   // do something with the frame
// }
int ASGST_NextFrame(ASGST_Iterator* iterator, ASGST_Frame* frame);

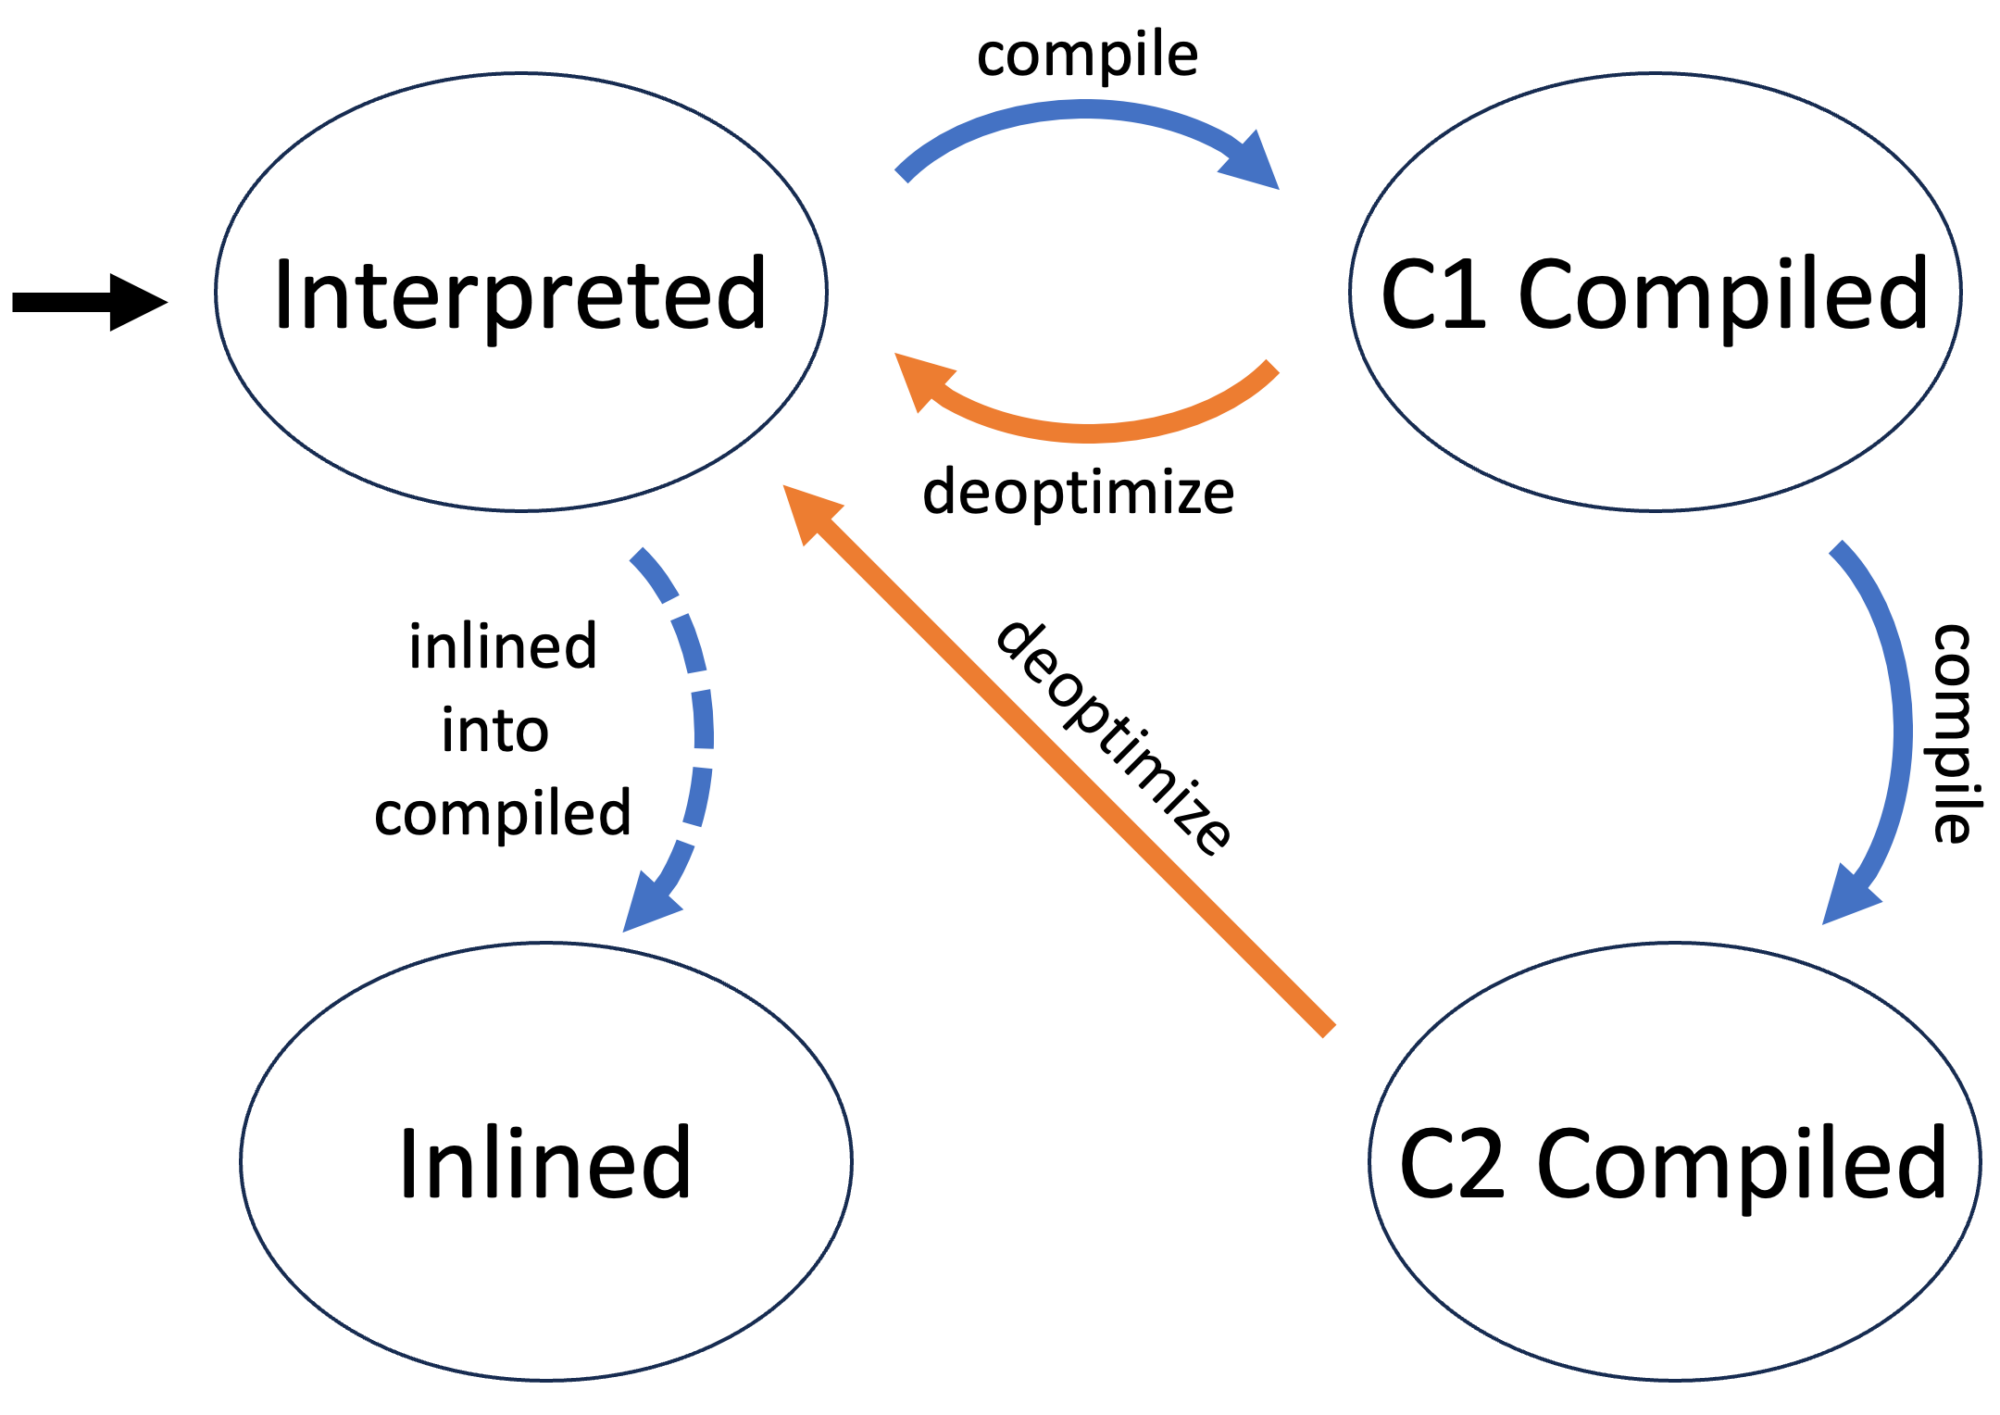
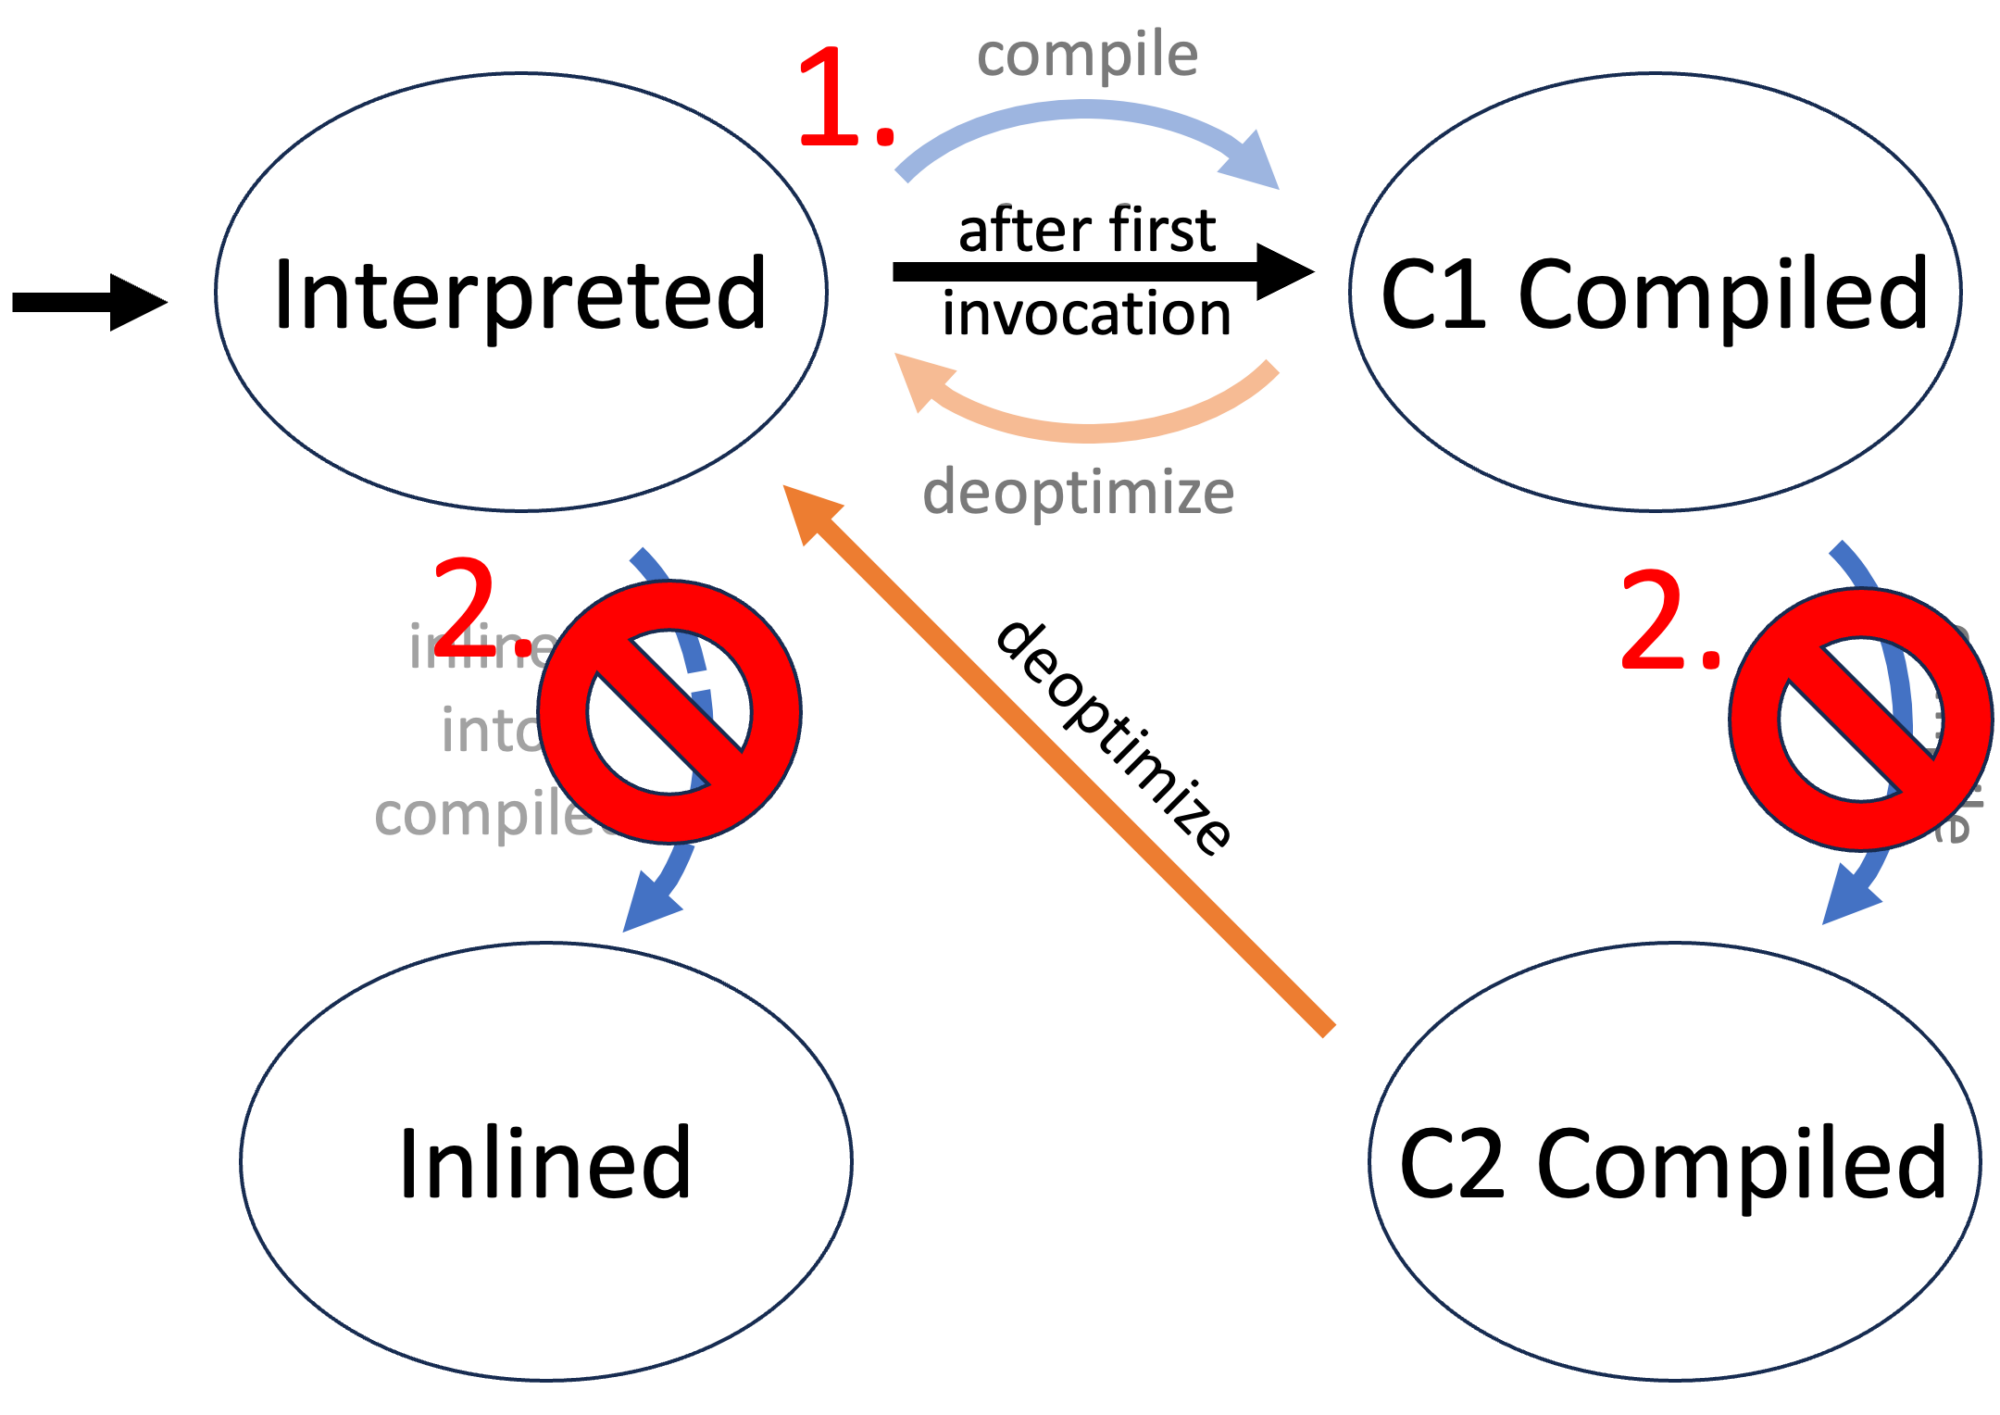
The frame data structure, as explained in the previous section, contains all required information and is far simpler than the previous proposal (without any union):

enum ASGST_FrameTypeId {
  ASGST_FRAME_JAVA         = 1, // JIT compiled and interpreted
  ASGST_FRAME_JAVA_INLINED = 2, // inlined JIT compiled
  ASGST_FRAME_JAVA_NATIVE  = 3, // native wrapper to call 
                                // C/C++ methods from Java
  ASGST_FRAME_NON_JAVA     = 4  // C/C++/... frames
};

typedef struct {
  uint8_t type;         // frame type
  int comp_level;       // compilation level, 0 is interpreted, 
                        // -1 is undefined, > 1 is JIT compiled
  int bci;              // -1 if the bci is not available 
                        // (like in native frames)
  ASGST_Method method;  // method or nullptr if not available
  void *pc;             // current program counter 
                        // inside this frame
  void *sp;             // current stack pointer 
                        // inside this frame, might be null
  void *fp;             // current frame pointer 
                        // inside this frame, might be null
} ASGST_Frame;

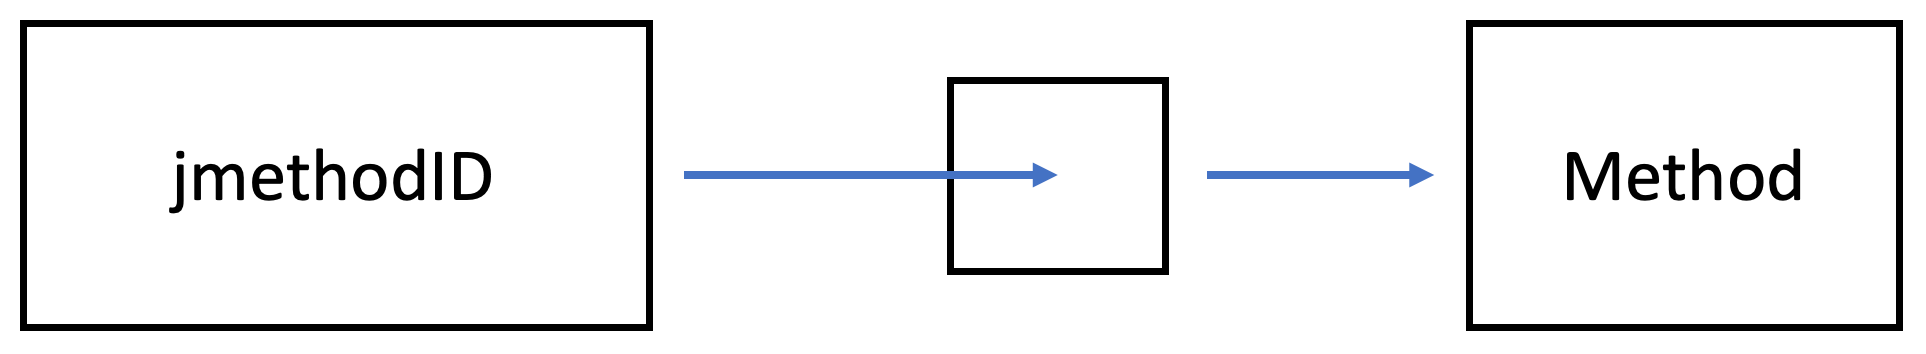
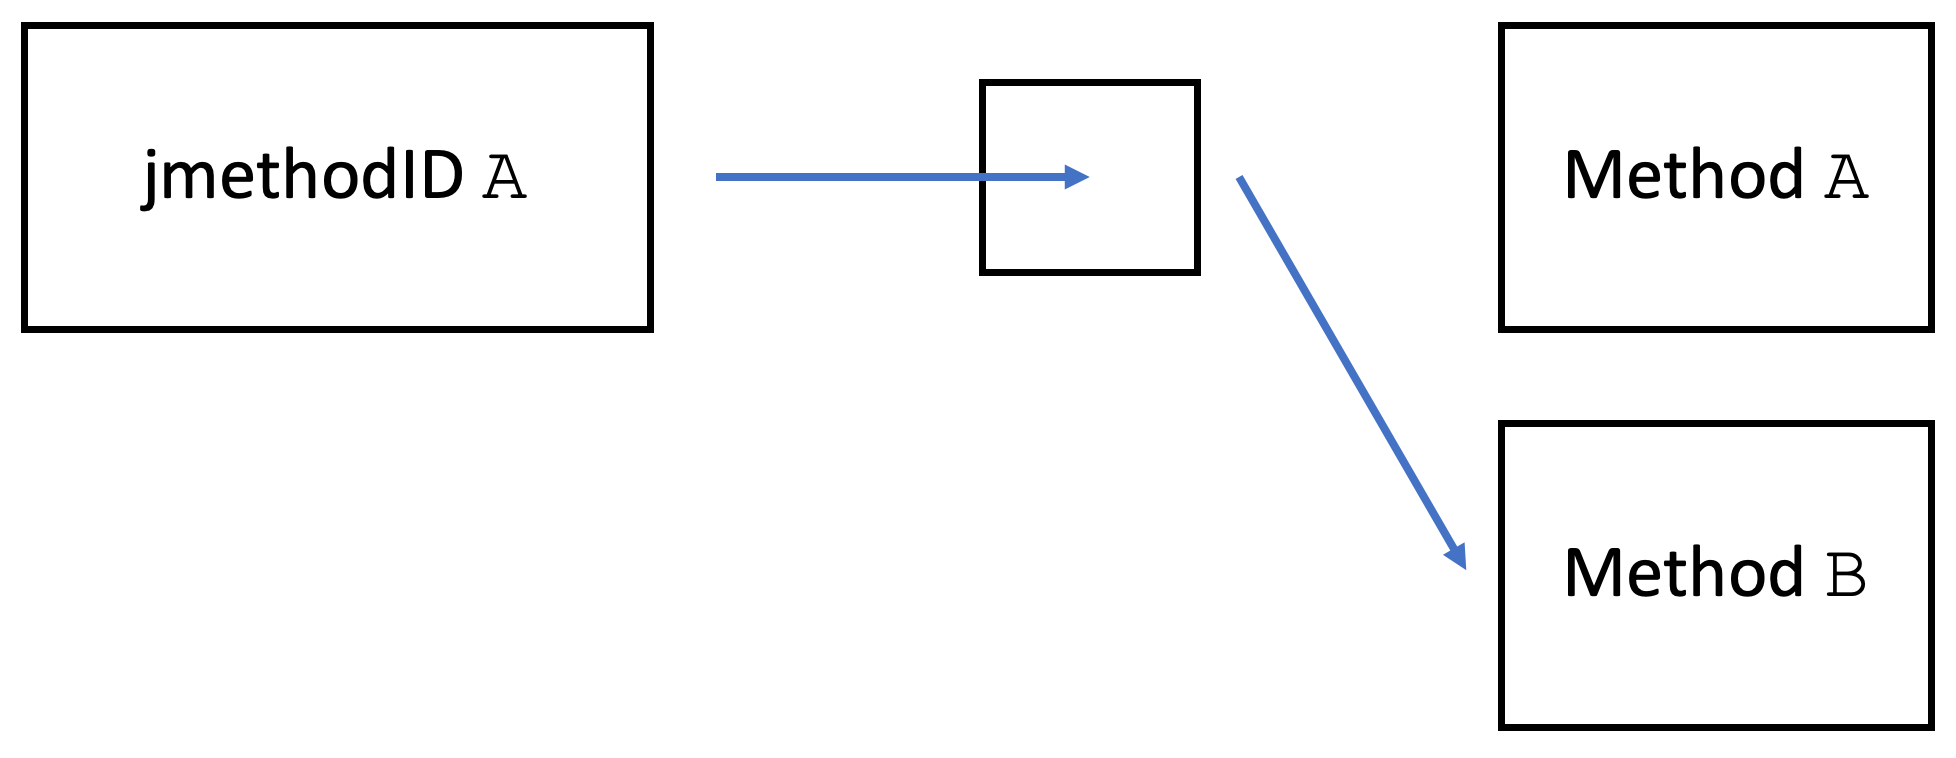
This uses ASGST_Method instead of jmethodID, see jmethodIDs in Profiling: A Tale of Nightmares for more information.

The error codes used both by ASGST_RunWithIterator and ASGST_NextFrame are defined as:

enum ASGST_Error {
  ASGST_NO_FRAME            =  0, // come to and end
  ASGST_NO_THREAD           = -1, // thread is not here
  ASGST_THREAD_EXIT         = -2, // dying thread
  ASGST_UNSAFE_STATE        = -3, // thread is in unsafe state
  ASGST_NO_TOP_JAVA_FRAME   = -4, // no top java frame
  ASGST_ENQUEUE_NO_QUEUE    = -5, // no queue registered
  ASGST_ENQUEUE_FULL_QUEUE  = -6, // safepoint queue is full
  ASGST_ENQUEUE_OTHER_ERROR = -7, // other error, 
                                  // like currently at safepoint
  // everything lower than -16 is implementation specific
};

ASGST_ENQUEUE_NO_QUEUE and ASGST_ENQUEUE_FULL_QUEUE are not relevant yet, but their importance will be evident in my next blog post.

This API wouldn’t be complete without a few helper methods. We might want to start from an arbitrary frame; for example, we use a custom stack walker for the top C/C++ frames:

// Similar to RunWithIterator, but starting from 
// a frame (sp, fp, pc) instead of a ucontext.
int ASGST_RunWithIteratorFromFrame(void* sp, void* fp, void* pc, 
  int options, ASGST_IteratorHandler fun, void* argument);

The ability to rewind an iterator is helpful too:

// Rewind an interator to the top most frame
void ASGST_RewindIterator(ASGST_Iterator* iterator);

And just in case you want to get the state of the current iterator or thread, there are two methods for you:

// State of the iterator, corresponding 
// to the next frame return code
// @returns error code or 1 if no error
// if iterator is null or at end, return ASGST_NO_FRAME,
// returns a value < -16 if the implementation encountered 
// a specific error
int ASGST_State(ASGST_Iterator* iterator);

// Returns state of the current thread, which is a subset
// of the JVMTI thread state.
// no JVMTI_THREAD_STATE_INTERRUPTED, 
// limited JVMTI_THREAD_STATE_SUSPENDED.
int ASGST_ThreadState();

But how can we use this API? I developed a small profiler in my writing, a profiler from scratch series, which we can now use to demonstrate using the methods defined before. Based on my Writing a Profiler in 240 Lines of Pure Java blog post, I added a flame graph implementation. In the meantime, you can also find the base implementation on GitHub.

Implementing a Small Profiler

First of all, you have to build and use my modified OpenJDK. This JDK has been tested on x86 and aarch64. The profiler API implementation is still a prototype and contains known errors, but it works well enough to build a small profiler. Feel free to review the code; I’m open to help, suggestions, or sample programs and tests.

To use this new API, you have to include the profile2.h header file, there might be some linker issues on Mac OS, so add -L$JAVA_HOME/lib/server -ljvm to your compiler options.

One of the essential parts of this new API is that, as it doesn’t use jmethodID, we don’t have to pre-touch every method (learn more on this in jmethodIDs in Profiling: A Tale of Nightmares). Therefore we don’t need to listen to ClassLoad JVMTI events or iterate over all existing classes at the beginning. So the reasonably complex code

static void JNICALL OnVMInit(jvmtiEnv *jvmti, 
 JNIEnv *jni_env, jthread thread) {
  jint class_count = 0;
  env = jni_env;
  sigemptyset(&prof_signal_mask);
  sigaddset(&prof_signal_mask, SIGPROF);
  OnThreadStart(jvmti, jni_env, thread);
  // Get any previously loaded classes 
  // that won't have gone through the
  // OnClassPrepare callback to prime 
  // the jmethods for AsyncGetCallTrace.
  JvmtiDeallocator<jclass> classes;
  ensureSuccess(jvmti->GetLoadedClasses(&class_count,
      classes.addr()), 
    "Loading classes failed")

  // Prime any class already loaded and 
  // try to get the jmethodIDs set up.
  jclass *classList = classes.get();
  for (int i = 0; i < class_count; ++i) {
    GetJMethodIDs(classList[i]);
  }

  startSamplerThread();
}

is reduced to just

static void JNICALL OnVMInit(jvmtiEnv *jvmti, JNIEnv *jni_env, 
 jthread thread) {
  sigemptyset(&prof_signal_mask);
  sigaddset(&prof_signal_mask, SIGPROF);
  OnThreadStart(jvmti, jni_env, thread);
  startSamplerThread();
}

improving the start-up/attach performance of the profiler along the way. To get from the new ASGST_Method identifiers to the method name we need for the flame graph, we don’t use the JVMTI methods but ASGST methods:

static std::string methodToString(ASGST_Method method) {
  // assuming we only care about the first 99 chars
  // of method names, signatures and class names
  // allocate all character array on the stack
  char method_name[100];
  char signature[100];
  char class_name[100];
  // setup the method info
  ASGST_MethodInfo info;
  info.method_name = (char*)method_name;
  info.method_name_length = 100;
  info.signature = (char*)signature;
  info.signature_length = 100;
  // we ignore the generic signature
  info.generic_signature = nullptr;
  // obtain the information
  ASGST_GetMethodInfo(method, &info);
  // setup the class info
  ASGST_ClassInfo class_info;
  class_info.class_name = (char*)class_name;
  class_info.class_name_length = 100;
  // we ignore the generic class name
  class_info.generic_class_name = nullptr;
  // obtain the information
  ASGST_GetClassInfo(info.klass, &class_info);
  // combine all
  return std::string(class_info.class_name) + "." + 
    std::string(info.method_name) + std::string(info.signature);
}

This method is then used in the profiling loop after obtaining the traces for all threads. But of course, by then, the ways may be unloaded. This is rare but something to consider as it may cause segmentation faults. Due to this, and for performance reasons, we could register class unload handlers and obtain the method names for the methods of unloaded classes therein, as well as obtain the names of all still loaded used ASGST_Methods when the agent is unattached (or the JVM exits). This will be a topic for another blog post.

Another significant difference between the new API to the old API is that it misses a pre-defined trace data structure. So the profiler requires its own:

struct CallTrace {
  std::array<ASGST_Frame, MAX_DEPTH> frames;
  int num_frames;

  std::vector<std::string> to_strings() const {
    std::vector<std::string> strings;
    for (int i = 0; i < num_frames; i++) {
      strings.push_back(methodToString(frames[i].method));
    }
    return strings;
  }
};

We still use the pre-defined frame data structure in this example for brevity, but the profiler could customize this too. This allows the profiler only to store the relevant information.

We fill the related global_traces entries in the signal handler. Previously we just called:

static void signalHandler(int signo, siginfo_t* siginfo, 
 void* ucontext) {
  asgct(&global_traces[available_trace++], 
    MAX_DEPTH, ucontext);
  stored_traces++;
}

But now we have to use the ASGST_RunWithIterator with a callback. So we define the callback first:

void storeTrace(ASGST_Iterator* iterator, void* arg) {
  CallTrace *trace = (CallTrace*)arg;
  ASGST_Frame frame;
  int count;
  for (count = 0; ASGST_NextFrame(iterator, &frame) == 1 && 
         count < MAX_DEPTH; count++) {
    trace->frames[count] = frame;  
  }
  trace->num_frames = count;
}

We use the argument pass-through from ASGST_RunWithIterator to the callback to pass the CallTrace instance where we want to store the traces. We then walk the trace using the ASGST_NextFrame method and iterate till the maximum count is reached, or the trace is finished.

ASGST_RunWithIterator itself is called in the signal handler:

static void signalHandler(int signo, siginfo_t* siginfo, 
 void* ucontext) {
  CallTrace &trace = global_traces[available_trace++];
  int ret = ASGST_RunWithIterator(ucontext, 0, 
              &storeTrace, &trace);
  if (ret >= 2) { // non Java trace
    ret = 0;
  }
  if (ret <= 0) { // error
    trace.num_frames = ret;
  }
  stored_traces++;
}

You can find the complete code on GitHub; feel free to ask any yet unanswered questions. To use the profiler, just run it from the command line:

java -agentpath:libSmallProfiler.so=output=flames.html \
  -cp samples math.MathParser

This assumes that you use the modified OpenJDK. MathParser is a demo program that generates and evaluates simple mathematical expressions. I wrote this for a compiler lab while I was still a student. The resulting flame graph should look something like this:

Conclusion

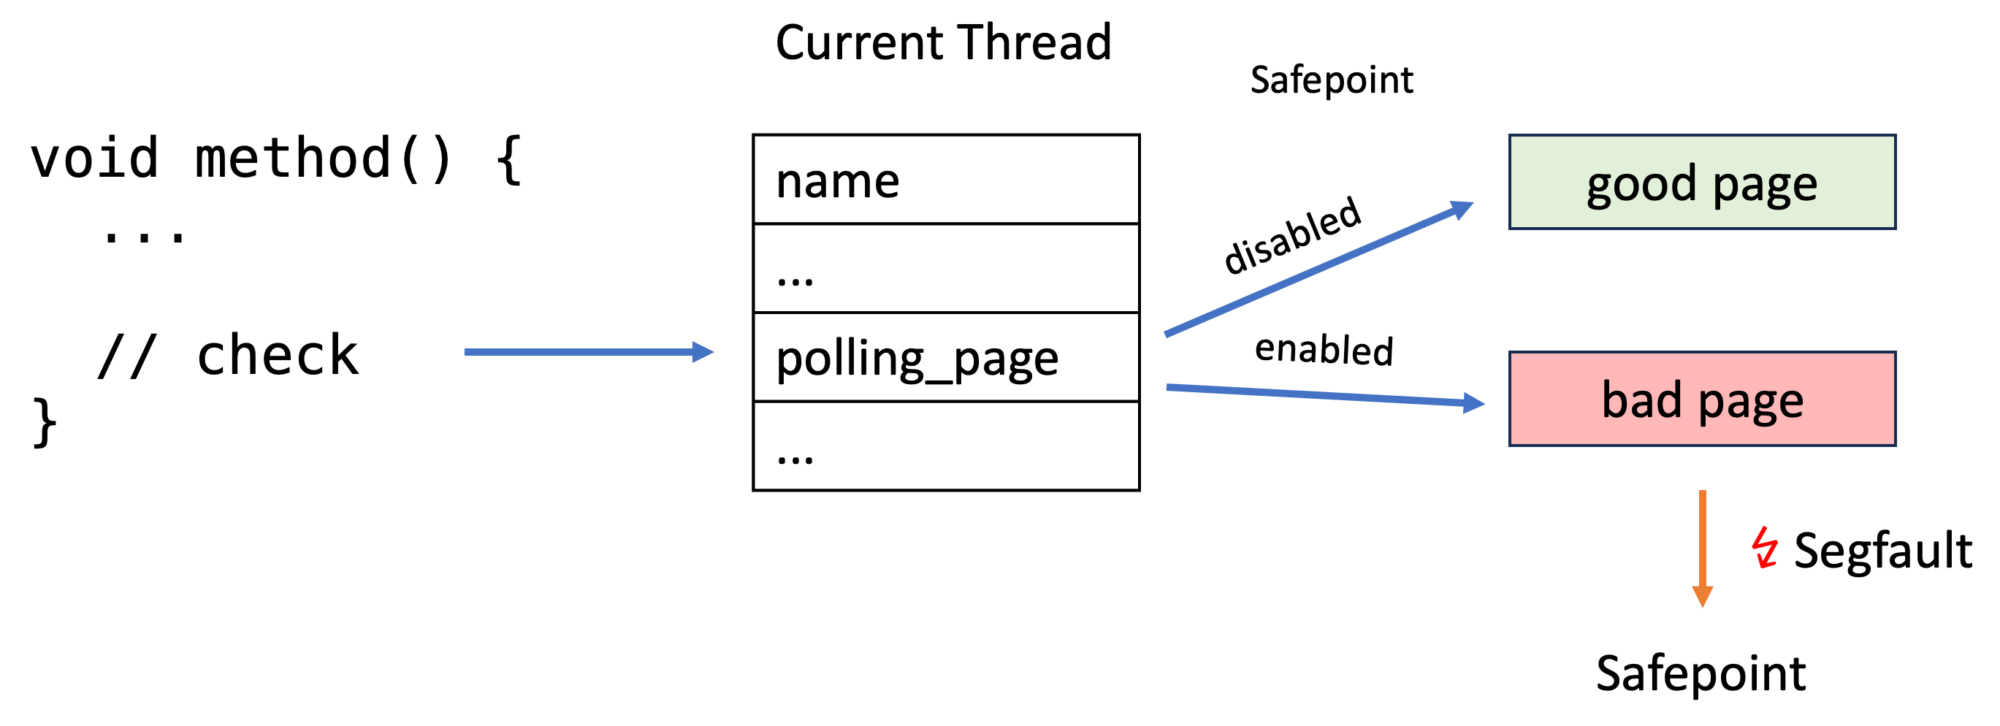
Using an iterator-based profiling API in combination with better method ids offers flexibility, performance, and safety for profiler writers. The new API is better than the old one, but it becomes even better. Get ready for the next blog post in which I tell you about safepoints and why it matters that there is a safepoint-check before unwinding any physical frame, which is the reason why I found a bug in The Inner Workings of Safepoints. So it will all come together.

Thank you for coming this far; I hope you enjoyed this blog post, and I’m open to any suggestions on my profiling API proposal.

This project is part of my work in the SapMachine team at SAP, making profiling easier for everyone.

The Inner Workings of Safepoints

A Java thread in the JVM regularly checks whether it should do extra work besides the execution of the bytecode. This work is done during so-called safepoints. There are two types of safepoints: local and global. At thread-local safepoints, also known as thread-local handshakes, only the current thread does some work and is therefore blocked from executing the application. At global safepoints, all Java threads are blocked and do some work. At these safepoints, the state of the thread (thread-local safepoints) or the JVM (global safepoints) is fixed. This allows the JVM to do activities like method deoptimizations or stop-the-world garbage collections, where the amount of concurrency should be limited.

But this blog post isn’t about what (global) safepoints are; for this, please refer to Nitsan Wakart’s and Seetha Wenner’s articles on this topic and for thread-local safepoints, which are a relatively recent addition to JEP 312. I’ll cover in this post the actual implementation of safepoints in the OpenJDK and present a related bug that I found along the way.

Update: FOSDEM talk

I gave a talk on the topic of this blog post at FOSDEM 2024’s Free Java Devroom:

Implementing Safepoint Checks

Global safepoints are implemented using thread-local safepoints by stopping the threads at thread-local safepoints till all threads reach a barrier (source code), so we only have thread-local checks. Therefore I’ll only cover thread-local safepoints here and call them “safepoints.”

The simplest option for implementing safepoint checks would be to add code like

if (thread->at_safepoint()) {
  SafepointMechanism::process();
}

to every location where a safepoint check should occur. The main problem is its performance. We either add lots of code or wrap it in a function and have a function call for every check. We can do better by exploiting the fact that the check often fails, so we can optimize for the fast path of “thread not at safepoint”. The OpenJDK does this by exploiting the page protection mechanisms of modern CPUs (source) in JIT compiled code:

The JVM creates a good and a bad page/memory area for every thread before a thread executes any Java code (source):

char* bad_page  = polling_page;
char* good_page = polling_page + page_size;

os::protect_memory(bad_page,  page_size, os::MEM_PROT_NONE);
os::protect_memory(good_page, page_size, os::MEM_PROT_READ);
//...
_poll_page_armed_value    = 
  reinterpret_cast<uintptr_t>(bad_page);
_poll_page_disarmed_value = 
  reinterpret_cast<uintptr_t>(good_page);

The good page can be accessed without issues, but accessing the protected bad page causes an error. os::protect_memory uses the mprotect method under the hood:

mprotect() changes the access protections for the calling
process's memory pages [...].

If the calling process tries to access memory in a manner that
violates the protections, then the kernel generates a SIGSEGV
signal for the process.

prot is a combination of the following access flags: PROT_NONE or
a bitwise-or of the other values in the following list:

  PROT_NONE     The memory cannot be accessed at all.
  PROT_READ     The memory can be read.
  PROT_WRITE    The memory can be modified.
[...]

Now every thread has a field _polling_page which points to either the good page (safepoint check fails) or the bad page (safepoint check succeeds). The segfault handler of JVM then calls the safepoint handler code. Handling segfaults is quite expensive, but this is only used on the slow path; the fast path consists only of reading from the address that _polling_page points to.

In addition to simple safepoints, which trigger indiscriminate of the current program state, Erik Österlund added functionality to parametrize safepoints with JEP 376: The safepoint can be configured to cause a successful safepoint only if the current frame is older than the specified frame, based on the frame pointer. The frame pointer of the specified frame is called a watermark.

Keep in mind that stacks grow from higher to lower addresses. But how is this implemented? It is implemented by adding a _polling_word field next to the _poll_page field to every thread. This polling word specifies the watermark and is checked in the safepoint handler. The configured safepoints are used for incremental stack walking.

The cool thing is that (source) that when enabling the regular safepoint, one sets the watermark to 1 and for disarming it to ~1 (1111...10), so the fp > watermark is always true when the safepoint is enabled (fp > 1 is always true) and false when disabled (fp > 111...10 is always false). Therefore, we can use the same checks for both kinds of safepoints.

More on watermarks and how they can be used to reduce the latency of garbage collectors can be found in the video by Erik:

Bug with Interpreted Aarch64 Methods

The OpenJDK uses multiple compilation tiers; methods can be interpreted or compiled; see Mastering the Art of Controlling the JIT: Unlocking Reproducible Profiler Tests for more information. A common misconception is that “interpreted” means that the method is evaluated by a kind of interpreter loop that has the basic structure:

for (int i = 0; i < byteCode.length; i++) {
  switch (byteCode[i].op) {
    case OP_1:
    ...
  }
}

The bytecode is actually compiled using a straightforward TemplateInterpreter, which maps every bytecode instruction to a set of assembler instructions. The compilation is fast because there is no optimization, and the evaluation is faster than a traditional interpreter.

The TemplateInterpreter adds safepoint checks whenever required, like method returns. All return instructions are mapped to assembler instructions by the TemplateTable::_return(TosState state) method. On x86, it looks like (source):

void TemplateTable::_return(TosState state) {
  // ...
  if (_desc->bytecode() == Bytecodes::_return_register_finalizer){
     // ... // finalizers
  }

  if (_desc->bytecode() != Bytecodes::_return_register_finalizer){
    Label no_safepoint;
    NOT_PRODUCT(__ block_comment("Thread-local Safepoint poll"));
    // ...
    __ testb(Address(r15_thread, 
               JavaThread::polling_word_offset()), 
             SafepointMechanism::poll_bit());
    // ...
    __ jcc(Assembler::zero, no_safepoint);
    __ push(state);
    __ push_cont_fastpath();
    __ call_VM(noreg, CAST_FROM_FN_PTR(address,
                        InterpreterRuntime::at_safepoint));
    __ pop_cont_fastpath();
    __ pop(state);
    __ bind(no_safepoint);
  }
  // ...
  __ remove_activation(state, rbcp);

  __ jmp(rbcp);
}

This adds the safepoint check using the simple method without page faults (for some reason, I don’t know why), ensuring that a safepoint check is done at the return of every method.

We can therefore expect that when a safepoint is triggered in the interpreted_method in

interpreted_method();
compiled_method();

that the safepoint is handled at least at the end of the method; in our example, the method is too small to have any other safepoints. Yet on my M1 MacBook, the safepoint is only handled in the compiled_method. I found this while trying to fix a bug in safepoint-dependent serviceability code. The cause of the problem is that the TemplateTable::_return(TosState state) is missing the safepoint check generation on aarch64 (source):

void TemplateTable::_return(TosState state)
{
  // ...
  if (_desc->bytecode() == Bytecodes::_return_register_finalizer){
    // ... // finalizers
  }

  // Issue a StoreStore barrier after all stores but before return
  // from any constructor for any class with a final field. 
  // We don't know if this is a finalizer, so we always do so.
  if (_desc->bytecode() == Bytecodes::_return)
    __ membar(MacroAssembler::StoreStore);

  // ...
  __ remove_activation(state);
  __ ret(lr);
}

And no the remove_activation method doesn’t check for the safepoint, it only checks for the safepoint (and therefore whether a watermark is set) and calls the InterpreterRuntime::at_unwind method to deal with unwinding of a frame which is related to a watermark. It does not call any safepoint handler related methods.

The same issue is prevalent in the OpenJDK’s riscv and arm ports. The real-world implications of this bug are minor, as the interpreted methods without any inner safepoint checks (in loops, calls to compiled methods, …) seldom run long enough to matter.

I’m neither an expert on the TemplateInterpreter nor on the different architectures. Maybe there are valid reasons to omit this safepoint check on ARM. But if there are not, then it should be fixed; I propose adding something like the following directly before if (_desc->bytecode() == Bytecodes::_return) for aarch64 (source):

  if (_desc->bytecode() != Bytecodes::_return_register_finalizer){
    Label slow_path;
    Label fast_path;
    __ safepoint_poll(slow_path, true /* at_return */,
         false /* acquire */, false /* in_nmethod */);
    __ br(Assembler::AL, fast_path);
    __ bind(slow_path);
    __ call_VM(CAST_FROM_FN_PTR(address, 
         InterpreterRuntime::at_safepoint), rthread);
    __ bind(fast_path);
  }

Update: Thanks to Leela Mohan Venati on Twitter for spotting that at_safepoint has to be called using call_VM and not super_call_VM_leaf, because at_safepoint is defined using JRT_ENTRY.

I’m happy to hear the opinion of any experts on this topic, the related bug is JBS-8313419.

Conclusion

Understanding the implementation of safepoints can be helpful when working on the OpenJDK. This blog post showed the inner workings, focusing on a bug in the TemplateInterpreter related to the safepoints checks.

Thank you for being with me on this journey down a rabbit hole, and see you next week with a blog post on profiling APIs.

This post is part of my work in the SapMachine team at SAP, making profiling easier for everyone. Thanks to Richard Reingruber, Matthias Baesken, Jaroslav Bachorik, Lutz Schmitz, and Aleksey Shipilëv for their invaluable input.

jmethodIDs in Profiling: A Tale of Nightmares

jmethodIDs identify methods in many low-level C++ JVM API methods (JVMTI). These ids are used in debugging related methods like SetBreakpoint(jvmtiEnv*,jmethodID,jlocation) and, of course, in the two main profiling APIs in the OpenJDK, GetStackTrace, and AsyncGetCallTrace (ASGCT):

JVMTI has multiple helper methods to get the methods name, signature, declaring class, modifiers, and more for a given jmethodID. Using these IDs is, therefore, an essential part of developing profilers but also a source of sorrow:

Honestly, I don’t see a way to use jmethodID safely.

Jaroslav Bachorik, profiler developer

In this blog post, I will tell you about the problems of jmethodID that keep profiler writers awake at night and how I intend to remedy the situation for profiler writers in JEP 435.

Background

But first: What are jmethodIDs, and how are they implemented?

[A jmethodID] identifies a Java programming language method, initializer, or constructor. jmethodIDs returned by JVMTI functions and events may be safely stored. However, if the class is unloaded, they become invalid and must not be used.

JVMTI SPECIFICATION

In OpenJDK, they are defined as pointers to an anonymous struct (source). Every Java method is backed by an object of the Method class in the JDK. jmethodIDs are actually just pointing to a pointer that points to the related method object (source):

This indirection creates versatility: The jmethodID stays the same when methods are redefined (see Instrumenting Java Code to Find and Handle Unused Classes for an example of a Java agent which redefines classes).

This is not true for jclass, the jmethodID pendant for classes that points directly to a class object:

The jclass becomes invalid if the class is redefined.

jmethodIDs are allocated on demand because they can stay with the JVM till the defining class is unloaded. The indirections for all ids are stored in the jmethodID cache of the related class (source). This cache has a lock to guard its parallel access from different threads, and the cache is dynamically sized (similar to the ArrayList implementation) to conserve memory.

OpenJ9 also uses an indirection (source), but my understanding of the code base is too limited to make any further claims, so the rest of the blog post is focused on OpenJDK. Now over to the problems for profiler writers:

Problems

The fact that jmethodIDs are dynamically allocated in resizable caches causes major issues: Common profilers, like async-profiler, use AsyncGetCallTrace, as stated in the beginning. ASGCT is used inside signal handlers where obtaining a lock is unsupported. So the profiler has to ensure that every method that might appear in a trace (essentially every method) has an allocated jmethodID before the profiling starts. This leads to significant performance issues when attaching profilers to a running JVM. This is especially problematic in OpenJDK 8:

[…] the quadratic complexity of creating new jmethodIDs during class loading: for every added jmethodID, HotSpot runs a linear scan through the whole list of previously added jmethodIDs trying to find an empty slot, when there are usually none. In extreme cases, it took hours (!) to attach async-profiler to a running JVM that had hundreds thousands classes: https://github.com/async-profiler/async-profiler/issues/221

Andrei Pangin, developer of Async-Profiler

A jmethodID becomes invalid when its defining class is unloaded. Still, there is no way for a profiler to know when a jmethodID becomes invalid or even get notified when a class is unloaded. So processing a newly observed jmethodID and obtaining the name, signature, modifiers, and related class, should be done directly after obtaining the id. But this is impossible as all accessor methods allocate memory and thereby cannot be used in signal handlers directly after AsyncGetCallTrace invocations.

As far as I know, methods can be unloaded concurrently to
the native code executing JVMTI functions. This introduces a potential race
condition where the JVM unloads the methods during the check->use flow,
making it only a partial solution. To complicate matters further, no method
exists to confirm whether a jmethodID is valid.

Theoretically, we could monitor the CompiledMethodUnload event to track
the validity state, creating a constantly expanding set of unloaded
jmethodID values or a bloom filter, if one does not care about few
potential false positives. This strategy, however, doesn’t address the
potential race condition, and it could even exacerbate it due to possible
event delays. This delay might mistakenly validate a jmethodID value that
has already been unloaded, but for which the event hasn’t been delivered
yet.

Honestly, I don’t see a way to use jmethodID safely unless the code using
it suspends the entire JVM and doesn’t resume until it’s finished with that
jmethodID. Any other approach might lead to JVM crashes, as we’ve
observed with J9.

Jaroslav Bachorik ON ThE OpenJDK MailingList

(Concurrent) class unloading, therefore, makes using all profiling APIs inherently unsafe.

jclass ids suffer from the same problems, but ses, we could just process all jmethodIDs and jclass ids, whenever a class is loaded and store all information on all classes, but this would result in a severe performance penalty, as only a subset of all methods actually appears in the observed traces. This approach feels more like a hack.

While jmethodIDs are pretty helpful for other applications like writing debuggers, they are unsuitable for profilers. As I’m currently in the process of developing a new profiling API, I started looking into replacements for jmethodIDs that solve all the problems mentioned before:

Solution

My solution to all these problems is ASGST_Method and ASGST_Class, replacements for jmethodID and jclass, with signal-safe helper methods and a proper notification mechanism for class, unloads, and redefinitions.

The level of indirection that jmethodID offers is excellent, but directly mapping ASGST_Method to method objects removes the problematic dynamic jmethodID allocations. The main disadvantage is that class redefinitions cause a method to have a new ASGST_Method id and a new ASGST_Class id. We solve this the same way JFR solves it:

We use a class local id (idnum) for every method and a JVM internal class idnum, which are both redefinition invariant. The combination of class and method idnum (cmId) is then a unique id for a method. The problem with this approach is that mapping a cmId to an ASGST_Method or a method object is prohibitively expensive as it requires the JVM to check all methods of all classes. Yet this is not a problem in the narrow space of profiling, as a self-maintained mapping from a cmId to collected method information is enough.

The primary method for getting the method information, like name and signature, is ASGST_GetMethodInfo in my proposal:

// Method info
// You have to preallocate the strings yourself 
// and store the lengths in the appropriate fields, 
// the lengths are set to the respective
// string lengths by the VM, 
// be aware that strings are null-terminated
typedef struct {
  ASGST_Class klass;
  char* method_name;
  jint method_name_length;
  char* signature;
  jint signature_length;
  char* generic_signature;
  jint generic_signature_length;
  jint modifiers;
  jint idnum; // class local id, doesn't change with redefinitions
  jlong class_idnum; // class id that doesn't change
} ASGST_MethodInfo;

// Obtain the method information for a given ASGST_Method and 
// store it in the pre-allocated info struct.
// It stores the actual length in the *_len fields and 
// a null-terminated string in the string fields.
// A field is set to null if the information is not available.
//
// Signal safe
void ASGST_GetMethodInfo(ASGST_Method method,
                         ASGST_MethodInfo* info);

jint ASGST_GetMethodIdNum(ASGST_Method method);

The similar ASGST_Class related is ASGST_GetClassInfo:

// Class info, like the method info
typedef struct {
  char* class_name;
  jint class_name_length;
  char* generic_class_name;
  jint generic_class_name_length;
  jint modifiers;
  jlong idnum; // id, doesn't change with redefinitions
} ASGST_ClassInfo;

// Similar to GetMethodInfo
//
// Signal safe
void ASGST_GetClassInfo(ASGST_Class klass,
                        ASGST_ClassInfo* info);

jlong ASGST_GetClassIdNum(ASGST_Class klass);

Both methods return a subset of the information available through JVMTI methods. The only information missing that is required for profilers is the mapping from method byte-code index to line number:

typedef struct {
  jint start_bci;
  jint line_number;
} ASGST_MethodLineNumberEntry;

// Populates the method line number table, 
// mapping BCI to line number.
// Returns the number of written elements
//
// Signal safe
int ASGST_GetMethodLineNumberTable(ASGST_Method method, 
  ASGST_MethodLineNumberEntry* entries, int length); 

All the above methods are signal safe so the profiler can process the methods directly. Nonetheless, I propose conversion methods so that the profiler writer can use jmethodIDs and jclass ids whenever needed, albeit with the safety problems mentioned above:

jmethodID ASGST_MethodToJMethodID(ASGST_Method method);

ASGST_Method ASGST_JMethodIDToMethod(jmethodID methodID);

jclass ASGST_ClassToJClass(ASGST_Class klass);

ASGST_Class ASGST_JClassToClass(jclass klass);

The last part of my proposal deals with invalid class and method ids: I propose a call-back for class unloads, and redefinitions, which is called shortly before the class and the method ids become invalid. In this handler, the profiler can execute its own code, but no JVMTI methods and only the ASGST_* methods that are signal-safe.

Remember that the handler can be executed concurrently, as classes can be unloaded concurrently. Class unload handlers must have the following signature:

void ASGST_ClassUnloadHandler(ASGST_Class klass, 
  ASGST_Method *methods, int count, bool redefined, void* arg);

These handlers can be registered and deregistered:

// Register a handler to be called when class is unloaded
//
// not signal and safe point safe
void ASGST_RegisterClassUnloadHandler(
  ASGST_ClassUnloadHandler handler, void* arg);

// Deregister a handler to be called when a class is unloaded
// @returns true if handler was present
//
// not signal and safe point safe
bool ASGST_DeregisterClassUnloadHandler(
  ASGST_ClassUnloadHandler handler, void* arg);

The arg parameter is passed directly to the handler as context information. This is due to the non-existence of proper closures or lambdas in C.

You might wonder we my API would allow multiple handlers. This is because a JVM should support multiple profilers at once.

Conclusion

jmethodIDs are unusable for profiling and cause countless errors, as every profiler will tell you. In this blog post, I offered a solution I want to integrate into the new OpenJDK profiling API (JEP 435). My proposal provides the safety that profiler writers crave. If you have any opinions on this proposal, please let me know. You can find a draft implementation can be found on GitHub.

See you next week with a blog post on safe points and profiling.

This project is part of my work in the SapMachine team at SAP, making profiling easier for everyone. Thanks to Martin Dörr, Andrei Pangin, and especially Jaroslav Bachorik for their invaluable input on my proposal and jmethodIDs.

I could write a blog post, or …

My goal is to write a blog post every two weeks, it’s great to stick to a schedule and force yourself to publish pieces even if they are not perfect. This doesn’t mean that these blog posts are terrible, just that they could need a bit more polish or could cover a bit more of the topic. But I know many people that have dozens of half-finished blog posts in their pipeline, which aren’t just there and so they don’t publish anything for months. Having a rather strict schedule pushes me to create content early and often, helping me to finalize and write down my ideas on a regular basis.

But sometimes… Well sometimes I’m behind schedule (didn’t write a blog post this week and the week before) and I could force myself to write a blog post, or …

… just climb up a castle and enjoy being around friends, looking into the sunset. A blog post can wait a week, but life can’t:

Life is what happens to us while we are making other plans.

Allen Saunders, John Lennon

So go out, visit the world, have friends, and read my blog post on flame-graph construction mid-next week.

This blog post was not supported by SAP, just by my awesome friends who rented accommodation for 30 people near Falkenstein to have a nice weekend.

Debugging OpenJDK Tests in VSCode Without Losing Your Mind

Consider you want to debug a test case of the JDK like serviceability/AsyncGetCallTrace. This test, and many others, are implemented using the Regression Test Harness for the JDK (jtreg):

jtreg is the test harness used by the JDK test framework. This framework is intended primarily for regression tests. It can also be used for unit tests, functional tests, and even simple product tests — in other words, just about any type of test except a conformance test, which belong in a TCK.

As well as API tests, jtreg is designed to be well suited for running both positive and negative compiler tests, simple manual GUI tests, and (when necessary) tests written in shell script. jtreg also takes care of compiling tests as well as executing them, so there is no need to precompile any test classes.

https://openjdk.org/jtreg/

JTREG is quite powerful, allowing you to combine C++ and Java code, but it makes debugging the C++ parts hard. You could, of course, just debug using printf. This works but also requires lots of recompiles during every debugging session. Attaching a debugger like gdb is possible but rather cumbersome, especially if you want to bring this into a launch.json to enable debugging in VSCode.

But worry no more: My new vsreg utility will do this for you 🙂 You can obtain the tool by just cloning its GitHub repository:

git clone https://github.com/parttimenerd/vsreg

Then pass the make test command to it, which you use to run the test that you want to debug:

vsreg/vsreg.py "ASGCT debug" -- make test TEST=jtreg:test/hotspot/jtreg/serviceability/AsyncGetCallTrace JTREG="VERBOSE=all"

Be sure always to pass JTREG="VERBOSE=all": vsreg executes the command, parses the output, and adds a launch config with the label “ASGCT debug” to the .vscode/launch.json file in the current folder.

The utility is MIT licensed and only tested on Linux. Update: Works also on Mac with lldb.

Example Usage

You’re now able to select “ASGCT debug” in “Run and Debug”:

You can choose the launch config and run the jtreg test with a debugger:

The debugger pauses on a segfault, but there are always a few at the beginning of the execution that can safely be ignored. We can use the program’s pause to add a break-point at an interesting line. After hitting the break-point, we’re able to inspect the local variables…

… and do things like stepping over a line:

Recompilation

If you want to recompile the tests, use make images test-image. You can add a task to your .vscode/tasks.json file and pass the label to the --build-task option:

{
  "version": "2.0.0",
  "tasks": [
    {
      "label": "Make test-image",
      "type": "shell",
      "options": {

          "cwd": "${workspaceFolder}"
      },
      "command": "/usr/bin/gmake",
      "args": ["images", "test-image"],
      "problemMatcher": ["$gcc"]
    }
  ]
}

Options

vsreg has a few options:

usage: vsreg.py [-h] [-t TEMPLATE] [-d] [-b TASK] LABEL COMMAND [COMMAND ...]

Create a debug launch config for a JTREG test run

positional arguments:
  LABEL                 Label of the config
  COMMAND               Command to run

options:
  -h, --help            show this help message and exit
  -t TEMPLATE, --template TEMPLATE
                        Template to use for the launch config, 
                        or name of file without suffix in 
                        vsreg/template folder
  -d, --dry-run         Only print the launch config
  -b TASK, --build-task TASK
                        Task to run before the command

An example template looks like this:

{
  "name": "$NAME",
  "type": "cppdbg",
  "request": "launch",
  "program": "",
  "args": [],
  "stopAtEntry": false,
  "cwd": "",
  "environment": [],
  "externalConsole": false,
  "MIMode": "gdb",
  "miDebuggerPath": "/usr/bin/gdb",
  "setupCommands": [
    {
      "description": "Enable pretty-printing for gdb",
      "text": "-enable-pretty-printing",
      "ignoreFailures": true
    },
    {   
      "description": "The new process is debugged after a fork. The parent process runs unimpeded.",
      "text": "-gdb-set follow-fork-mode child",
      "ignoreFailures": true
    }
  ],
  "preLaunchTask": ""
}

vsreg fills in $NAME (with the label), program (with the used Java binary), args, cwd, environment and preLaunchTask.

Conclusion

vsreg is one of these utilities that solve one specific itch: I hope it also helps others; feel free to contribute to this tool, adding new templates and other improvements on GitHub.

The tool is inspired by bear, “a tool that generates a compilation database for clang tooling.”

If you’re wondering why I have a renewed interest in debugging: I’m working full-time on a new proof-of-concept implementation related to JEP 435.

Update 14th July

vsreg now supports creating debug launch configurations for arbitrary commands, e.g. vsreg/vsreg.py "name" -- command, and supports mac os with LLDB. I use this tool daily at work, so feel free to submit any suggestions, I’m happy to further extend this tool.

This project is part of my work in the SapMachine team at SAP, making profiling easier for everyone.

Report of my small Tour d’Europe

Between 31st May and 14th June, I was on tour, giving seven talks in 4 cities in 3 different countries:

A visualization of all the cities I visited, but I took the train for all transits (except for the Arnhem to Nieuwegein route, where Ties van de Ven drove me in his Tesla).

It was an exciting trip, and I had the pleasure of visiting friends in Zurich and Augsburg and a grain mill shop in Munich.

Sadly there are only recordings of two of my seven talks, but all talks were excellent:

JUG Milano: Your Java Application Is Slow? Check Out These Open-Source Profilers

I gave my updated QCon talk in Milan on 31st May:

This is related to my InfoQ article Unleash the Power of Open Source Java Profilers: Comparing VisualVM, JMC, and async-profile. I had a lot of fun giving the talk, and I hope the audience liked it.

Being in Milan for the first time was fantastic. I was able to stay with Mario Fusco for a few days to enjoy the beauty of Gorgonzola, the suburb of Milan where he lives, and also visit the famous Museo Nazionale della Scienza e della Tecnologia Leonardo da Vinci:

OpenValue Munich Meetup: Writing a Profiler in 240 Lines of Pure Java

I then went on to give a talk at the OpenValue Munich Meetup, based on the previous talk and my Writing a Profiler in 240 Lines of Pure Java article:

But before this, I stayed with friends in Augsburg and Zurich:

Wooden tower near Oerlikon, nearby Zurich

JDriven Full Stack Conference

I gave a similar talk, only with a little more information on why you shouldn’t trust profilers (see), in Nieuwegein:

This concluded my three talks outside of Karlsruhe.

Gulasch Programmier Nacht Karlsruhe

After coming home, I gave two talks at the GPN, one based on the article Do you trust profilers? I once did, too, and one based on the two articles Instrumenting Java Code to Find and Handle Unused Classes and Class Loader Hierarchies. The former talk is recorded:

Karlsruher Entwicklertag

My last two talks in Karlsruhe were my profiling talk from before and a talk with live coding based on my writing a profiler from scratch series.

Conclusion

Giving so many talks during two weeks was interesting, although it proved more taxing than I had hoped. I’m happy to start working on my JEP and fixing bugs; a significant rewrite of the JEP might be on the horizon. The following blog post will probably be related.

If you want to see me giving a talk, either invite me or come to the following few planned talks:

July

September

Oktober

  • Basel One, 18th and 19th October: Unleash the Power Of Open-Source Profilers

Hopefully, there will be more. You can find my past and upcoming talks on my new Talks page.

Class Loader Hierarchies

Understanding class loader hierarchies is essential when developing Java agents, especially if these agents are instrumenting code. In my Instrumenting Java Code to Find and Handle Unused Classes post, I instrumented all classes with an agent and used a Store class in this newly added code:

A challenge here is that all instrumented classes will use the Store. We, therefore, have to put the store onto the bootstrap classpath, making it visible to all classes.

Class loaders are responsible for (possibly dynamically) loading classes, and they form a hierarchy:

A class loader is an object that is responsible for loading classes. The class ClassLoader is an abstract class. Given the binary name of a class, a class loader should attempt to locate or generate data that constitutes a definition for the class. A typical strategy is to transform the name into a file name and then read a “class file” of that name from a file system.

[…]

The ClassLoader class uses a delegation model to search for classes and resources. Each instance of ClassLoader has an associated parent class loader. When requested to find a class or resource, a ClassLoader instance will usually delegate the search for the class or resource to its parent class loader before attempting to find the class or resource itself.

ClassLoader Documentation

An application has multiple class loaders:

A typical Java application has a bootstrap class loader (internal JDK classes and the ClassLoader class itself, implemented in C++ code), a platform classloader (all other JDK classes), and an application/system class loader (application classes):

  • Bootstrap class loader. It is the virtual machine’s built-in class loader, typically represented as null, and does not have a parent.
  • Platform class loader. The platform class loader is responsible for loading the platform classes. Platform classes include Java SE platform APIs, their implementation classes and JDK-specific run-time classes that are defined by the platform class loader or its ancestors. The platform class loader can be used as the parent of a ClassLoader instance. […]
  • System class loader. It is also known as application class loader and is distinct from the platform class loader. The system class loader is typically used to define classes on the application class path, module path, and JDK-specific tools. The platform class loader is the parent or an ancestor of the system class loader, so the system class loader can load platform classes by delegating to its parent.
ClassLoader Documentation

An application might create more class loaders to load classes, e.g., from JARs or do some access control; these classes typically have the application class loader as their parent.

Classes loaded by the application class loader (or children of it) can reference JDK classes but not vice versa. This leads to the problem mentioned before. We can mitigate this by putting all classes that our instrumentation-generated code uses into a runtime JAR which we then “put” on the bootstrap class path.

But we don’t put it there but instead tell the bootstrap class loader to also look into our runtime JAR when looking for a class. We do this by using the method void appendToBootstrapClassLoaderSearch(JarFile jarfile) of the Instrumentation class:

Specifies a JAR file with instrumentation classes to be defined by the bootstrap class loader.

When the virtual machine’s built-in class loader, known as the “bootstrap class loader”, unsuccessfully searches for a class, the entries in the JAR file will be searched as well.

This method may be used multiple times to add multiple JAR files to be searched in the order that this method was invoked.

Instrumentation Documentation

But the documentation also tells us that you can create a giant mess when you aren’t careful, including only the minimal number of required classes in the added JAR:

The agent should take care to ensure that the JAR does not contain any classes or resources other than those to be defined by the bootstrap class loader for the purpose of instrumentation. Failure to observe this warning could result in unexpected behavior that is difficult to diagnose. For example, suppose there is a loader L, and L’s parent for delegation is the bootstrap class loader. Furthermore, a method in class C, a class defined by L, makes reference to a non-public accessor class C$1. If the JAR file contains a class C$1 then the delegation to the bootstrap class loader will cause C$1 to be defined by the bootstrap class loader. In this example an IllegalAccessError will be thrown that may cause the application to fail. One approach to avoiding these types of issues, is to use a unique package name for the instrumentation classes.

Instrumentation Documentation

You have to append the classes to the search path before (!) the first reference of the classes, as a class that cannot be resolved when first referenced will never be adequately resolved.

If you want to learn more on how to write an agent, consider reading my Instrumenting Java Code to Find and Handle Unused Classes blog post or watching my talk Instrument to Remove: Using Java agents for fun and profit at the Gulasch Programmier Nacht at June the 10th (a live stream and recordings will be available).

More information on class loaders can be found in the Baeldung article Class Loaders in Java.

How to get the class loader hierarchy of your project

I wanted to know the class loader hierarchy for my own projects, so of course, I wrote an agent for it: The ClassLoader Hierarchy Agent prints the class loader hierarchy at agent load time, the JVM shutdown, and in regular intervals.

Its usage is quite simple. Just attach it to a JVM or add it at startup:

Usage: java -javaagent:classloader-hierarchy-agent.jar[=maxPackages=10,everyNSeconds=0] <main class>
  maxPackages: maximum number of packages to print per classloader
  every: print the hierarchy every N seconds (0 to disable)

For the finagle-http renaissance benchmark, the agent, for example, prints the following when the benchmark is in full swing:

[root]
  platform
       java.sql
       sun.util.resources.provider
       sun.text.resources.cldr.ext
       sun.util.resources.cldr.provider
    app
         me.bechberger               # class loader hierarchy agent 
         org.renaissance             # benchmark harness code
         org.renaissance.core
      null                           # the actual benchmark
        Thread: finagle/netty4/boss-1
           scala
           scala.collection
           scala.jdk
           scala.io
           scala.runtime

The root node is the bootstrap class loader. For every class loader, it gives us a thread that uses it as its primary class loader, a short list of packages associated with the class loader, and its child class loaders.

Class loaders can have names, but sadly not many class loader creators use this feature, which turns understanding the individual class loader hierarchies into a guessing game. This is especially the case for Spring based applications like the Spring PetClinic:

[root]  
  platform
       java.sql
       javax.sql
       sun.security.ec
       sun.security.jgss
       sun.security.smartcardio
    app
      Thread: main
         me.bechberger
         jdk.jshell.execution.impl
         org.springframework.boot.loader
         jdk.internal.org.jline
         org.springframework.boot.loader.jar
      null
        Thread: mysql-cj-abandoned-connection-cleanup
           jakarta.servlet
           jakarta.validation
           org.postgresql
           jakarta.transaction
           jakarta.el

Feel free to try this agent on your applications; maybe you gain some new insights.

Conclusion

Understanding class loader hierarchies helps to understand subtle problems in writing instrumenting agents. Knowing how to write small agents can empower you to write simple tools to understand the properties of your application.

I hope this blog post helped you to understand class loader hierarchies and agents a little bit better. I’m writing it in a lovely park in Milan:

After giving a talk at JUG Milano on profiling on Wednesday:

Next week, I will write a short article on my talk (with slides and the recording). If you live near Munich, you can attend my talk Write your own Java Profiler in 240 lines of pure Java on Monday, June 5th.

As always, feel free to fork my code, share my article, and send suggestions or corrections; see you next week, either on my blog or in person.

This project is part of my work in the SapMachine team at SAP, making profiling easier for everyone.

Mastering the Art of Controlling the JIT: Unlocking Reproducible Profiler Tests

In my last blog post, I hinted Using Async-Profiler and Jattach Programmatically with AP-Loader, that I’m currently working on a test library for writing better profiling API tests. The library is still work-in-progress, but it already allows you to write profiling API tests in plain Java:

private int innerASGCT2() {
    new Tracer().runASGCT().assertTrue(
        Frame.hasMethod(0, "innerASGCT2", "()I"), 
        Frame.hasMethod(1, "testRunASGCT2"));
    return 0;
}

@Test
public void testRunASGCT2() {
    innerASGCT2();
}

This test case checks that calling AsyncGetCallTrace gives the correct result in this specific example. The test library allows you to write tests comparing the returns of multiple GetStackTrace, AsyncGetCallTrace, and AsyncGetStackTrace invocations in different modes and settings. The library can be found as trace-tester on GitHub; I aim to bring it into the OpenJDK later with my JEP.

Writing small test cases this way is great, but it would be even better if we could force specific methods to be compiled, interpreted, or inlined so that we can test different scenarios. The proposed AsyncGetStackTrace will return the compilation level directly for every frame, so it is necessary to check the correctness of the level too.

Consider reading my Validating Java Profiling APIs post to get a different angle on profiling API testing.

Introduction

Before I start with discussing the ways you can force methods to be compiled, interpreted, or inlined, I’ll have to clarify that:

  1. The following only works with the HotSpot tired JIT compiler and not other JVM’s like OpenJ9 (see issue #11272)
  2. It should only be used for testing. I would refrain from using it anywhere near production, even if you know that specific methods should be compiled. Use a tool like JITWatch by Chris Newland to check whether the JVM doesn’t make the correct decisions automatically: Ask your fellow JVM expert how to deal with this.
  3. I’m not an expert in the APIs I’m showing you, nor in tiered compilation, so be aware that I might be missing something, but I’m happy for any suggestions and corrections.
  4. There are four different compilation levels, but I’m subsuming all C1 variants under the C1 label because some of my used techniques only work on the C1/C2/inlined level. You can read more on tiered compilation in articles like Tiered Compilation in JVM on Baeldung.

Now that I finished the obligatory disclaimer: What are the stages in the life of a method with a tiered JIT?

The first time the JVM executes a method, the method’s byte code is interpreted without compilation. This allows the JVM to gather information on the method, as C1 and C2 are profile guided.

The method is then compiled when the JVM deems this to be beneficial, usually after the method has been executed a few times. The next call of the method will then use the compiled version. The method is initially compiled with different levels of the C1 compiler before finally being C2 compiled, which takes the longest but produces the best native instructions.

The JVM might decide at any point to use the interpreted version of a method by deoptimizing it. The compiled versions are kept, depending on the compiler and the reasons for the deoptimization.

Every compiler can decide to inline called methods of a currently compiled method. A compiler uses the initial byte code for this purpose.

What we want and what we get

The ideal would be to tell the JVM to just use a method in its compiled version, e.g.:

But this is not possible, as the JVM does not have any information it needs for compilation before the first execution of a method. We, therefore, have first to execute the method (or the benchmark) and then set the compilation level:

How do we get it?

We can split the task of forcing a method to be compiled (or inlined, for that matter) into two parts:

  1. Force all methods into their respective state (→ WhiteBox API) after the initial execution.
  2. Force the JIT to never compile a method with a different compiler (→ Compiler Control)

The following is the modified state diagram when forcing a method to be C1 compiled:

In the following, I’ll discuss how to use both the WhiteBox API and Compiler Control to facilitate the wanted behavior.

WhiteBox API

Many JVM tests are written in the JTreg framework, allowing developers to write these tests in Java. But these tests often require specific functionality not regularly available to Java developers. This functionality is exported in the WhiteBox API:

One of the not so well-known tools of the HotSpot VM is its WhiteBox testing API. Introduced in Java 7 it has been significantly improved and extended in Java 8 and 9. It can be used to query or change HotSpot internals which are not otherwise exposed to Java-land. While its features make it an indispensable tool for writing good HotSpot regression tests, it can also be used for experiments or for the mere fun of peeking into the VM. This entry will focus on the usage of the WhiteBox API in Java 8 and 9.

The WhiteBox API is implemented as a Java class (called sun.hotspot.WhiteBox) which defines various entry points into the HotSpot VM. Most of the functionality is implemented natively, directly in the HotSpot VM. The API is implemented as a singleton which can be easily retrieved by calling the static method WhiteBox.getWhiteBox().

Unfortunately, currently even a simple JavaDoc documentation of the API doesn’t exist, so in order to make full use of its functionality, you’ll have to peek right into WhiteBox.java.

The WhiteBox testing API

This API can be used outside of JTreg tests after enabling it by passing -Xbootclasspath/a:wb.jar -XX:+UnlockDiagnosticVMOptions -XX:+WhiteBoxAPI as JVM arguments. To use it, you have to build the WhiteBox JAR from scratch for your specific JVM by calling make build-test-lib (after you set up the build via the configure script).

But please be aware that using this API outside of JVM tests is relatively rare, and the documentation is still non-existent, so using it entails reading a lot of JDK sources and experimentation.

The build target did not work in JDK 21, and when I fixed it, the first question in the PR was by Daniel Jelinski, who asked:

That’s interesting. How did you find this? Is the result of this target used anywhere?
As far as I could tell, the build-test-lib target itself is not used anywhere. The classes that fail to compile here are used by tests without any problems – each test specifies the necessary imports individually. Should we remove this make target instead?

8307732: build-test-lib is broken #13885

So it would be best if you certainly did not depend on it.

The WhiteBox API consists of the singleton class jdk.test.whitebox.WhiteBox which offers many methods: From GC related methods like boolean isObjectInOldGen(Object o) and void fullGC() to NMT-related methods like long NMTMalloc(long size) and JIT-related methods like void deoptimizeAll().

You can even use it to force the compilation of a method and to set JVM flags, as shown in this example by Jean-Philippe Bempel:

public class WhiteBoxTest {
    static WhiteBox wb = WhiteBox.getWhiteBox();

    private void m() {
        System.out.println("foo");
    }

    public static void main(String[] args) throws Exception {
        wb.setBooleanVMFlag("PrintCompilation", true);
        wb.setBooleanVMFlag("BackgroundCompilation", false);
        wb.enqueueMethodForCompilation(
          WhiteBoxTest.class.getDeclaredMethod("m", null), 4);
    }
}

This is from his blog post WhiteBox API, the only blog post I could find on this topic.

Back to our goal of forcing the compilation of a method. It is a good idea to reset the state of a method and deoptimize it to start from a blank slate:

// obtain a method reference
Executable m = X.class.getDeclaredMethod("m", null);
// obtain a WhiteBox instance
WhiteBox wb = WhiteBox.getWhiteBox();
// deooptimize the method
wb.deoptimizeMethod(m);
// clear its state, found by experimentation to be neccessary
wb.clearMethodState(m);

We can then either leave the method uncompiled (for compilation level 0) or enqueue for compilation:

// level 1 - 3: C1, level 4: C2
wb.enqueueMethodForCompilation(m, level);

But be aware that it takes some time to actually compile the method, so it’s best to wait till it is compiled:

while (wb.getMethodCompilationLevel(m) != level) {
    Thread.sleep(1);
}

We can then also force a method to be never inlined:

wb.testSetDontInlineMethod(m, true);
wb.testSetForceInlineMethod(m, false);

Or inversely to be always inlined:

wb.testSetDontInlineMethod(m, false);
wb.testSetForceInlineMethod(m, true);

I implemented this in the WhiteBoxUtil class in my trace-tester library. This allows us to force all methods in their respective states. But the JVM can still decide to optimize further or inline a method, even when specifying the contrary. So we have to force the JVM using the second the Compiler Control specifications.

Compiler Control

This control mechanism has been introduced in Java 9 with JEP 165 by Nils Eliasson:

Summary

This JEP proposes an improved way to control the JVM compilers. It enables runtime manageable, method dependent compiler flags. (Immutable for the duration of a compilation.)

Goals

  • Fine-grained and method-context dependent control of the JVM compilers (C1 and C2)
  • The ability to change the JVM compiler control options in run time
  • No performance degradation

Motivation

Method-context dependent control of the compilation process is a powerful tool for writing small contained JVM compiler tests that can be run without restarting the entire JVM. It is also very useful for creating workarounds for bugs in the JVM compilers. A good encapsulation of the compiler options is also good hygiene.

JEP 165

This mechanism is properly standardized for the OpenJDK, unlike the WhiteBox APi. The compiler control allows to specify compilation settings by defining them in a JSON file and applying them:

  • Using jcmd (see JEP): jcmd <pid> Compiler.add_directives <file>
  • Passing it via JVM arguments: -XX:+UnlockDiagnosticVMOptions -XX:CompilerDirectivesFile=<file>
  • Using the WhiteBox API: int addCompilerDirective(String compDirect)

The following directives specify as an example that the method m should not be C2 compiled and not be inlined:

[
  {
    // can also contain patterns
    "match": ["X::m()"],
    // "-" prefixes not inlined, "+" inlined methods
    "inline": ["-X::m()"],
    "C1": {},
    "C2": {
      "Exclude": true
    }
  }
  // multiple directives supported
  // first directives have priority
]

This, in theory, allows the method to be deoptimized, but this did not happen during my testing. With forced compilation, one can assume that this method will almost be used in its compiled form.

I recommend this Compiler Control guide for a more in-depth guide with all options. An implementation of the control file generation with a fluent API can be found in the trace-tester project in the CompilerDirectives class. Feel free to adapt this for your own projects.

Conclusion

I’ve shown you in this article how to control the JIT to specify the inlining and compilation of methods using two lesser-known JVM APIs. This allows us to write reproducible profiling APIs and makes it easier to check how a profiling API reacts to different scenarios.

If you have any suggestions, feel free to reach out. I look forward to preparing slides for my upcoming talks in Milan, Munich, Arnhem, and Karlsruhe. Feel free to come to my talks; more information soon on Twitter.

This project is part of my work in the SapMachine team at SAP, making profiling easier for everyone.