Welcome to the last blog post of the year. Last week, I discussed the limitations of custom JFR events. This week, I’ll also be covering a profiling-related topic and showcasing a tiny tool called JStall.
I hope I’m not the only one who sometimes wonders: “What is my Java application doing right now?” When you don’t see any output. Yes, you could perform a simple thread dump via jstack, but it is hard to understand which threads are actually consuming CPU and making any sort of progress. This is where my tiny tool called JStall comes in:
JStall is a small command-line tool for one-shot inspection of running JVMs using thread dumps and short, on-demand profiling. The tool essentially takes multiple thread dumps of your application and uses the per-thread cpu-time information to find the most CPU-time-consuming Java threads.
First, download the JStall executable from the GitHub releases page. Let us then start by finding the currently running JVMs:
> ./jstall
Usage: jstall <command> <pid|files> [options]

Available commands:
  status     - Show overall status (deadlocks + most active threads)
  deadlock   - Check for deadlocks
  most-work  - Show threads doing the most work
  flame      - Generate flame graph
  threads    - List all threads

Available JVMs:
  7153 ./jstall
  1223 <unknown>
  8136 ./renaissance-gpl-0.16.0.jar
  6138 org.jetbrains.idea.maven.server.RemoteMavenServer36
  5597 DeadlockDemo
  49294 com.intellij.idea.Main
This provides us with a list of options for the main status command, as well as a list of JVM processes and their corresponding main classes. Let’s start checking for deadlocking:
JDK Flight Recorder (JFR) provides support for custom events as a profiler. Around two years ago, I wrote a blog post on this very topic: Custom JFR Events: A Short Introduction. These custom events are beneficial because they enable us to record additional project-specific information alongside the standard JFR events, all in the same file. We can then view and process this information with the JFR tools. You can freely specify these events in Java.
There is only one tiny problem nobody talks about: Array support (and, in more general, the support of complex types).
Welcome back to my blog, this time for a blog post on profiling your Java applications in Cloud Foundry and the tool I helped to develop to make it easier.
Cloud Foundry “is an open source, multi-cloud application platform as a service (PaaS) governed by the Cloud Foundry Foundation, a 501(c)(6) organization” (Wikipedia). It allows you to run your workloads easily in the cloud, including your Java applications. You just need to define a manifest.yml, like for example:
But how would you profile this application? This and more is the topic of this blog post.
I will not discuss why you might want to use Cloud Foundry or how you can deploy your own applications. I assume you came this far in the blog post because you already have basic Cloud Foundry knowledge and want to learn how to profile your applications easily.
The Java Plugin
Cloud Foundry has a cf CLI with a proper plugin system with lots of plugins. A team at SAP, which included Tim Gerrlach, started to develop the Java plugin many years ago at SAP. It’s a plugin offering utilities to gain insights into JVMs running in your Cloud Foundry app.
The changes I described in this blog post led to segfaults in tests, so I backtracked on them for now. Maybe I made a mistake implementing the changes, or my reasoning in the blog post is incorrect. I don’t know yet.
Should the queue implementation use Atomics and acquire-release semantics?
This is what we cover in this short blog post. First, to the rather fun topic:
Is it a Queue?
I always called the primary data structure a queue, but recently, I wondered whether this term is correct. But what is a queue?
Definition: A collection of items in which only the earliest added item may be accessed. Basic operations are add (to the tail) or enqueue and delete (from the head) or dequeue. Delete returns the item removed. Also known as “first-in, first-out” or FIFO.
Welcome back to my series on the new CPU-time profiler in Java 25. In the previous blog post, I covered the implementation of the new profiler. In this week’s blog post, I’ll dive deep into the central request queue, focusing on deciding its proper size.
The JfrCPUTimeTraceQueue allows the signal handler to record sample requests that the out-of-thread sampler and the safepoint handler process. So it’s the central data structure of the profiler:
This queue is thread-local and pre-allocated, as it’s used in the signal handler, so the correct sizing is critical:
If the size is too small, you’ll lose many samples because the signal handler can’t record sample requests.
If you size it too large, you waste lots of memory. A sampling request is 48 bytes, so a queue with 500 elements (currently the default) requires 24kB. This adds up fast if you have more than a few threads.
So, in this blog post, we’re mainly concerned about setting the correct default size and discussing a potential solution to the whole problem.
I developed, together with others, the new CPU-time profiler for Java, which is now included in JDK 25. A few weeks ago, I covered the profiler’s user-facing aspects, including the event types, configuration, and rationale, alongside the foundations of safepoint-based stack walking in JFR (see Taming the Bias: Unbiased Safepoint-Based Stack Walking). If you haven’t read those yet, I recommend starting there. In this week’s blog post, I’ll dive into the implementation of the new CPU-time profiler.
It was a remarkable coincidence that safepoint-based stack walking made it into JDK 25. Thanks to that, I could build on top of it without needing to re-implement:
The actual stack walking given a sampling request
Integration with the safepoint handler
Of course, I worked on this before, as described in Taming the Bias: Unbiased Safepoint-Based Stack Walking. But Erik’s solution for JDK 25 was much more complete and profited from his decades of experience with JFR. In March 2025, whether the new stack walker would get into JDK 25 was still unclear. So I came up with other ideas (which I’m glad I didn’t need). You can find that early brain-dump in Profiling idea (unsorted from March 2025).
In this post, I’ll focus on the core components of the new profiler, excluding the stack walking and safepoint handler. Hopefully, this won’t be the last article in the series; I’m already researching the next one.
Main Components
There are a few main components of the implementation that come together to form the profiler:
Ever wondered how the views of the jfr tool are implemented? There are views like hot-methods which gives the most used methods, or cpu-load-samples that gives you the system load over time that you can directly use on the command line:
> jfr view cpu-load-samples recording.jfr

                                     CPU Load

Time                         JVM User           JVM System           Machine Total
------------------ ------------------ -------------------- -----------------------
14:33:29                        8,25%                0,08%                  29,65%
14:33:30                        8,25%                0,00%                  29,69%
14:33:31                        8,33%                0,08%                  25,42%
14:33:32                        8,25%                0,08%                  27,71%
14:33:33                        8,25%                0,08%                  24,64%
14:33:34                        8,33%                0,00%                  30,67%
...
This is helpful when glancing at JFR files and trying to roughly understand their contents, without loading the files directly into more powerful, but also more resource-hungry, JFR viewers.
In this short blog post, I’ll show you how the views work under the hood using JFR queries and how to use the queries with my new experimental JFR query tool.
I didn’t forget the promised blog post on implementing the new CPU-time profiler in JDK 25; it’ll come soon.
Under the hood, JFR views use a built-in query language to define all views in the view.ini file. The above is, for example, defined as:
More than three years in the making, with a concerted effort starting last year, my CPU-time profiler landed in Java with OpenJDK 25. It’s an experimental new profiler/method sampler that helps you find performance issues in your code, having distinct advantages over the current sampler. This is what this week’s and next week’s blog posts are all about. This week, I will cover why we need a new profiler and what information it provides; next week, I’ll cover the technical internals that go beyond what’s written in the JEP. I will quote the JEP 509 quite a lot, thanks to Ron Pressler; it reads like a well-written blog post in and of itself.
Before I show you its details, I want to focus on what the current default method profiler in JFR does:
Two years ago, I still planned to implement a new version of AsyncGetCallTrace in Java. This plan didn’t materialize, but Erik Österlund had the idea to fully walk the stack at safepoints during the discussions. Walking stacks only at safepoints normally would incur a safepoint-bias (see The Inner Workings of Safepoints), but when you record some program state in signal handlers, you can prevent this. I wrote about this idea and its basic implementation in Taming the Bias: Unbiased Safepoint-Based Stack Walking. I’ll revisit this topic in this week’s short blog post because Markus Grönlund took Erik’s idea and started implementing it for the standard JFR method sampler:
JFR (JDK Flight Recorder) is the default profiler for OpenJDK (see my other blog posts for more information). What makes JFR stand out from the other profilers is the ability to log many, many different events that contain lots of information, like information on class loading, JIT compilation, and garbage collection. You can see a list of all available events on my JFR Event Collection website:
This website gives an overview of the events, with descriptions from the OpenJDK, their properties, examples, configurations, and the JDK versions in which every event is present. However, few descriptions are available, and the available texts are mostly single sentences.
TL:DR: I used GPT3.5 to create a description for every event by giving it the part of the OpenJDK source code that creates the event.
For most events, I state the lack of a description, coupled with a request that the knowledgeable reader might contribute one:
But as you can see, there is not really any progress in creating documentation. So, I have two options left:
Ask knowledgeable JDK developers to add descriptions: It’s time-consuming, and it would only be added in the next release
Write the descriptions myself directly for the website: This is pretty time-consuming, with over 150 events per JDK version.
Task AI to interpret the code that creates each event in the JDK source code.
With 1. and 2. infeasible, I started working on the AI approach, implementing it in my JFR event collector tool that collects the information displayed on the website.
I tried to use local AI models for this project but failed, so I started using GPT3.5-turbo and testing it on the OpenAI ChatGPT website. The main structure of my endeavor is as follows:
For every event, I first collect all usages and creations in the OpenJDK source, and then I construct a prompt of the following form that includes the surrounding context of the source locations:
Explain the JFR event <event> concisely so that the reader, proficient in JFR, knows the meaning and relevance of the event to profiling and its fields, without giving code snippets or referencing the code directly, take the following code as the context of its usage and keep it short and structured (and in markdown format, so format it properly to make it readable, using bullet points for field lists, but nothing else): <context>
Now some information about the event: Fields: <fields> It is <flags: experimental, internal>
Don’t mention implementation details, like methods, but explain the meaning of the event and how to use it for profiling. Keep field names lowercase and in backticks. Don’t use headings. Don’t repeat yourself. Keep it short.
For example, I asked ChatGPT the following for the ReservedStackActivation event:
Explain the JFR event ReservedStackActivation […]:
I then pass this prompt to GPT-3.5 and obtain the result:
The ReservedStackActivation event in JFR signifies a potentially dangerous stack overflow in a Java method that has been annotated with ReservedStackAccess. It is used for profiling purposes to identify methods that may be causing stack overflows.
The relevant field for this event is:
method: Represents the Java method where the potential stack overflow occurred.
My prompt and the code used to find the usage contexts, simple regular expressions without C++ parsing, is quite simplistic, but the results are somewhat usable.
But this event has also a description:
Activation of Reserved Stack Area caused by stack overflow with ReservedStackAccess annotated method in call stack
Why did I choose this event, then? Because it allows you to compare the LLM generated and the OpenJDK developer’s written description. Keep in mind that the LLM did not get passed the event description. The generated version is similar, yet more text.
You can find my implementation on GitHub (GPLv2.0 licensed) and the generated documentation on the JFR Event Collection:
Conclusion
I’m unsure whether I like or dislike the results of this experiment: It’s, on the one hand, great to generate descriptions for events that didn’t have any, using the code as the source of truth. But does it really give new insights, or is it just bloated text? I honestly don’t know whether the website needs it. Therefore, I am currently just generating it for JDK 21 and might remove the feature in the future. The AI can’t replace the insights you get by reading articles on specific events, like Gunnar Morling’s recent post on the NativeMemory events.
Do you have any opinions on this? Feel free to use the usual channels to voice your opinion, and consider improving the JFR documentation if you can.
See you next week with a blog post on something completely different yet slightly related to Panama and the reason for my work behind last week’s From C to Java Code using Panama article. Consider this as my Christmas present to my readers.
This article is part of my work in the SapMachine team at SAP, making profiling and debugging easier for everyone. Thanks to Vedran Lerenc for helping me with the LLM part of this project.
Or: I just released version 0.0.11 with a cool new feature that I can’t wait to tell you about…
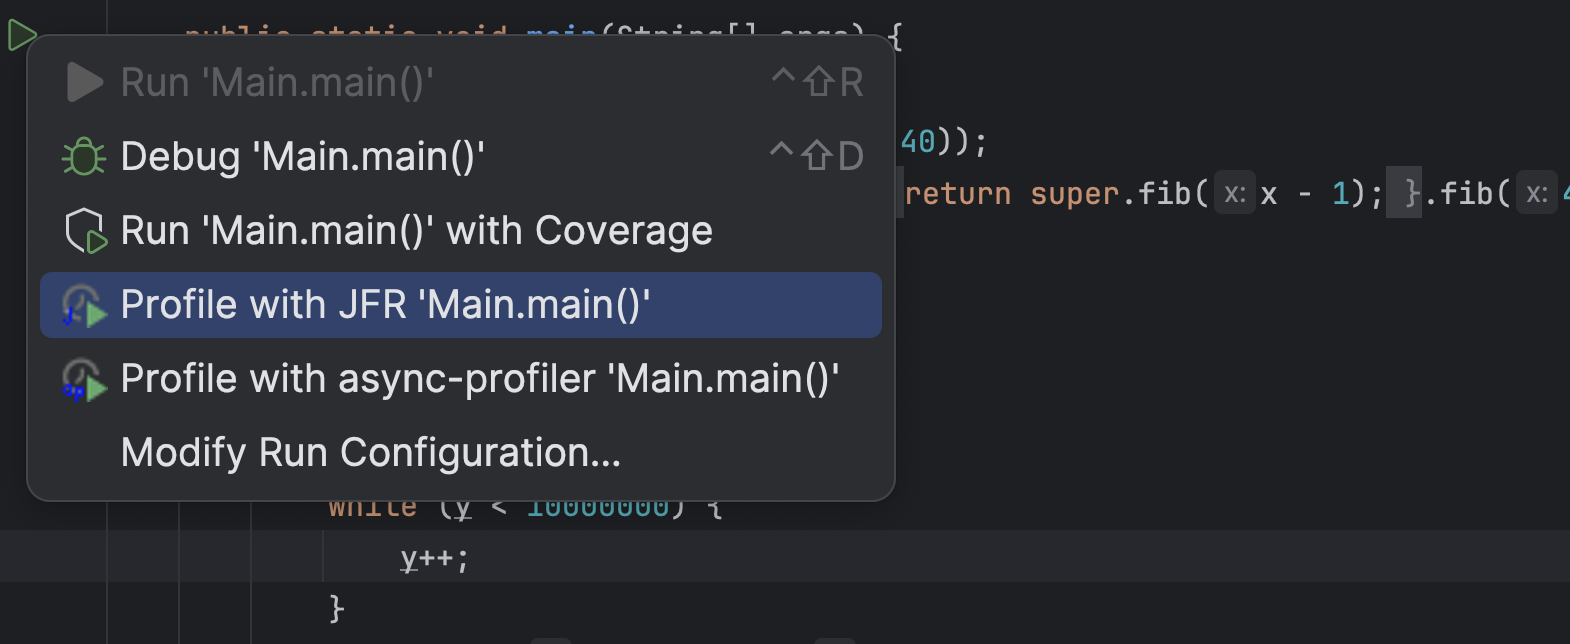
According to the recent JetBrains survey, most people use Maven as their build system and build Spring Boot applications with Java. Yet my profiling plugin for IntelliJ only supports profiling pure Java run configuration. Configurations where the JVM gets passed the main class to run. This is great for tiny examples where you directly right-click on the main method and profile the whole application using the context menu:
But this is not great when you’re using the Maven build system and usually run your application using the exec goal, or, god forbid, use Spring Boot or Quarkus-related goals. Support for these goals has been requested multiple times, and last week, I came around to implementing it (while also two other bugs). So now you can profile your Spring Boot, like the Spring pet-clinic, application running with spring-boot:run:
Giving you a profile like:
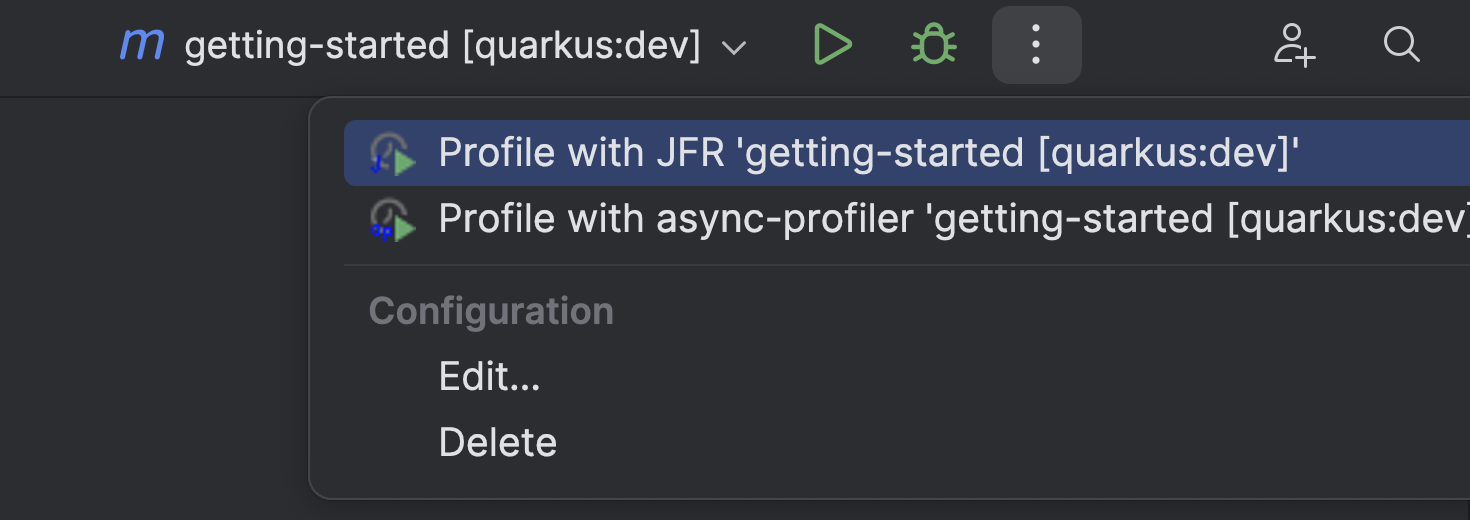
Or your Quarkus application running with quarkus:dev:
Giving you a profile like:
This works specifically by using the options of these goals, which allows the profiler plugin to pass profiling-specific JVM options. If the plugin doesn’t detect a directly supported plugin, it passes the JVM options via the MAVEN_OPTS environment variable. This should work with the exec goals and others.
Gradle script support has also been requested, but despite searching the whole internet till the night, I didn’t find any way to add JVM options to the JVM that Gradle runs for the Spring Boot or run tasks without modifying the build.gradle file itself (see Baeldung).
I left when it was dark and rode out into the night with my bike. Visiting other lost souls in the pursuit of sweet potato curry.
Only Quarku’s quarkusDev task has the proper options so that I can pass the JVM options. So, for now, I only have basic Quarkus support but nothing else. Maybe one of my readers knows how I could still provide profiling support for non-Quarkus projects.
You can configure the options that the plugin uses for specific task prefixes yourself in the .profileconfig.json file:
{
    "additionalGradleTargets": [
        {
            // example for Quarkus
            "targetPrefix": "quarkus",
            "optionForVmArgs": "-Djvm.args",
            "description": "Example quarkus config, adding profiling arguments via -Djvm.args option to the Gradle task run"
        }
    ],
    "additionalMavenTargets": [
        {   // example for Quarkus
            "targetPrefix": "quarkus:",
            "optionForVmArgs": "-Djvm.args",
            "description": "Example quarkus config, adding profiling arguments via -Djvm.args option to the Maven goal run"
        }
    ]
}
This update has been the first one with new features since April. The new features should make life easier for profiling both real-world and toy applications. If you have any other feature requests, feel free to create an issue on GitHub and, ideally, try to create a pull request. I’m happy to help you get started.
See you next week on some topics I have not yet decided on. I have far more ideas than time…
This article is part of my work in the SapMachine team at SAP, making profiling and debugging easier for everyone. Thanks to the issue reporters and all the other people who tried my plugin.
Java Flight Recorder (JFR) is one of the main open-source profilers for Java, and the only one built directly into the OpenJDK. You can find an introduction to Java profiling in my InfoQ Unleash the Power of Open-Source Profilers article and additional information and presentation on my Profiling Talks page. Furthermore, I wrote an introduction to custom JFR events: Custom JFR Events: A Short Introduction. JFR and custom events are pretty helpful when profiling applications, this blog post gives you an example from the real world.
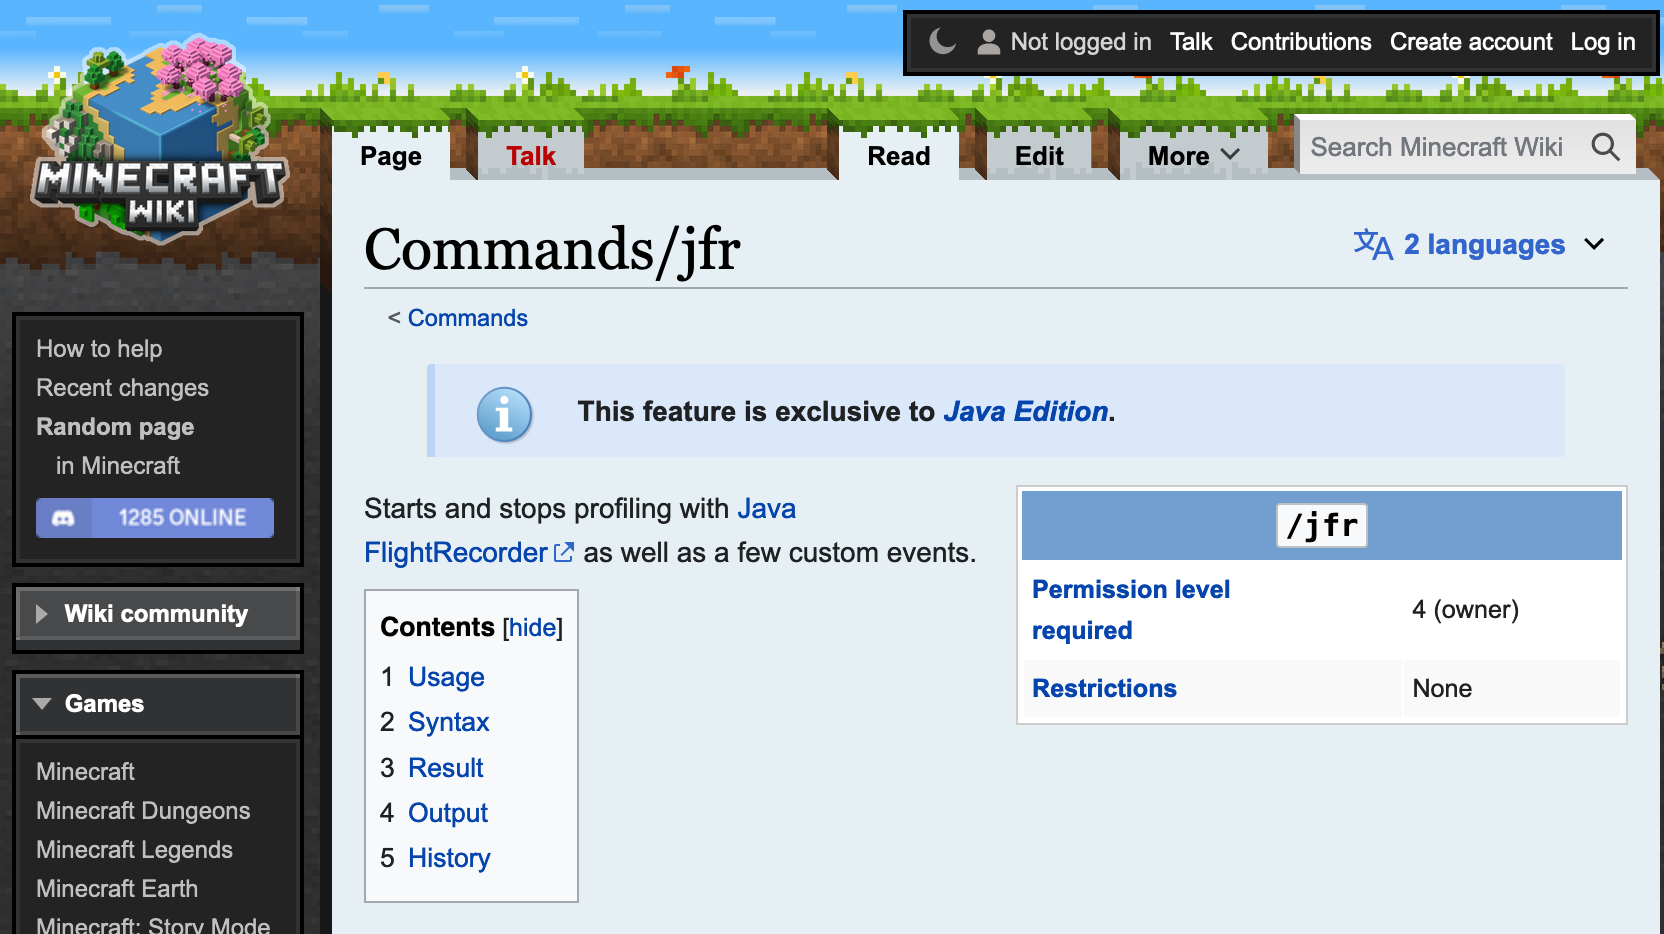
I was searching for some JFR-related settings on the internet when I stumbled upon the /jfr command that exists in Minecraft:
This, of course, intrigued me, especially as Minecraft apparently adds some custom JFR events:
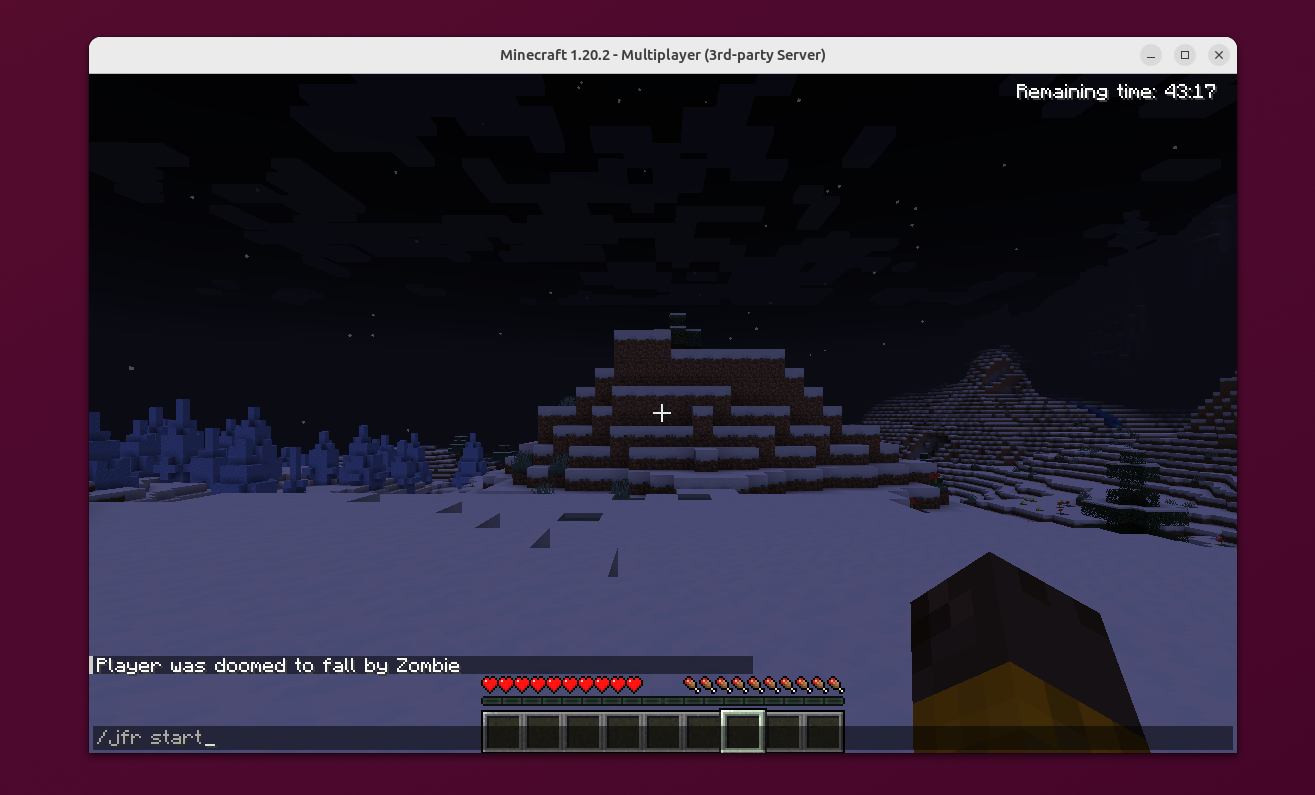
So I had to check it out. I downloaded and started the Java server, got a demo account, and connected to my local instance. This works with a demo account when you launch the demo world, enable the cheat mode in the settings, kick yourself via “/kick @p,” and then select your own server. I found this via this bug report.
You then must ensure that you have OP privileges and add them, if not via the Minecraft server shell. Then, you can type /jfr start in the chat (launch it by typing T) to start the recording and /jfr stop to stop it.
You see that it’s my first time “playing” Minecraft, and I’m great at getting attacked. It’s probably also my last time.
Minecraft stores the JFR file in the debug folder in the working directory of your server, both as a JFR file and as a JSON file. You can view the JFR file in a JFR viewer of your choice, like JMC or my IntelliJ JFR plugin (web view of the file, JFR file itself), and explore the custom JFR events:
This lets you get insights into the chunk generation and specific traffic patterns of the Minecraft server.
But what does the event specification look like? We could disassemble the Minecraft JAR and potentially get into legal trouble, or we could just use the jfr utility with its metadata command and get an approximation of the event definition from the JFR metadata:
@Name("minecraft.ChunkGeneration")
@Label("Chunk Generation")
@Category({"Minecraft", "World Generation"})
class ChunkGeneration extends jdk.jfr.Event {
  @Label("Start Time")
  @Timestamp("TICKS")
  long startTime;

  @Label("Duration")
  @Timespan("TICKS")
  long duration;

  @Label("Event Thread")
  @Description("Thread in which event was committed in")
  Thread eventThread;

  @Label("Stack Trace")
  @Description("Stack Trace starting from the method the event was committed in")
  StackTrace stackTrace;

  @Label("First Block X World Position")
  int worldPosX;

  @Label("First Block Z World Position")
  int worldPosZ;

  @Label("Chunk X Position")
  int chunkPosX;

  @Label("Chunk Z Position")
  int chunkPosZ;

  @Label("Status")
  String status;

  @Label("Level")
  String level;
}
You can find all defined events here. The actual implementation of these events is only slightly larger because some events accumulate data over a period of time.
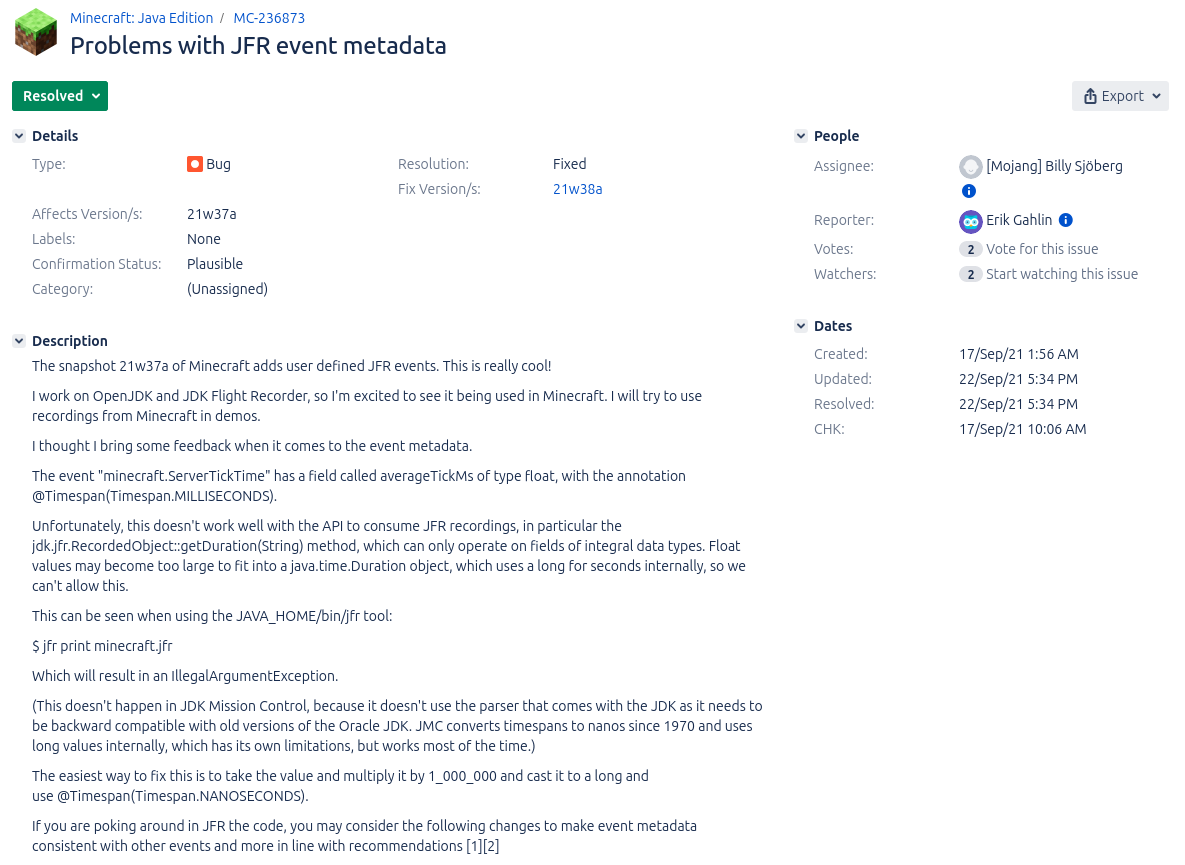
I’m, of course, not the first OpenJDK developer who stumbled upon these custom events. Erik Gahlin even found them shortly after their addition in 2021 and promptly created an issue to recommend improvements (see MC-236873):
Conclusion
In my previous blog post, I showed you how to create custom JFR events for a small sample application. Seeing custom events in Minecraft shows you that custom events are used in the wild by applications used by millions of users, helping developers improve the performance of their applications.
JDK Flight Recorder (JFR) is one of the two prominent open-source profilers for the OpenJDK (besides async-profiler). It offers many features (see Profiling Talks) and the ability to observe lots of information by recording over one hundred different events. If you want to know more about the existing events, visit my JFR Event Collection website (related blog post):
Besides these built-in events, JFR allows you to implement your events to record custom information directly in your profiling file.
Let’s start with a small example to motivate this. Consider for a moment that we want to run the next big thing after Software-as-a-Service: Math-as-a-Service, a service that provides customers with the freshest Fibonacci numbers and more.
We develop this service using Javalin:
public static void main(String[] args) throws Exception {
    // create a server with 4 threads in the thread pool
    Javalin.create(conf -> {
            conf.jetty.server(() ->
                new Server(new QueuedThreadPool(4))
            );
            })
            .get("/fib/{fib}", ctx -> {
                handleRequest(ctx, newSessionId());
            })
            .start(7070);
    System.in.read();
}

static void handleRequest(Context ctx, int sessionId) {
    int n = Integer.parseInt(ctx.pathParam("fib"));
    // log the current session and n
    System.out.printf("Handle session %d n = %d\n", sessionId, n);
    // compute and return the n-th fibonacci number
    ctx.result("fibonacci: " + fib(n));
}

public static int fib(int n) {
    if (n <= 1) {
        return n;
    }
    return fib(n - 1) + fib(n - 2);
}
This is a pretty standard tiny web endpoint, minus all the user and session handling. It lets the customer query the n-th Fibonacci number by querying /fib/{n}. Our built-in logging prints n and the session ID on standard out, but what if we want to store it directly in our JFR profile while continuously profiling our application?
This is where custom JFR events come in handy:
public class SessionEvent extends jdk.jfr.Event {
    int sessionId;
    int n;

    public SessionEvent(int sessionId, int n) {
        this.sessionId = sessionId;
        this.n = n;
    }
}
The custom event class extends the jdk.jfr.Event class and simply define a few fields for the custom data. These fields can be annotated with @Label("Human readable label") and @Description("Longer description") to document them.
We can now use this event class to record the relevant data in the handleRequest method:
static void handleRequest(Context ctx, int sessionId) {
    int n = Integer.parseInt(ctx.pathParam("fib"));
    System.out.printf("Handle session %d n = %d\n", sessionId, n);
    // create event
    var event = new SessionEvent(sessionId, n);
    // add start and stacktrace
    event.begin();
    ctx.result("fibonacci: " + fib(n));
    // add end and store
    event.commit();
}
This small addition records the timing and duration of each request, as well as n and the session ID in the JFR profile. The sample code, including a request generator, can be found on GitHub. After we ran the server, we can view the recorded events in a JFR viewer, like JDK Mission Control or my JFR viewer (online view):
This was my short introduction to custom JFR events; if you want to learn more, I highly recommend Gunnar Morlings Monitoring REST APIs with Custom JDK Flight Recorder Events article. Come back next week for a real-world example of custom JFR events.
This article is part of my work in the SapMachine team at SAP, making profiling and debugging easier for everyone.
Have you ever wanted to bring your JFR events into context? Adding information on sessions, user IDs, and more can improve your ability to make sense of all the events in your profile. Currently, we can only add context by creating custom JFR events, as I presented in my Profiling Talks:
We can use these custom events (see Custom JFR Events: A Short Introduction and Custom Events in the Blocky World: Using JFR in Minecraft) to store away the information and later relate them to all the other events by using the event’s time, duration, and thread. This works out-of-the-box but has one major problem: Relating events is quite fuzzy, as time stamps are not as accurate (see JFR Timestamps and System.nanoTime), and we do all of this in post-processing.
But couldn’t we just attach some context to every JFR event we’re interested in? Not yet, but Jaroslav Bachorik from DataDog is working on it. Recently, he wrote three blog posts (1, 2, 3). The following is a different take on his idea, showing how to use it in a small file server example.
The main idea of Jaroslav’s approach is to store a context in thread-local memory and attach it to every JFR event as configured. But before I dive into the custom context, I want to show you the example program, which you can find, as always, MIT-licensed on GitHub.
Example
We create a simple file server via Javalin, which allows a user to
Register (URL schema register/{user})
Store data in a file (store/{user}/{file}/{content})
Retrieve file content (load/{user}/{file})
Delete files (delete/{user}/{file})
The URLs are simple to use, and we don’t bother about error handling, user authentication, or large files, as this would complicate our example. I leave it as an exercise for the inclined reader. The following is the most essential part of the application: the server declaration:
This example runs on Jaroslav’s OpenJDK fork (commit 6ea2b4f), so if you want to run it in its complete form, please build the fork and make sure that you’re PATH and JAVA_HOME environment variables are set accordingly.
You can build the server using mvn package and start it, listening on the port 1000, via:
java -jar target/jfr-context-example.jar 1000
You can then use it via your browser or curl:
# start the server
java -XX:StartFlightRecording=filename=flight.jfr,settings=config.jfc \
-jar target/jfr-context-example.jar 1000 &
pid=$!

# register a user
curl http://localhost:1000/register/moe

# store a file
curl http://localhost:1000/store/moe/hello_file/Hello

# load the file
curl http://localhost:1000/load/moe/hello_file
-> Hello

# delete the file
curl http://localhost:1000/delete/moe/hello_file

kill $pid

# this results in the flight.jfr file
To make testing easier, I created the test.sh script, which starts the server, registers a few users and stores, loads, and deletes a few files, creating a JFR file along the way. We're using a custom JFR configuration to enable the IO events without any threshold. This is not recommended for production but is required in our toy example to get any such event:
You can find more information on this and other events in my JFR Event Collection:
There are, of course, other events, but in our file server example, we’re only interested in file events for now (this might change as Jaroslav adds more features to his fork).
Now, we can start bringing the events into context.
Adding Custom Context
Before we can add the context, we have to define it, as described in Jaroslav’s blog post. We create a context that stores the current user, action, trace ID, and optional file:
@Name("tracer-context")
@Description("Tracer context type tuple")
public class TracerContextType extends ContextType implements AutoCloseable {

    private static final AtomicLong traceIdCounter = new AtomicLong(0);

    // attributes are defined as plain public fields annotated by at least @Name annotation
    @Name("user")
    @Description("Registered user")
    public String user;

    @Name("action")
    @Description("Action: register, store, load, delete")
    public String action;

    @Name("file")
    @Description("File if passed")
    public String file;

    // currently no primitives allowed here
    @Name("trace")
    public String traceId;

    public TracerContextType(String user, String action, String file) {
        this.user = user;
        this.action = action;
        this.file = file;
        this.traceId = "" + traceIdCounter.incrementAndGet();
        this.set();
    }

    public TracerContextType(String user, String action) {
        this(user, action,"");
    }

    @Override
    public void close() throws Exception {
        unset();
    }
}
A context has to be set and then later unset, which can be cumbersome in the face of exceptions. Implementing the AutoClosable interface solves this by allowing us to wrap code in a try-with-resources statement:
try (var t = new TracerContextType(/* ... */)) {
    // ...
}
All JFR events with enabled context that happen in the body of the statement are associated with the TracerContextType instance. We can use the code of all request handlers in our server with such a construct, e.g.:
.get("/store/{user}/{file}/{content}", ctx -> {
    String user = ctx.pathParam("user");
    String file = ctx.pathParam("file");
    try (var t = new TracerContextType(user, "store", file)) {
        storage.store(user, file, ctx.pathParam("content"));
        ctx.result("stored");
    }
})
One last thing before we can analyze the annotated events: JFR has to know about your context before the recording starts. We do this by creating a registration class registered as a service.
@AutoService(ContextType.Registration.class)
public class TraceContextTypeRegistration implements ContextType.Registration {

    @Override
    public Stream<Class<? extends ContextType>> types() {
        return Stream.of(TracerContextType.class);
    }
}
We use the auto-service project by Google to automatically create the required build files (read more in this blog post by Pedro Rijo.
Using the Custom Context
After adding the context, we can see it in the jdk.FileRead events:
We clearly see the stored context information (tracer-context_*).
Using the jq tool, we can analyze the events, like calculating how many bytes the server has read for each user:
➜ jfr print --events jdk.FileRead --json flight.jfr |
  jq -r '
    .recording.events
    | group_by(.values."tracer-context_user")
    | map({
      user: .[0].values."tracer-context_user",
      bytesRead: (map(.values.bytesRead) | add)
    })
   | map([.user, .bytesRead])
   | ["User", "Bytes Read"]
   , .[]
   | @tsv
 '
User    Bytes Read
        3390101
bob     80
curly   100
frank   100
joe     80
john    90
larry   100
mary    90
moe     80
sally   100
sue     80
The empty user is for all the bytes read unrelated to any specific user (like class files), which is quite helpful.
Conclusion
This small example is just a glimpse of what is possible with JFR contexts. Jaroslav’s prototypical implementation is still limited; it, e.g., doesn’t support contexts at method sampling events, but it is already a significant improvement over the status quo. I’ll be creating follow-up blog posts as the prototype evolves and matures.
Thanks for coming so far, and see you next week for another blog post and maybe at a meet-up or conference (see Talks).
This article is part of my work in the SapMachine team at SAP, making profiling and debugging easier for everyone.
Walking only at safepoints has advantages: The main one is that you aren’t walking the stack in a signal handler but synchronously to the executed program. Therefore you can allocate memory, acquire locks and rematerialize virtual thread / Loom frames. The latter is significant because virtual threads are the new Java feature that cannot support using signal-handler-based APIs like AsyncGetCallTrace.
Erik summed up the problems with my previous JEP proposal, and in a way with AsyncGetCallTrace, quite nicely:
Well the current proposal doesn’t have a clear story for 1) Making it safe 2) Working with virtual threads 3) Supporting incremental stack scanning 4) Supporting concurrent stack scanning
He proposed that walking Java threads only at safepoints while obtaining some information in the signal handler might do the trick. So I got to work, implementing an API that does just this.
Idea
The current interaction between a sampler of the profiler and the Java Threads looks like the following:
The sampler thread signals every Java thread using POSIX signals and then obtains the full trace directly in the signal handler while the thread is paused at an arbitrary location. I explored variations of this approach in my post Couldn’t we just Use AsyncGetCallTrace in a Separate Thread?
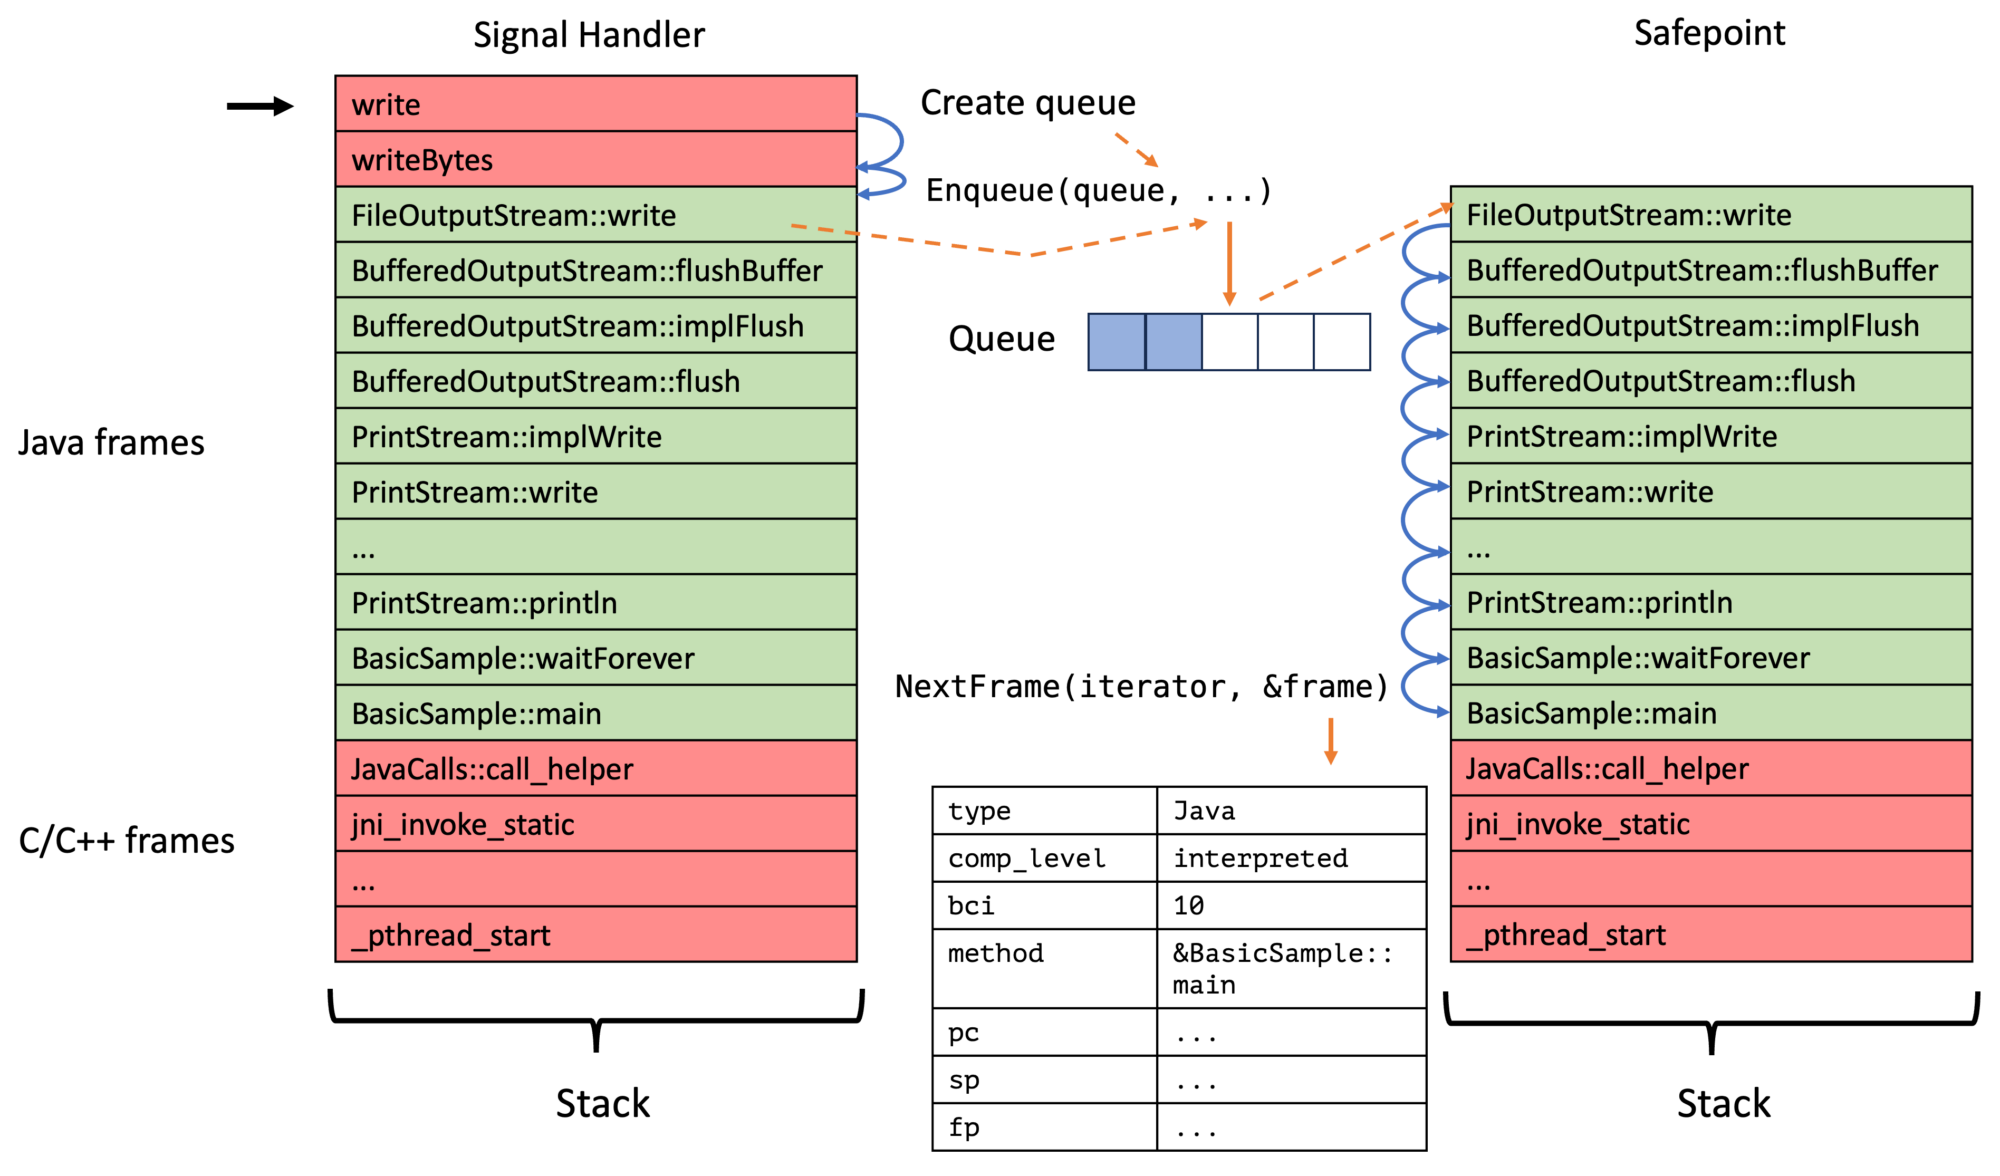
My new approach, on the contrary, walks the Java thread in a signal handler till we find the first bytecode-backed Java frame, stores this in the thread-local queue, triggers a safepoint, and then walks the full Java stack at these safepoints for all enqueued top-frames. We, therefore, have a two-step process:
Instead of just walking the stack in the signal handler:
The new API exploits a few implementation details of the OpenJDK:
There is a safepoint check at least at the end of every non-inlined method (and sometimes there is not, but this is a bug, see The Inner Workings of Safepoints). OpenJ9 doesn’t have checks at returns, so the whole approach I am proposing doesn’t work for them.
When we are at the return of a non-inlined method, we have enough information to obtain all relevant information of the top inlined and the first non-inlined frame using only the program counter, stack pointer, frame pointer, and bytecode pointer obtained in the signal handler. We focus on the first non-inlined method/frame, as inlined methods don’t have physical frames, and walking them would result in walking using Java internal information, which we explicitly want to avoid.
But, in contrast to the other parts of the API, this new safepoint-based part only works when the previously defined conditions hold. This is not the case in OpenJ9, so I propose making the new feature optional. But how do profilers know whether an implementation supports an optional part of the API? By using the ASGST_Capabilities:
// Implementations don't have to implement all methods,
// only the iterator related and those that match
// their capabilities
enum ASGST_Capabilities {
  ASGST_REGISTER_QUEUE = 1, // everything safepoint queue related
  ASGST_MARK_FRAME     = 2  // frame marking related
};
Profilers can query the capability bit map by calling the int ASGST_Capabilities() and should use the signal handler-based approach whenever the capability bit ASGST_REGISTER_QUEUE is absent. ASGST_MARK_FRAME foreshadows a new feature based on stack watermarks, see JEP 376, which I cover in a follow-up blog post. Calling an unsupported API method is undefined.
Now back to the actual API itself. The main two methods of the proposed API are ASGST_RegisterQueue and ASGST_Enqueue. You typically first register a queue for the current thread using ASGST_RegisterQueue, typically in a ThreadStart JVMTI event handler:
typedef void (*ASGST_Handler)(ASGST_Iterator*,
                              void* queue_arg,
                              void* arg);

// Register a queue to the current thread
// (or the one passed via env)
// @param fun handler called at a safe point with iterators,
//   the argument for RegisterQueue and the argument
//   passed via Enqueue
//
// The handler can only call safe point safe methods,
// which excludes all JVMTI methods, but the handler
// is not called inside a signal handler, so allocating
// or obtaining locks is possible
//
// Not signal safe, requires ASGST_REGISTER_QUEUE capability
ASGST_Queue* ASGST_RegisterQueue(JNIEnv* env, int size,
  int options, ASGST_Handler fun, void* argument);
A queue has a fixed size and has a registered handler, which is called for every queue item in insertion order at every safepoint, after which the queue elements are removed. Be aware that you cannot obtain the top frames using the queue handler and cannot call any JVMTI methods, but also that you aren’t bound to signal safe methods in the handler.
The ASGST_Enqueue method obtains and enqueues the top frame into the passed queue, as well as triggering a thread-local handshake/safepoint:
// Enqueue the processing of the current stack
// at the end of the queue and return the kind
// (or error if <= 0)
// you have to deal with the top C and native frames
// yourself (but there is an option for this)
//
// @param argument argument passed through
//   to the ASGST_Handler for the queue as the third argument
// @return kind or error,
//   returns ASGST_ENQUEUE_FULL_QUEUE if queue is full
//   or ASGST_ENQUEUE_NO_QUEUE if queue is null
//
// Signal safe, but has to be called with a queue
// that belongs to the current thread, or the thread
// has to be stopped during the duration of this call
// Requires ASGST_REGISTER_QUEUE capability
int ASGST_Enqueue(ASGST_Queue* queue, void* ucontext,
  void* argument);
The passed argument is passed directly to the last parameter of the queue handler. Be aware of handling the case that the queue is full. Typically one falls back onto walking the stack in the signal handler or compressing the queue. The elements of a queue, including the arguments, can be obtained using the ASGST_GetQueueElement method:
// Returns the nth element in the queue (from the front),
// 0 gives you the first/oldest element.
// -1 gives you the youngest element, ..., -size the oldest.
//
// Modification of the returned element are allowed,
// as long as the queue's size has not been modified
// between the call to ASGST_GetQueueElement and the
// modification (e.g. by calling ASGST_ResizeQueue).
//
// Modifiying anything besides the arg field
// is highly discouraged.
//
// @returns null if n is out of bounds
//
// Signal safe
ASGST_QueueElement* ASGST_GetQueueElement(ASGST_Queue* queue,
  int n);
The critical detail is that modifying the arg field is supported; this allows us to do queue compression: In the signal handler, we obtain the last element in the queue using the ASGST_GetQueueElement method and then get the currently enqueuable element using ASGST_GetEnqueuableElement. We can then check whether both elements are equal and then update the argument, omitting to enqueue the current ucontext.
Another helper method is ASGST_ResizeQueue which can be used to set the queue size:
// Trigger the resizing of the queue at end of the next safepoint
// (or the current if currently processing one)
//
// Signal safe, but has to be called with a queue
// that belongs to the current thread
// Requires ASGST_REGISTER_QUEUE capability
void ASGST_ResizeQueue(ASGST_Queue* queue, int size);
The current queue size and more can be obtained using ASGST_QueueSizeInfo:
typedef struct {
  jint size; // size of the queue
  jint capacity; // capacity of the queue
  jint attempts; // attempts to enqueue since last safepoint end
} ASGST_QueueSizeInfo;

// Returns the number of elements in the queue, its capacity,
// and the number of attempts since finishing the previous
// safepoint
//
// Signal safe, but only proper values in queues thread
ASGST_QueueSizeInfo ASGST_GetQueueSizeInfo(ASGST_Queue* queue);
This returns the defined size/capacity, the current number of elements, and the number of enqueue attempts, including unsuccessful ones. This can be used in combination with ASGST_ResizeQueue to dynamically adjust the size of these queues.
One might want to remove a queue from a thread; this can be done using the non-signal safe method ASGST_DeregisterQueue.
Lastly, one might want to be triggered before and after a non-empty queue is processed:
// Handler that is called at a safe point with enqueued samples
// before and after processing
//
// called with the queue, a frame iterator, and the OnQueue
// argument frame iterator is null if offerIterator at handler
// registration was false
typedef void (*ASGST_OnQueueSafepointHandler)(ASGST_Queue*,
                                              ASGST_Iterator*,
                                              void*);

// Set the handler that is called at a safe point before
// the elements in the (non-empty) queue are processed.
//
// @param before handler or null to remove the handler
//
// Not signal safe, requires ASGST_REGISTER_QUEUE capability
void ASGST_SetOnQueueProcessingStart(ASGST_Queue* queue,
  int options, bool offerIterator,
  ASGST_OnQueueSafepointHandler before, void* arg);

// Set the handler that is called at a safe point after
// the elements in the (non-empty) queue are processed.
//
// @param after handler or null to remove the handler
//
// Not signal safe, requires ASGST_REGISTER_QUEUE capability
void ASGST_SetOnQueueProcessingEnd(ASGST_Queue* queue,
  int options, bool offerIterator,
  ASGST_OnQueueSafepointHandler end, void* arg);
This should enable performance optimizations, enabling the profiler to walk the whole stack, e.g., only once per queue processing safepoint.
This is the whole API that can be found in my OpenJDK fork with the profile2.h header. The current implementation is, of course, a prototype; there are, e.g., known inaccuracies with native (C to Java) frames on which I’m currently working.
The best thing: The code gets more straightforward and uses locks to handle concurrency. Writing code that runs at safepoints is far easier than code in signal handlers; the new API moves complexity from the profiler into the JVM.
But first, you have to build and use my modified OpenJDK as before. This JDK has been tested on x86 and aarch64. The profiler API implementation is still a prototype and contains known errors, but it works well enough to build a small profiler. Feel free to review the code; I’m open to help, suggestions, or sample programs and tests.
To use this new API, you have to include the profile2.h header file, there might be some linker issues on Mac OS, so add -L$JAVA_HOME/lib/server -ljvm to your compiler options.
Now to the significant changes to the version that walks the stack in the signal handler written for the previous blog post. First, we have to register a queue into every thread; we do this in the ThreadStart JVMTI event handler and store the result in a thread-local queue variable:
thread_local ASGST_Queue* queue;
// ...
void JNICALL
OnThreadStart(jvmtiEnv *jvmti_env,
            JNIEnv* jni_env,
            jthread thread) {
  // the queue is large, but aren't doing any  compression,
  // so we need it
  queue = ASGST_RegisterQueue(jni_env, 10'000, 0, &asgstHandler,
    (void*)nullptr);
  // ...
}
We then have to enqueue the last Java frames into the queue in the signal handler:
static void signalHandler(int signo, siginfo_t* siginfo,
 void* ucontext) {
  totalTraces++;
  // queue has not been initialized
  if (queue == nullptr) {
    failedTraces++;
    return;
  }
  int res = ASGST_Enqueue(queue, ucontext, (void*)nullptr);
  if (res != 1) { // not Java trace
    failedTraces++;
    if (res == ASGST_ENQUEUE_FULL_QUEUE) {
      // we could do some compression here
      // but not in this example
      queueFullTraces++;
    }
  }
}
We record the total traces, the failed traces, and the number of times the queue had been full. The enqueued frames are processed using the asgstHandler method at every safepoint. This method obtains the current trace and stores it directly in the flame graph, acquiring the lock to prevent data races:
// we can acquire locks during safepoints
std::mutex nodeLock;
Node node{"main"};

void asgstHandler(ASGST_Iterator* iterator, void* queueArg,
 void* arg) {
  std::vector<std::string> names;
  ASGST_Frame frame;
  int count;
  for (count = 0; ASGST_NextFrame(iterator, &frame) == 1 &&
         count < MAX_DEPTH; count++) {
    names.push_back(methodToString(frame.method));
  }
  // lets use locks to deal with the concurrency
  std::lock_guard<std::mutex> lock{nodeLock};
  node.addTrace(names);
}
That’s all. I might write a blog post on compression in the future, as the queues tend to fill up in wall-clock mode for threads that wait in native.
You can find the complete code on GitHub; feel free to ask any yet unanswered questions. To use the profiler, just run it from the command line as before:
This assumes that you use the modified OpenJDK. MathParser is a demo program that generates and evaluates simple mathematical expressions. The resulting flame graph should look something like this:
Conclusion
The new API can be used to write profilers easier and walk stacks in a safe yet flexible manner. A prototypical implementation of the API showed accuracy comparable to AsyncGetCallTrace when we ignore the native frames. Using the queues offers ample opportunities for profile compression and incremental stack walking, only walking the new stacks for every queue element.
I want to come back to the quote from Erik that I wrote in the beginning, answering his concerns one by one:
Well the current proposal doesn’t have a clear story for 1) Making it safe 2) Working with virtual threads 3) Supporting incremental stack scanning 4) Supporting concurrent stack scanning
Walking at Java frames at safepoints out of signal handlers makes the stack walking safer, and using improved method ids helps with the post-processing.
Walking only at safepoints should make walking virtual threads possible; it is yet to be decided how to expose virtual threads in the API. But the current API is flexible enough to accommodate it.
and 4. Stack watermarks allow profilers to implement incremental and concurrent stack walking, which should improve performance and offer the ability to compress stack traces—more on this in a future blog post.
Thank you for joining me on my API journey; I’m open to any suggestions; please reach me using the typical channels.
Just keep in mind:
This project is part of my work in the SapMachine team at SAP, making profiling easier for everyone.Thanks to Erik Österlund for the basic idea, and to Jaroslav Bachorik for all the feedback and help on the JEP.
jmethodIDs identify methods in many low-level C++ JVM API methods (JVMTI). These ids are used in debugging related methods like SetBreakpoint(jvmtiEnv*,jmethodID,jlocation) and, of course, in the two main profiling APIs in the OpenJDK, GetStackTrace, and AsyncGetCallTrace (ASGCT):
JVMTI has multiple helper methods to get the methods name, signature, declaring class, modifiers, and more for a given jmethodID. Using these IDs is, therefore, an essential part of developing profilers but also a source of sorrow:
Honestly, I don’t see a way to use jmethodID safely.
Jaroslav Bachorik, profiler developer
In this blog post, I will tell you about the problems of jmethodID that keep profiler writers awake at night and how I intend to remedy the situation for profiler writers in JEP 435.
Background
But first: What are jmethodIDs, and how are they implemented?
[A jmethodID] identifies a Java programming language method, initializer, or constructor. jmethodIDs returned by JVMTI functions and events may be safely stored. However, if the class is unloaded, they become invalid and must not be used.
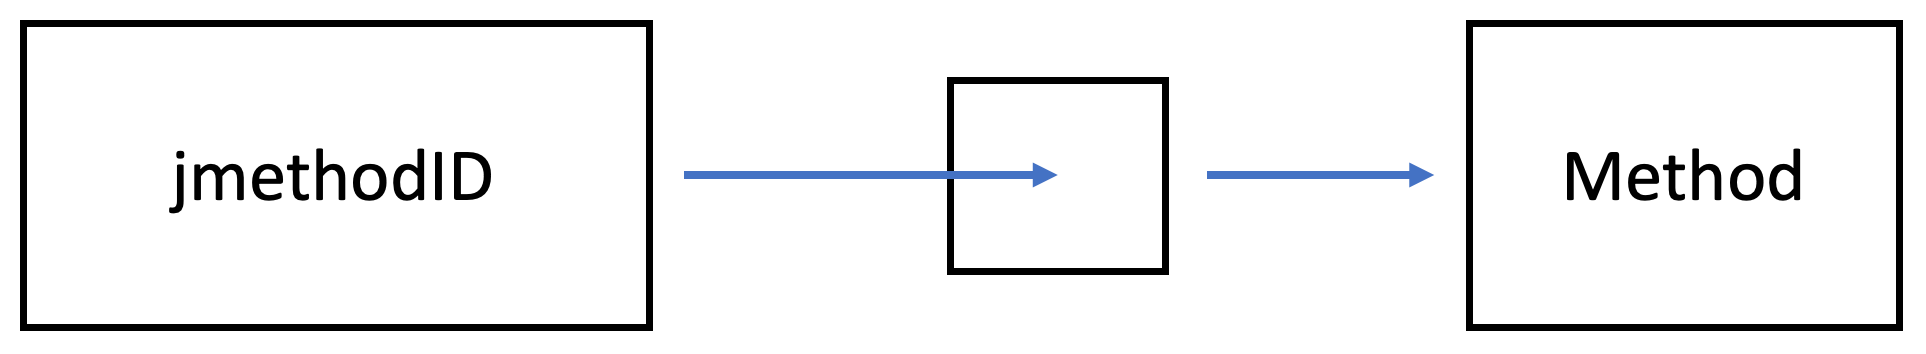
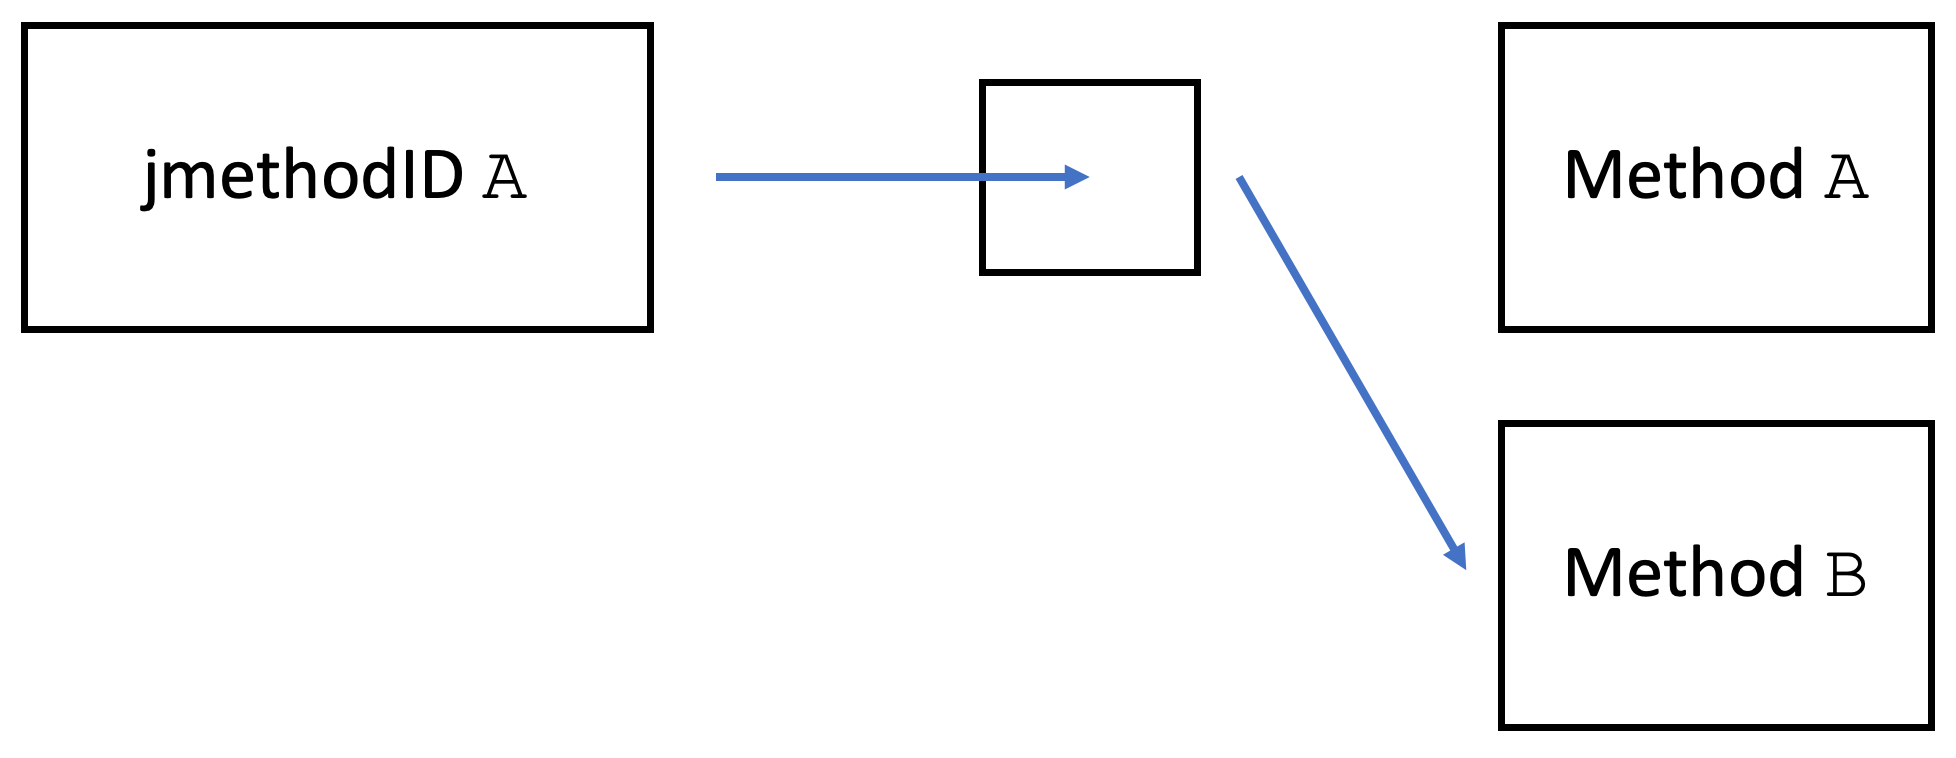
In OpenJDK, they are defined as pointers to an anonymous struct (source). Every Java method is backed by an object of the Method class in the JDK. jmethodIDs are actually just pointing to a pointer that points to the related method object (source):
This is not true for jclass, the jmethodID pendant for classes that points directly to a class object:
The jclass becomes invalid if the class is redefined.
jmethodIDs are allocated on demand because they can stay with the JVM till the defining class is unloaded. The indirections for all ids are stored in the jmethodID cache of the related class (source). This cache has a lock to guard its parallel access from different threads, and the cache is dynamically sized (similar to the ArrayList implementation) to conserve memory.
OpenJ9 also uses an indirection (source), but my understanding of the code base is too limited to make any further claims, so the rest of the blog post is focused on OpenJDK. Now over to the problems for profiler writers:
Problems
The fact that jmethodIDs are dynamically allocated in resizable caches causes major issues: Common profilers, like async-profiler, use AsyncGetCallTrace, as stated in the beginning. ASGCT is used inside signal handlers where obtaining a lock is unsupported. So the profiler has to ensure that every method that might appear in a trace (essentially every method) has an allocated jmethodID before the profiling starts. This leads to significant performance issues when attaching profilers to a running JVM. This is especially problematic in OpenJDK 8:
[…] the quadratic complexity of creating new jmethodIDs during class loading: for every added jmethodID, HotSpot runs a linear scan through the whole list of previously added jmethodIDs trying to find an empty slot, when there are usually none. In extreme cases, it took hours (!) to attach async-profiler to a running JVM that had hundreds thousands classes: https://github.com/async-profiler/async-profiler/issues/221
Andrei Pangin, developer of Async-Profiler
A jmethodID becomes invalid when its defining class is unloaded. Still, there is no way for a profiler to know when a jmethodID becomes invalid or even get notified when a class is unloaded. So processing a newly observed jmethodID and obtaining the name, signature, modifiers, and related class, should be done directly after obtaining the id. But this is impossible as all accessor methods allocate memory and thereby cannot be used in signal handlers directly after AsyncGetCallTrace invocations.
As far as I know, methods can be unloaded concurrently to the native code executing JVMTI functions. This introduces a potential race condition where the JVM unloads the methods during the check->use flow, making it only a partial solution. To complicate matters further, no method exists to confirm whether a jmethodID is valid.
Theoretically, we could monitor the CompiledMethodUnload event to track the validity state, creating a constantly expanding set of unloaded jmethodID values or a bloom filter, if one does not care about few potential false positives. This strategy, however, doesn’t address the potential race condition, and it could even exacerbate it due to possible event delays. This delay might mistakenly validate a jmethodID value that has already been unloaded, but for which the event hasn’t been delivered yet.
Honestly, I don’t see a way to use jmethodID safely unless the code using it suspends the entire JVM and doesn’t resume until it’s finished with that jmethodID. Any other approach might lead to JVM crashes, as we’ve observed with J9.
(Concurrent) class unloading, therefore, makes using all profiling APIs inherently unsafe.
jclass ids suffer from the same problems, but ses, we could just process all jmethodIDs and jclass ids, whenever a class is loaded and store all information on all classes, but this would result in a severe performance penalty, as only a subset of all methods actually appears in the observed traces. This approach feels more like a hack.
While jmethodIDs are pretty helpful for other applications like writing debuggers, they are unsuitable for profilers. As I’m currently in the process of developing a new profiling API, I started looking into replacements for jmethodIDs that solve all the problems mentioned before:
Solution
My solution to all these problems is ASGST_Method and ASGST_Class, replacements for jmethodID and jclass, with signal-safe helper methods and a proper notification mechanism for class, unloads, and redefinitions.
The level of indirection that jmethodID offers is excellent, but directly mapping ASGST_Method to method objects removes the problematic dynamic jmethodID allocations. The main disadvantage is that class redefinitions cause a method to have a new ASGST_Method id and a new ASGST_Class id. We solve this the same way JFR solves it:
We use a class local id (idnum) for every method and a JVM internal class idnum, which are both redefinition invariant. The combination of class and method idnum (cmId) is then a unique id for a method. The problem with this approach is that mapping a cmId to an ASGST_Method or a method object is prohibitively expensive as it requires the JVM to check all methods of all classes. Yet this is not a problem in the narrow space of profiling, as a self-maintained mapping from a cmId to collected method information is enough.
The primary method for getting the method information, like name and signature, is ASGST_GetMethodInfo in my proposal:
// Method info
// You have to preallocate the strings yourself
// and store the lengths in the appropriate fields,
// the lengths are set to the respective
// string lengths by the VM,
// be aware that strings are null-terminated
typedef struct {
  ASGST_Class klass;
  char* method_name;
  jint method_name_length;
  char* signature;
  jint signature_length;
  char* generic_signature;
  jint generic_signature_length;
  jint modifiers;
  jint idnum; // class local id, doesn't change with redefinitions
  jlong class_idnum; // class id that doesn't change
} ASGST_MethodInfo;

// Obtain the method information for a given ASGST_Method and
// store it in the pre-allocated info struct.
// It stores the actual length in the *_len fields and
// a null-terminated string in the string fields.
// A field is set to null if the information is not available.
//
// Signal safe
void ASGST_GetMethodInfo(ASGST_Method method,
                         ASGST_MethodInfo* info);

jint ASGST_GetMethodIdNum(ASGST_Method method);
The similar ASGST_Class related is ASGST_GetClassInfo:
// Class info, like the method info
typedef struct {
  char* class_name;
  jint class_name_length;
  char* generic_class_name;
  jint generic_class_name_length;
  jint modifiers;
  jlong idnum; // id, doesn't change with redefinitions
} ASGST_ClassInfo;

// Similar to GetMethodInfo
//
// Signal safe
void ASGST_GetClassInfo(ASGST_Class klass,
                        ASGST_ClassInfo* info);

jlong ASGST_GetClassIdNum(ASGST_Class klass);
Both methods return a subset of the information available through JVMTI methods. The only information missing that is required for profilers is the mapping from method byte-code index to line number:
typedef struct {
  jint start_bci;
  jint line_number;
} ASGST_MethodLineNumberEntry;

// Populates the method line number table,
// mapping BCI to line number.
// Returns the number of written elements
//
// Signal safe
int ASGST_GetMethodLineNumberTable(ASGST_Method method,
  ASGST_MethodLineNumberEntry* entries, int length);
All the above methods are signal safe so the profiler can process the methods directly. Nonetheless, I propose conversion methods so that the profiler writer can use jmethodIDs and jclass ids whenever needed, albeit with the safety problems mentioned above:
The last part of my proposal deals with invalid class and method ids: I propose a call-back for class unloads, and redefinitions, which is called shortly before the class and the method ids become invalid. In this handler, the profiler can execute its own code, but no JVMTI methods and only the ASGST_* methods that are signal-safe.
Remember that the handler can be executed concurrently, as classes can be unloaded concurrently. Class unload handlers must have the following signature:
These handlers can be registered and deregistered:
// Register a handler to be called when class is unloaded
//
// not signal and safe point safe
void ASGST_RegisterClassUnloadHandler(
  ASGST_ClassUnloadHandler handler, void* arg);

// Deregister a handler to be called when a class is unloaded
// @returns true if handler was present
//
// not signal and safe point safe
bool ASGST_DeregisterClassUnloadHandler(
  ASGST_ClassUnloadHandler handler, void* arg);
The arg parameter is passed directly to the handler as context information. This is due to the non-existence of proper closures or lambdas in C.
You might wonder we my API would allow multiple handlers. This is because a JVM should support multiple profilers at once.
Conclusion
jmethodIDs are unusable for profiling and cause countless errors, as every profiler will tell you. In this blog post, I offered a solution I want to integrate into the new OpenJDK profiling API (JEP 435). My proposal provides the safety that profiler writers crave. If you have any opinions on this proposal, please let me know. You can find a draft implementation can be found on GitHub.
See you next week with a blog post on safe points and profiling.
This project is part of my work in the SapMachine team at SAP, making profiling easier for everyone.Thanks to Martin Dörr, Andrei Pangin, and especially Jaroslav Bachorik for their invaluable input on my proposal and jmethodIDs.
In my last blog post, I hinted Using Async-Profiler and Jattach Programmatically with AP-Loader, that I’m currently working on a test library for writing better profiling API tests. The library is still work-in-progress, but it already allows you to write profiling API tests in plain Java:
private int innerASGCT2() {
    new Tracer().runASGCT().assertTrue(
        Frame.hasMethod(0, "innerASGCT2", "()I"),
        Frame.hasMethod(1, "testRunASGCT2"));
    return 0;
}

@Test
public void testRunASGCT2() {
    innerASGCT2();
}
This test case checks that calling AsyncGetCallTrace gives the correct result in this specific example. The test library allows you to write tests comparing the returns of multiple GetStackTrace, AsyncGetCallTrace, and AsyncGetStackTrace invocations in different modes and settings. The library can be found as trace-tester on GitHub; I aim to bring it into the OpenJDK later with my JEP.
Writing small test cases this way is great, but it would be even better if we could force specific methods to be compiled, interpreted, or inlined so that we can test different scenarios. The proposed AsyncGetStackTrace will return the compilation level directly for every frame, so it is necessary to check the correctness of the level too.
Consider reading my Validating Java Profiling APIs post to get a different angle on profiling API testing.
Introduction
Before I start with discussing the ways you can force methods to be compiled, interpreted, or inlined, I’ll have to clarify that:
The following only works with the HotSpot tired JIT compiler and not other JVM’s like OpenJ9 (see issue #11272)
It should only be used for testing. I would refrain from using it anywhere near production, even if you know that specific methods should be compiled. Use a tool like JITWatch by Chris Newland to check whether the JVM doesn’t make the correct decisions automatically: Ask your fellow JVM expert how to deal with this.
I’m not an expert in the APIs I’m showing you, nor in tiered compilation, so be aware that I might be missing something, but I’m happy for any suggestions and corrections.
There are four different compilation levels, but I’m subsuming all C1 variants under the C1 label because some of my used techniques only work on the C1/C2/inlined level. You can read more on tiered compilation in articles like Tiered Compilation in JVM on Baeldung.
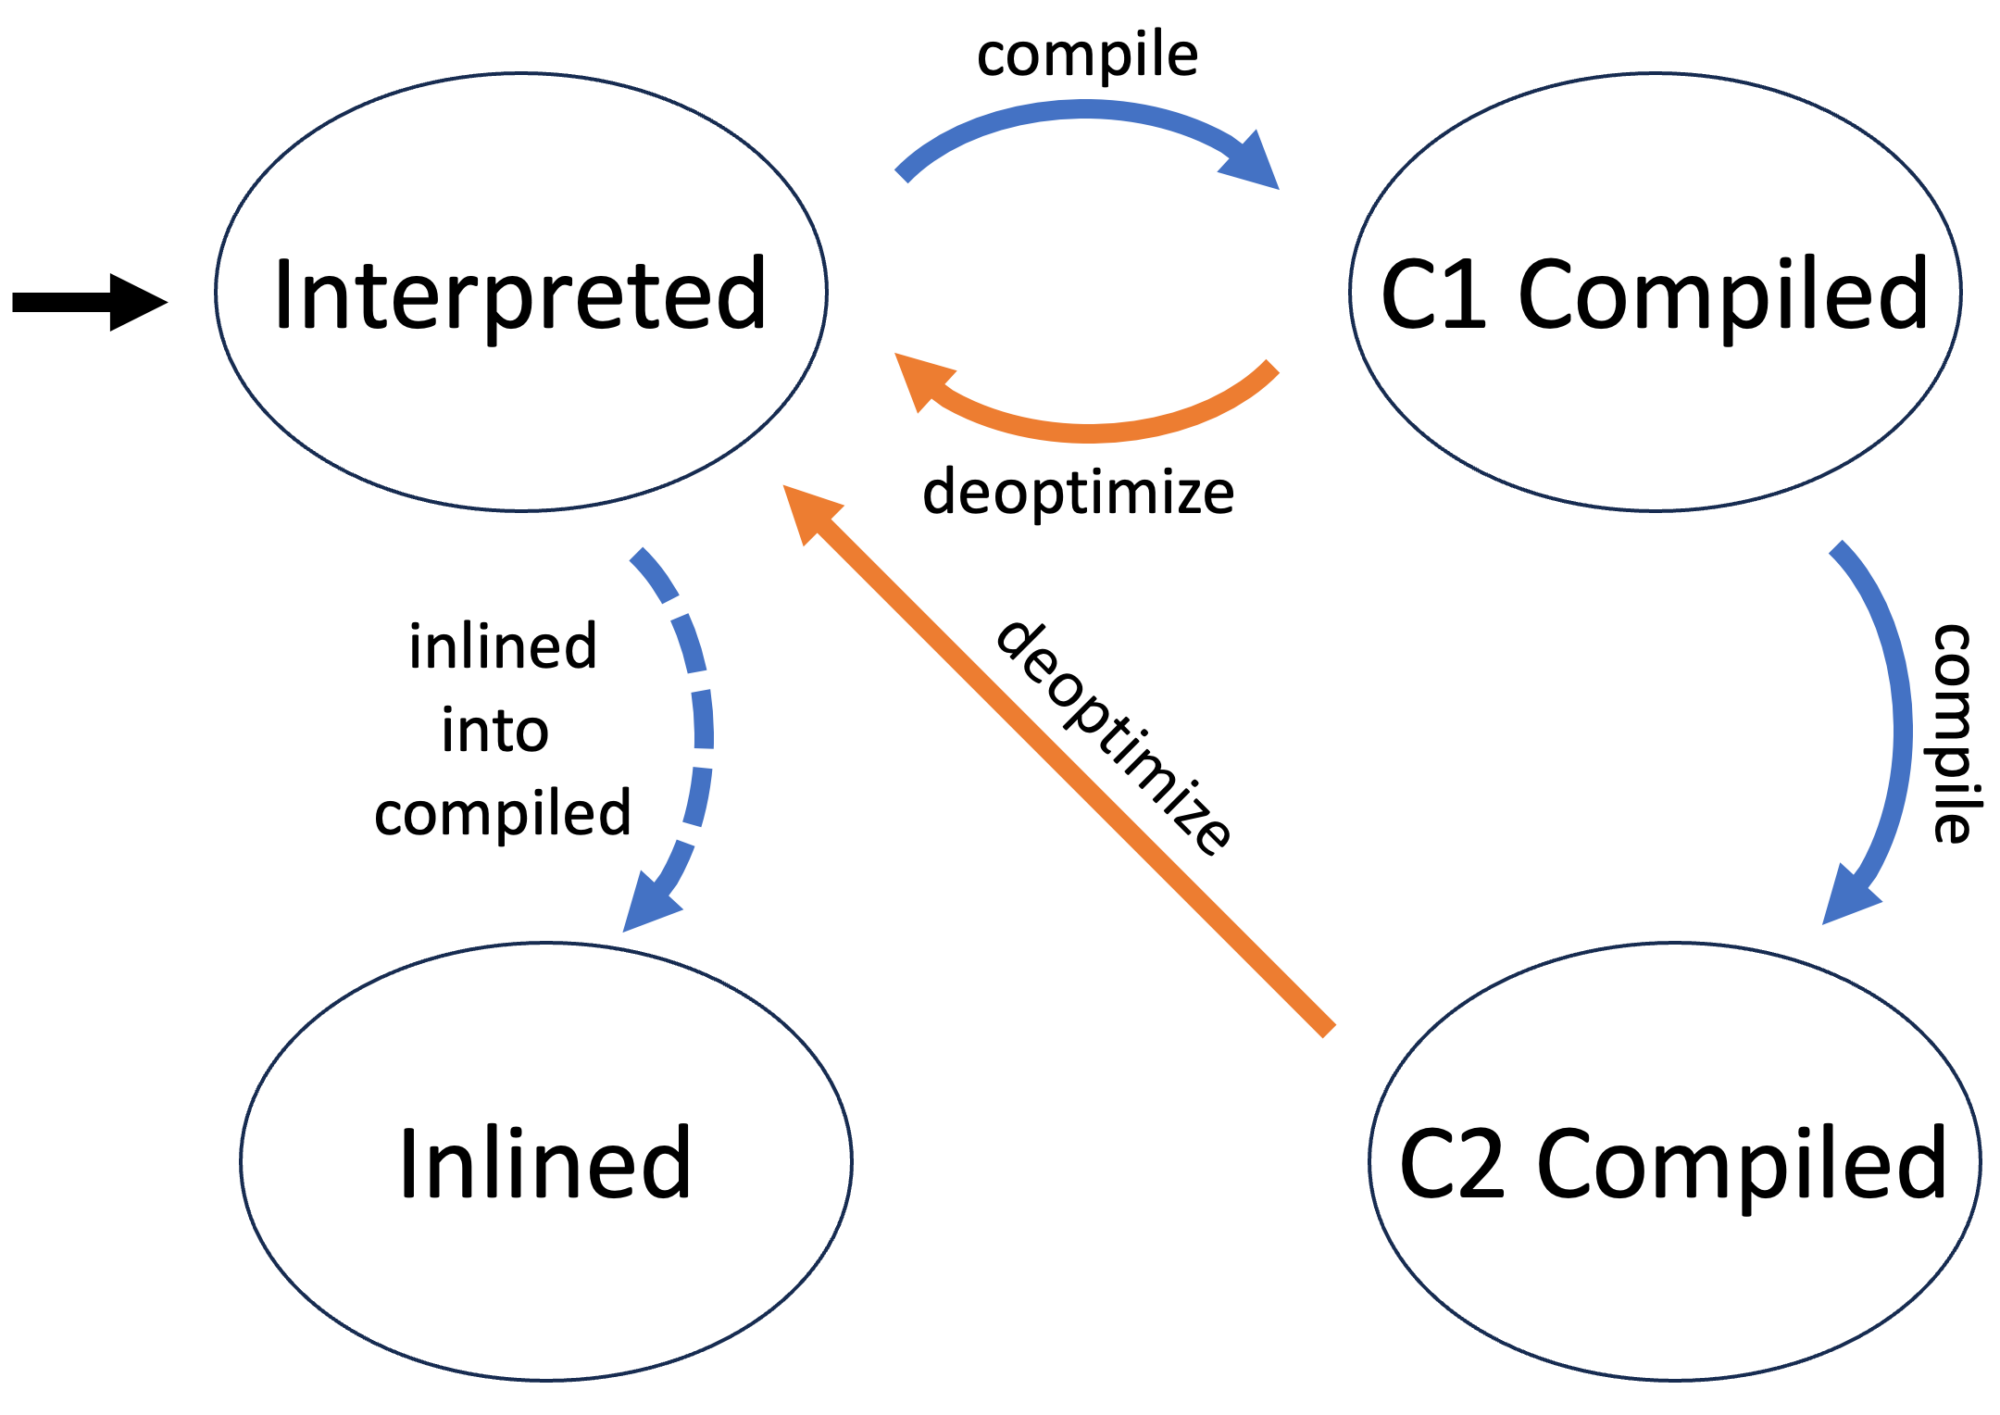
Now that I finished the obligatory disclaimer: What are the stages in the life of a method with a tiered JIT?
The first time the JVM executes a method, the method’s byte code is interpreted without compilation. This allows the JVM to gather information on the method, as C1 and C2 are profile guided.
The method is then compiled when the JVM deems this to be beneficial, usually after the method has been executed a few times. The next call of the method will then use the compiled version. The method is initially compiled with different levels of the C1 compiler before finally being C2 compiled, which takes the longest but produces the best native instructions.
The JVM might decide at any point to use the interpreted version of a method by deoptimizing it. The compiled versions are kept, depending on the compiler and the reasons for the deoptimization.
Every compiler can decide to inline called methods of a currently compiled method. A compiler uses the initial byte code for this purpose.
What we want and what we get
The ideal would be to tell the JVM to just use a method in its compiled version, e.g.:
But this is not possible, as the JVM does not have any information it needs for compilation before the first execution of a method. We, therefore, have first to execute the method (or the benchmark) and then set the compilation level:
How do we get it?
We can split the task of forcing a method to be compiled (or inlined, for that matter) into two parts:
Force all methods into their respective state (→ WhiteBox API) after the initial execution.
Force the JIT to never compile a method with a different compiler (→ Compiler Control)
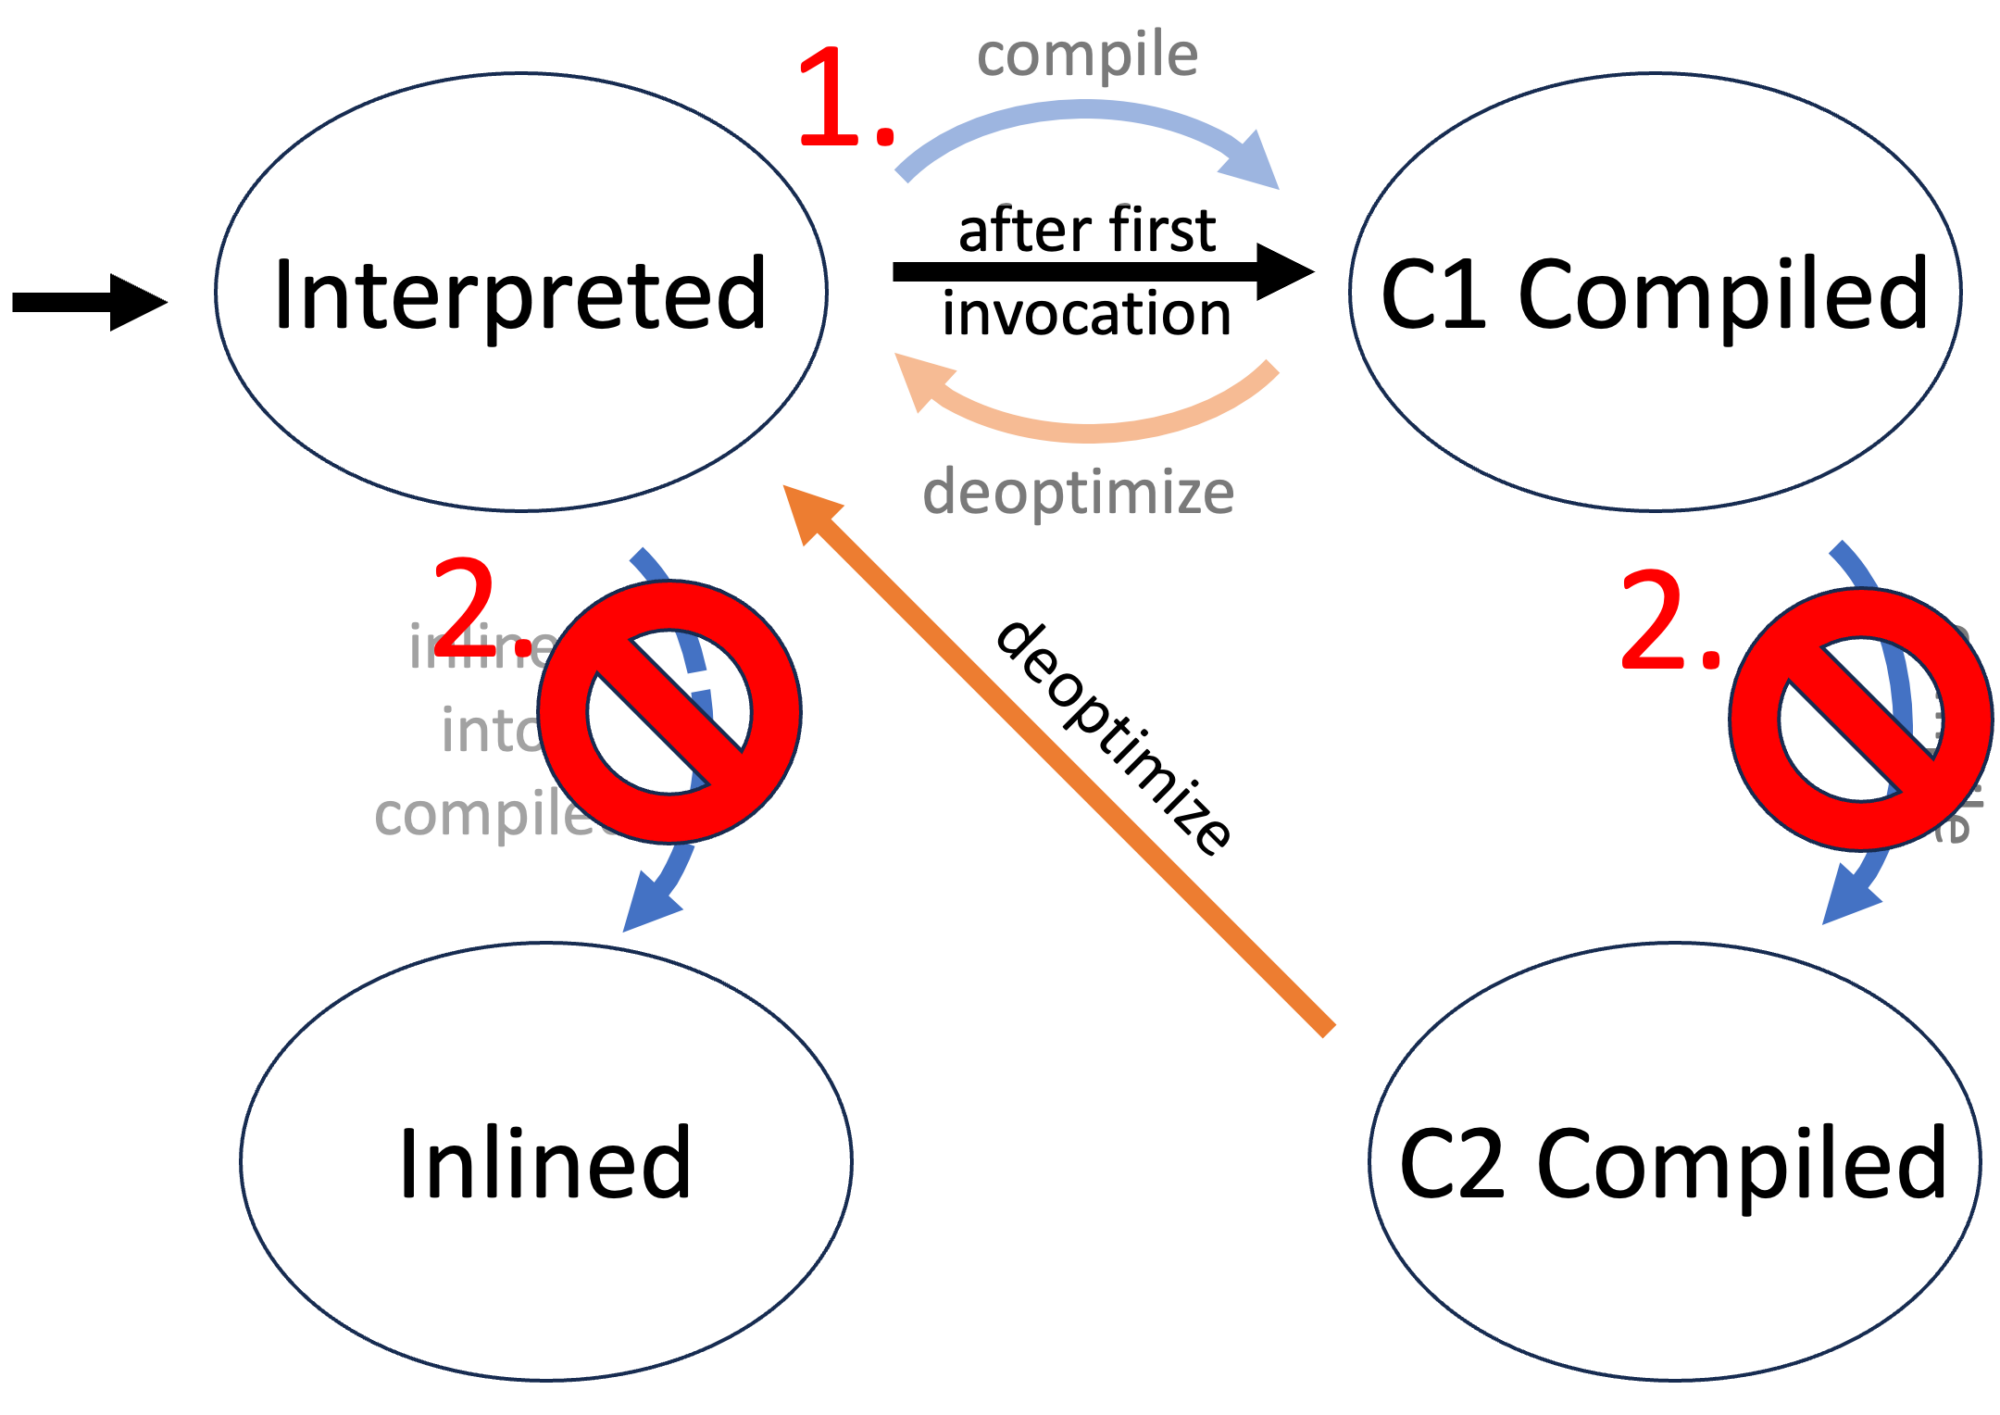
The following is the modified state diagram when forcing a method to be C1 compiled:
In the following, I’ll discuss how to use both the WhiteBox API and Compiler Control to facilitate the wanted behavior.
WhiteBox API
Many JVM tests are written in the JTreg framework, allowing developers to write these tests in Java. But these tests often require specific functionality not regularly available to Java developers. This functionality is exported in the WhiteBox API:
One of the not so well-known tools of the HotSpot VM is its WhiteBox testing API. Introduced in Java 7 it has been significantly improved and extended in Java 8 and 9. It can be used to query or change HotSpot internals which are not otherwise exposed to Java-land. While its features make it an indispensable tool for writing good HotSpot regression tests, it can also be used for experiments or for the mere fun of peeking into the VM. This entry will focus on the usage of the WhiteBox API in Java 8 and 9.
The WhiteBox API is implemented as a Java class (called sun.hotspot.WhiteBox) which defines various entry points into the HotSpot VM. Most of the functionality is implemented natively, directly in the HotSpot VM. The API is implemented as a singleton which can be easily retrieved by calling the static method WhiteBox.getWhiteBox().
Unfortunately, currently even a simple JavaDoc documentation of the API doesn’t exist, so in order to make full use of its functionality, you’ll have to peek right into WhiteBox.java.
This API can be used outside of JTreg tests after enabling it by passing -Xbootclasspath/a:wb.jar -XX:+UnlockDiagnosticVMOptions -XX:+WhiteBoxAPI as JVM arguments. To use it, you have to build the WhiteBox JAR from scratch for your specific JVM by calling make build-test-lib (after you set up the build via the configure script).
But please be aware that using this API outside of JVM tests is relatively rare, and the documentation is still non-existent, so using it entails reading a lot of JDK sources and experimentation.
The build target did not work in JDK 21, and when I fixed it, the first question in the PR was by Daniel Jelinski, who asked:
That’s interesting. How did you find this? Is the result of this target used anywhere? As far as I could tell, the build-test-lib target itself is not used anywhere. The classes that fail to compile here are used by tests without any problems – each test specifies the necessary imports individually. Should we remove this make target instead?
So it would be best if you certainly did not depend on it.
The WhiteBox API consists of the singleton class jdk.test.whitebox.WhiteBox which offers many methods: From GC related methods like boolean isObjectInOldGen(Object o) and void fullGC() to NMT-related methods like long NMTMalloc(long size) and JIT-related methods like void deoptimizeAll().
You can even use it to force the compilation of a method and to set JVM flags, as shown in this example by Jean-Philippe Bempel:
This is from his blog post WhiteBox API, the only blog post I could find on this topic.
Back to our goal of forcing the compilation of a method. It is a good idea to reset the state of a method and deoptimize it to start from a blank slate:
// obtain a method reference
Executable m = X.class.getDeclaredMethod("m", null);
// obtain a WhiteBox instance
WhiteBox wb = WhiteBox.getWhiteBox();
// deooptimize the method
wb.deoptimizeMethod(m);
// clear its state, found by experimentation to be neccessary
wb.clearMethodState(m);
We can then either leave the method uncompiled (for compilation level 0) or enqueue for compilation:
I implemented this in the WhiteBoxUtil class in my trace-tester library. This allows us to force all methods in their respective states. But the JVM can still decide to optimize further or inline a method, even when specifying the contrary. So we have to force the JVM using the second the Compiler Control specifications.
Compiler Control
This control mechanism has been introduced in Java 9 with JEP 165 by Nils Eliasson:
Summary
This JEP proposes an improved way to control the JVM compilers. It enables runtime manageable, method dependent compiler flags. (Immutable for the duration of a compilation.)
Goals
Fine-grained and method-context dependent control of the JVM compilers (C1 and C2)
The ability to change the JVM compiler control options in run time
No performance degradation
Motivation
Method-context dependent control of the compilation process is a powerful tool for writing small contained JVM compiler tests that can be run without restarting the entire JVM. It is also very useful for creating workarounds for bugs in the JVM compilers. A good encapsulation of the compiler options is also good hygiene.
This mechanism is properly standardized for the OpenJDK, unlike the WhiteBox APi. The compiler control allows to specify compilation settings by defining them in a JSON file and applying them:
Using jcmd (see JEP): jcmd <pid> Compiler.add_directives <file>
Passing it via JVM arguments: -XX:+UnlockDiagnosticVMOptions -XX:CompilerDirectivesFile=<file>
Using the WhiteBox API: int addCompilerDirective(String compDirect)
The following directives specify as an example that the method m should not be C2 compiled and not be inlined:
[
  {
    // can also contain patterns
    "match": ["X::m()"],
    // "-" prefixes not inlined, "+" inlined methods
    "inline": ["-X::m()"],
    "C1": {},
    "C2": {
      "Exclude": true
    }
  }
  // multiple directives supported
  // first directives have priority
]
This, in theory, allows the method to be deoptimized, but this did not happen during my testing. With forced compilation, one can assume that this method will almost be used in its compiled form.
I recommend this Compiler Control guide for a more in-depth guide with all options. An implementation of the control file generation with a fluent API can be found in the trace-tester project in the CompilerDirectives class. Feel free to adapt this for your own projects.
Conclusion
I’ve shown you in this article how to control the JIT to specify the inlining and compilation of methods using two lesser-known JVM APIs. This allows us to write reproducible profiling APIs and makes it easier to check how a profiling API reacts to different scenarios.
If you have any suggestions, feel free to reach out. I look forward to preparing slides for my upcoming talks in Milan, Munich, Arnhem, and Karlsruhe. Feel free to come to my talks; more information soon on Twitter.
This project is part of my work in the SapMachine team at SAP, making profiling easier for everyone.
Using async-profiler and jattach can be quite a hassle. First, you have to download the proper archive from GitHub for your OS and architecture; then, you have to unpack it and place it somewhere. It gets worse if you want to embed it into your library, agent, or application: Library developers cannot just use maven dependency but have to create wrapper code and build scripts that deal with packaging the binaries themselves, or worse, they depend on a preinstalled version which they do not control.
In November 2022, I started the ap-loader project to remedy this situation: I wrapped async-profiler and jattach in a platform-independent JAR which can be pulled from maven central. I already wrote a blog post on its essential features: AP-Loader: A new way to use and embed async-profiler.
In this blog post, I’m focusing on its programmatic usage: Async-profiler can be used in a library to gather profiling data of the current or a different process, but the profiler distribution contains more: It contains converters to convert from JFR to flamegraphs, and jattach to attach a native agent dynamically to (potentially the current) JVM and send commands to it.
This blog post does assume that you’re familiar with the basic usage of async-profiler. If you are not, consider reading the async-profiler README or the Async-profiler – manual by use cases by Krzysztof Ślusarski.
The ap-loader library allows you to depend on a specific version of async-profiler using gradle or maven:
There are multiple maven artifacts: ap-loader-all which contains the native libraries for all platforms for which async-profiler has pre-built libraries and artifacts that only support a single platform like ap-loader-macos. I recommend using the ap-loader-all if you don’t know what you’re doing, the current release is still tiny, with 825KB.
The version number consists of the async-profiler version and the version (here 2.9) of the ap-loader support libraries (here 5). I’m typically only publishing the newest ap-loader version for the latest async-profiler. The changes in ap-loader are relatively minimal, and I keep the API stable between versions.
The ap-loader library consists of multiple parts:
AsyncProfilerLoader class: Wraps async-profiler and jattach, adding a few helper methods
converter package: Contains all classes from the async-profiler converter JAR and helps to convert between multiple formats
AsyncProfiler class: API for async-profiler itself, wrapping the native library.
All but the AsyncProfilerLoader class is just copied from the underlying async-profiler release. ap-loader contains all Java classes from async-profiler, but I omit the helper classes here for brevity.
AsyncProfilerLoader
This is the main entry point to ap-loader; it lives in the one.profiler package like the AsyncProfiler class. Probably the most essential method is load:
Load
The load method loads the included async-profiler library for the current platform:
It returns the instantiated API wrapper class. The method throws an IllegalStateException if the present ap-loader dependencies do not support the platform and an IOException if loading the library resulted in other problems.
Newer versions of the AsyncProfiler API contain the AsyncProfiler#getInstance() method, which can also load an included library. The main difference is that you have to include the native library for all the different platforms, replicating all the work of the ap-loader build system every time you update async-profiler.
Dealing with multiple platforms is hard, and throwing an exception when not supporting a platform might be inconvenient for your use case. AsyncProfilerLoader has the loadOrNull method which returns null instead and also the isSupported to check whether the current combination of OS and CPU is supported. A typical use case could be:
if (AsyncProfilerLoader.isSupported()) {
  AsyncProfilerLoader.load().start(...);
} else {
  // use JFR or other fall-backs
}
This might still throw IOExceptions, but they should never happen in normal circumstances and are probably by problems that should be investigated, being either an error in ap-loader or in your application.
If you want to merely get the path to the extracted libAsyncProfiler, then use the getAsyncProfilerPath method which throws the same exceptions as the load method. A similar method exists for jattach (getJattachPath).
Execute Profiler
The async-profiler project contains the profiler.sh script (will be replaced by asprof starting with async-profiler 2.10):
To run the agent and pass commands to it, the helper script profiler.sh is provided. A typical workflow would be to launch your Java application, attach the agent and start profiling, exercise your performance scenario, and then stop profiling. The agent’s output, including the profiling results, will be displayed in the Java application’s standard output.
This helper script is also included in ap-loader and allows you to use the script on the command-line via java -jar ap-loader profiler ..., the API exposes this functionality via ExecutionResult executeProfiler(String... args).
AsyncProfilerLoader.executeProfiler("-e", "wall", "8983")
// is equivalent to
./profiler.sh -e wall -t -i 5ms -f result.html 8983
The executeProfiler method throws an IllegalStateException if the current platform is not supported. The returned instance of ExecutionResult contains the standard and error output:
public static class ExecutionResult {
  private final String stdout;
  private final String stderr;
    // getter and constructor
    ...
}
executeProfiler throws an IOException if the profiler execution failed.
Execute Converter
You cannot only use the converter by using the classes from the one.profiler.converter, but you can also execute the converter by calling ExecutionResult executeProfiler(String... args), e.g., the following:
AsyncProfilerLoader.executeConverter(
  "jfr2flame", "<input.jfr>", "<output.html>")
// is equivalent to
java -cp converter.jar \
  jfr2flame <input.jfr> <output.html>
The executeConverter returns the output of the conversion tool on success and throws an IOException on error, as before.
JAttach
There are multiple ways to use the embedded jattach besides using the binary returned by getJattachPath: ExecutionResult executeJattach(String... args) and boolean jattach(Path agentPath[, String arguments]).
executeJattach works similar to executeProfiler, e.g.:
AsyncProfilerLoader.executeJattach(
  "<pid>", "load", "instrument", "false", "javaagent.jar=arguments")
// is equivalent to
jattach <pid> load instrument false "javaagent.jar=arguments"
This runs the same as jattach with the only exception that every string that ends with libasyncProfiler.so is mapped to the extracted async-profiler library for the load command. One can, therefore, for example, start the async-profiler on a different JVM via the following:
But this use case can, of course, be accomplished by using the executeProfiler method, which internally uses jattach.
A great use case for jattach is to attach a custom native agent to the currently running JVM. Starting with JVM 9 doing this via VirtualMachine#attachthrows an IOException if you try this without setting -Djdk.attach.allowAttachSelf=true. The boolean jattach(Path agentPath[, String arguments]) methods simplify this, constructing the command line arguments for you and returning true if jattach succeeded, e.g.:
AsyncProfilerLoader.jattach("libjni.so")
This attaches the libjni.so agent to the current JVM. The process id of this JVM can be obtained by using the getProcessId method.
Extracting a Native Library
I happen to write many small projects for testing profilers that often require loading a native library from the resources folder; an example can be found in the trace_validation (blog post) project:
/**
 * extract the native library and return its temporary path
 */
public static synchronized Path getNativeLibPath(
 ClassLoader loader) {
  if (nativeLibPath == null) {
    try {
      String filename = System.mapLibraryName(NATIVE_LIB);
      InputStream in = loader.getResourceAsStream(filename);
      // ...
    } catch (IOException e) {
      throw new RuntimeException(e);
    }
  }
  return nativeLibPath;
}
I, therefore, added the extractCustomLibraryFromResources method:
/**
 * Extracts a custom native library from the resources and
 * returns the alternative source if the file is not
 * in the resources.
 *
 * If the file is extracted, then it is copied to
 * a new temporary folder which is deleted upon JVM exit.
 *
 * This method is mainly seen as a helper method
 * to obtain custom native agents for #jattach(Path) and
 * #jattach(Path, String). It is included in ap-loader
 * to make it easier to write applications that need
 * custom native libraries.
 *
 * This method works on all architectures.
 *
 * @param classLoader the class loader to load
 *                 the resources from
 * @param fileName the name of the file to copy,
 *                 maps the library name if the fileName
 *                 does not start with "lib", e.g. "jni"
 *                 will be treated as "libjni.so" on Linux
 *                 and as "libjni.dylib" on macOS
 * @param alternativeSource the optional resource directory
 *                 to use if the resource is not found in
 *                 the resources, this is typically the case
 *                 when running the application from an IDE,
 *                 an example would be "src/main/resources"
 *                 or "target/classes" for maven projects
 * @return the path of the library
 * @throws IOException if the extraction fails and
 *                  the alternative source is not present
 *                  for the current architecture
 */
public static Path extractCustomLibraryFromResources(
  ClassLoader classLoader, String fileName,
  Path alternativeSource) throws IOException
This can be used effectively together with jattach to attach a native agent from the resources to the current JVM:
// extract the agent first from the resources
Path p = one.profiler.AsyncProfilerLoader.
  extractCustomLibraryFromResources(
    ....getClassLoader(), "library name");
// attach the agent to the current JVM
one.profiler.AsyncProfilerLoader.jattach(p, "optional arguments")
// -> returns true if jattach succeeded
This use-case comes from a profiler test helper library on which I hope to write a blog post in the near future.
Conclusion
ap-loader makes it easy to use async-profiler and its included tools programmatically without creating complex build systems. The project is regularly updated to keep pace with the newest stable async-profiler version; updating a version just requires changing a single dependency in your dependencies list.
The ap-loader is mature, so try it and tell me about it. I’m happy to help with any issues you have with this library, so feel free to write to me or create an issue on GitHub.
This project is part of my work in the SapMachine team at SAP, making profiling easier for everyone.
I’m keenly interested in everything related to profiling on the JVM, especially if it is related to AsyncGetCallTrace, this tiny unofficial API that powers most profilers out there, heck I’m even in the process of adding an improved version to the OpenJDK, AsyncGetStackTrace.
During the discussions on the related JDK enhancement proposal and PRs fixing AsyncGetCallTrace bugs, one thing often arises: Why is AsyncGetCallTrace always called in the signal handler on top of the stack that we want to walk (like in my Writing a Profiler from Scratch series)?
Interaction between the wall-clock sampler thread and the different signal handlers, as currently implemented in async-profiler.
Interaction between the sampler thread and the signal handlers, as currently implemented in JFR.
Update after talks on the JEP: The recommended way to use AsyncGetStackTrace will be to call it in a separate thread.
Advantages
Walking the thread in a sampler thread has multiple advantages: Only a few instructions run in the signal handler: the handler is either just busy waiting for the stack walking to finish, or the thread is stopped entirely. Most of the code runs in the sampler thread, walking one thread after another. This makes the code easier to debug and reason about, and the stack-walking code is less likely to mess up the stack of the sampled thread when something goes terribly wrong. These are part of the reasons why the JFR code silently ignores segmentation faults during stack walking:
One important difference to consider is that in JFR, in contrast to AGCT, there is only a single thread, the ThreadSampler thread, that is wrapped in the CrashProtection. Stack walking is different in JFR compared to AGCT, in that it is done by a different thread, during a point where the target is suspended. Originally, this thread sampler thread was not even part of the VM, although now it is a NonJavaThread. It has been trimmed to not involve malloc(), raii, and other hard-to-recover-from constructs, from the moment it has another thread suspended. Over the years, some transitive malloc() calls has snuck in, but it was eventually found due to rare deadlocking. Thomas brings a good point about crashes needing to be recoverable.
I digress here from the main topic of this article, but I think that the next comment of Markus Grönlund on the PR is interesting because it shows how pressures from the outside can lead to band-aid fixes that are never removed:
For additional context, I should add that the CrashProtection mechanism was mainly put in place as a result of having to deliver JFR from JRockit into Hotspot under a deadline, upholding feature-parity. The stack walking code was in really bad shape back then. Over the years, it has been hardened and improved much, and I have not seen any reported issues about JFR crashes in many years (we log when crashing in production).
An important difference is that AGCT allows more thread states compared to JFR, so there can be issues in that area that are not seen in JFR.
Back to the main topic: It is important to note that even when we walk a thread in a separate thread, we still have to make sure that we only use signal-safe methods while the sampled thread is waiting (thanks to Lukas Werling for pointing this out). The sampled thread might, for example, hold locks for malloc, so our sampled thread cannot use malloc without risking a dead-lock.
Disadvantages
There are, of course, disadvantages: Sampling in a signal handler is more straightforward, as we’re running in the context of the sampled thread and get passed the ucontext (with stack pointer, …) directly. It is more accurate, as we can trigger the sampling of the threads precisely at the time that we want (disregarding thread scheduling), and faster, as we do not busy wait in any thread.
We’re running on the same CPU core, which benefits caching, especially on NUMA CPUs (thanks to Francesco Nigro for pointing this out). Although the performance is rarely an issue with the stack-walking as its runtime is in the tens of microseconds, even if we include the whole signal processing.
Another major disadvantage is related to CPU time and perf-event-related profiling: The commonly used itimer (it has major problems, according to Felix Geisendörfer) and perf APIs send signals to threads in certain intervals. When we walk the stack in a separate thread, the triggered signal handlers must trigger the sampler thread to sample the specific thread.
This can be implemented by pushing the current thread id in a queue, and the sampler thread stops the sampled thread when it’s ready and walks the stack as before or by waiting in the signal handler until the sampler thread has finished walking the stack. The former is less performant because it sends an additional signal, and the latter is only significant if the walk requests of all threads are evenly distributed.
This problem can be lessened when we choose a different way of accessing the perf data: We can read the perf events in a loop and then just use the technique from wall-clock profiling. This is a significant modification of the inner workings of the profiler, and it is not possible with itimer-based profiling.
What is the real reason?
Walking in a separate thread has more advantages than disadvantages, especially when wall-clock profiling or valuing stability over slight performance gains. So why don’t tools like async-profiler implement their sampling this way? It’s because AsyncGetCallTrace currently doesn’t support it. This is the starting point of my small experiment: Could I modify the OpenJDK with just a few changes to add support for out-of-thread walking with AsyncGetCallTrace (subsequently proposing this for AsyncGetStackTrace too)?
Modifying AsyncGetCallTrace
Let us first take a look at the API to refresh our knowledge:
void AsyncGetCallTrace(ASGCT_CallTrace *trace, jint depth,
                       void* ucontext)
// Arguments:
//
//   trace    - trace data structure to be filled by the VM.
//   depth    - depth of the call stack trace.
//   ucontext - ucontext_t of the LWP
//
// ASGCT_CallTrace:
//   typedef struct {
//       JNIEnv *env_id;
//       jint num_frames;
//       ASGCT_CallFrame *frames;
//   } ASGCT_CallTrace;
//
// Fields:
//   env_id     - ID of thread which executed this trace.
//   num_frames - number of frames in the trace.
//                (< 0 indicates the frame is not walkable).
//   frames     - the ASGCT_CallFrames that make up this trace.
//                Callee followed by callers.
//
//  ASGCT_CallFrame:
//    typedef struct {
//        jint lineno;
//        jmethodID method_id;
//    } ASGCT_CallFrame;
So we already pass an identifier of the current thread (env_id) to the API, which should point to the walked thread :
// This is safe now as the thread has not terminated
// and so no VM exit check occurs.
assert(thread ==
         JavaThread::thread_from_jni_environment(trace->env_id),
       "AsyncGetCallTrace must be called by " +
       "the current interrupted thread");
This is the only usage of the passed thread identifier, and why I considered removing it in AsyncGetStackTrace altogether. AsyncGetCallTrace uses the current thread instead:
The assertion above is only enabled in debug builds of the OpenJDK, which are rarely profiled. Therefore, the thread identifier is often ignored and is probably a historic relic. We can use this identifier to obtain the thread that the API user wants to profile and only use the current thread when the thread identifier is null (source):
We can thereby support the new feature without modifying the API itself, only changing the behavior if the thread identifier does not reference the current thread.
The implementation can be found in my OpenJDK fork. This is still a prototype, but it works well enough for testing and benchmarking.
Modifying async-profiler
At the beginning of the article, I already told you how JFR walks the stack in a different thread. We are implementing similar code into async-profiler, restricting us to wall-clock profiling, as its implementation requires fewer modifications.
Before our changes, async-profiler would signal selected threads in a loop via
OS::sendSignalToThread(thread_id, SIGVTALRM)
(source) and records the sample directly in the signal handler (source):
The Profiler::recordSample the method does more than just call AsyncGetCallTrace; it also obtains C/C++ frames. However, this is insignificant for our modifications, as the additional stack walking is only related to the ucontext, not the thread.
We now modify this code so that we still send a signal to the sampled thread but only set a global ucontext and thread identifier (struct Data) in the signal handler, blocking till we finished walking the stack in the sampler thread, walking the stack in the latter (source):
struct Data {
    void* ucontext;
    JNIEnv* jni;
};

std::atomic<int> _thread_id;
std::atomic<Data*> _thread_data;

bool WallClock::walkStack(int thread_id) {
    // set the current thread
    _thread_id = thread_id;
    _thread_data = nullptr;

    // send the signal to the sampled thread
    if (!OS::sendSignalToThread(thread_id, SIGVTALRM)) {
        _thread_id = -1;
        return false;
    }
    // wait till the signal handler has set the ucontext and jni
    if (!waitWhile([&](){ return _thread_data == nullptr;},
                   10 * 1000 * 1000)) {
        _thread_id = -1;
        return false;
    }
    Data *data = _thread_data.load();
    // walk the stack
    ExecutionEvent event;
    event._thread_state = _sample_idle_threads ?
      getThreadState(data->ucontext) : THREAD_UNKNOWN;
    u64 ret = Profiler::instance()->recordSample(data->ucontext,
      _interval, EXECUTION_SAMPLE, &event, data->jni);

    // reset the thread_data, triggering the signal handler
    _thread_data = nullptr;
    return ret != 0;
}

void WallClock::signalHandler(
  int signo,
  siginfo_t* siginfo,
  void* ucontext) {
    // check that we are in the thread we are supposed to be
    if (OS::threadId() != _thread_id) {
        return;
    }

    Data data{
       ucontext,
       // Get a JNIEnv if it is deamed to be safe
       VMThread::current() == nullptr ? nullptr : VM::jni()
    };

    Data* expected = nullptr;
    if (!_thread_data.compare_exchange_strong(expected, &data)) {
        // another signal handler invocation
        // is already in progress
        return;
    }
    // wait for the stack to be walked, and block the thread
    // from executing
    // we do not timeout here, as this leads to difficult bugs
    waitWhile([&](){ return _thread_data != nullptr;});
}
The signal handler only stores the ucontext and thread identifier if it is run in the thread currently walked and uses compare_exchange_strong to ensure that the _thread_data is only set once. This prevents stalled signal handlers from concurrently modifying the global variables.
_thread_data.compare_exchange_strong(expected, &data) is equivalent to atomically executing:
This ensures that the _thread_data is only set if it is null. Such operations are the base of many lock-free data structures; you can find more on this topic in the Wikipedia article on Compare-and-Swap (a synonym for compare-and-exchange).
Coming back to the signal handler implementation: The waitWhile method is a helper method that busy waits until the passed predicate does return false or the optional timeout is exhausted, ensuring that the profiler does not hang if something goes wrong.
The implementation uses the _thread_data variable to implement its synchronization protocol:
Interaction between the sampler thread and the signal handler.
You can find the implementation in my async-profiler fork, but as with my OpenJDK fork: It’s only a rough implementation.
The implemented approach works fine with async-profiler, but it has a minor flaw: We depend on an implementation detail of the current iteration of OpenJDK. It is only safe to get the JNIEnv in a signal handler if the JVM has allocated a thread-local Thread object for the signaled thread:
JDK-8132510: it’s not safe to call GetEnv() inside a signal handler since JDK 9, so we do it only for threads already registered in ThreadLocalStorage
For a deeper dive, consider reading the comment of David Holmes to the references JDK issue:
The code underpinning __thread use is not async-signal-safe, which is not really a surprise as pthread_get/setspecific are not designated async-signal-safe either.
The problem, in glibc, is that first access of a TLS variable can trigger allocation [1]. This contrasts with using pthread_getspecific which is benign and so effectively async-signal-safe.
So if a thread is executing in malloc and it takes a signal, and the signal handler tries to use TLS (it shouldn’t but it does and has gotten away with it with pthread_getspecific), then we can crash or get a deadlock.
This implementation detail is not an issue for async-profiler as it might make assumptions. Still, it is undoubtedly a problem for the general approach I want to propose for my new AsyncGetStackTrace API.
Modifying AsyncGetCallTrace (2nd approach)
We want to identify the thread using something different from JNIEnv. The OS thread id seems to be a good fit. It has three significant advantages:
It can be obtained independently from the JVM, depending on the OS rather than the JVM.
Our walkStack method already gets passed the thread id, so we don’t have to pass it from the signal handler to the sampler thread.
The mapping from thread id to Thread happens outside the signal handler in the AsyncGetCallTrace call, and the API sets the env_id field to the appropriate JNIEnv.
We have to add a new parameter os_thread_id to the API to facilitate this change (source):
// ...
//   os_thread_id - OS thread id of the thread which executed
//                  this trace, or -1 if the current thread
//                  should be used.
// ...
// Fields:
//   env_id     - ID of thread which executed this trace,
//                the API sets this field if it is NULL.
// ...
void AsyncGetCallTrace(ASGCT_CallTrace *trace, jint depth,
  void* ucontext, jlong os_thread_id)
The implementation can be found in my OpenJDK fork, but be aware that it is not yet optimized for performance as it iterates over the whole thread list for every call to find the Thread which matches the passed OS thread id.
Modifying async-profiler (2nd approach)
The modification to async-profiler is quite similar to the first approach. The only difference is that we’re not dealing with JNIEnv anymore. This makes the signal handler implementation slightly simpler (source):
void WallClock::signalHandler(
  int signo,
  siginfo_t* siginfo,
  void* ucontext) {
    // check that we are in the thread we are supposed to be
    if (OS::threadId() != _thread_id) {
        return;
    }
    void* expected = nullptr;
    if (!_ucontext.compare_exchange_strong(expected, ucontext)) {
        // another signal handler invocation
        // is already in progress
        return;
    }
    // wait for the stack to be walked, and block the thread
    // from executing
    // we do not timeout here, as this leads to difficult bugs
    waitWhile([&](){ return _ucontext != nullptr;});
}
Now to the fun part (the experiment): Two drawbacks of the two previously discussed approaches are that one thread waits busily, and the other cannot execute all non-signal-safe code during that period. So the obvious next question is:
Could we walk a thread without stopping it?
In other words: Could we omit the busy waiting? An unnamed person suggested this.
The short answer is: It’s a terrible idea. The sampled thread modifies the stack while we’re walking its stack. It might even terminate while we’re in the middle of its previously valid stack. So this is a terrible idea when you don’t take many precautions.
The only advantage is that we can use non-signal-safe methods during stack walking. The performance of the profiling will not be significantly improved, as the signal sending and handling overhead is a magnitude larger than the stack walking itself for small traces. Performance-wise, it could only make sense for huge (1000 and more frames) traces.
Our central assumption is: The profiler takes some time to transition out of the signal handler of the sampled thread. Possibly longer than it takes to walk the topmost frames, which are most likely to change during the execution, in AsyncGetCallTrace.
But: Timing with signals is hard to predict (see this answer on StackExchange), and if the assumption fails, the resulting trace is either bogus or the stack walking leads to “interesting” segmentation faults. I accidentally tested this when I initially implemented the signal handler in my async-profiler and made an error. I saw error messages in places that I had not seen before.
So the results could be imprecise / sometimes incorrect. But we’re already sampling, so approximations are good enough.
The JVM might crash during the stack walking because the ucontext might be invalid and the thread stack changes (so that the stack pointer in the ucontext points to an invalid value and more), but we should be able to reduce the crashes by using enough precautions in AsyncGetCallTrace and testing it properly (I already implemented tests with random ucontexts in the draft for AsyncGetStackTrace).
The other option is to catch any segmentation faults that occur inside AsyncGetCallTrace. We can do this because we walk the stack in a separate thread (and JFR does it as well, as I’ve written at the beginning of this post). We can implement this by leveraging the ThreadCrashProtection clas,s which has, quite rightfully, some disclaimers:
/*
 * Crash protection for the JfrSampler thread. Wrap the callback
 * with a sigsetjmp and in case of a SIGSEGV/SIGBUS we siglongjmp
 * back.
 * To be able to use this - don't take locks, don't rely on
 * destructors, don't make OS library calls, don't allocate
 * memory, don't print, don't call code that could leave
 * the heap / memory in an inconsistent state, or anything
 * else where we are not in control if we suddenly jump out.
 */
class ThreadCrashProtection : public StackObj {
public:
  // ...
  bool call(CrashProtectionCallback& cb);
  // ...
};
We wrap the call to the actual AsyncGetCallTrace implementation of our second approach in this handler (source):
This prevents all crashes related to walking the stack from crashing the JVM, which is also helpful for the AsyncGetCallTrace usage of the previous part of this article. The only difference is that crashes in the stack walking are considered a bug in a normal use case but are expected in this use case where we don’t stop the sampled thread.
Back to this peculiar case: The implementation in async-profiler is slightly more complex than just removing the busy waiting at the end. First, we must copy the ucontext in the signal handler because the ucontext pointer only points to a valid ucontext while the thread is stopped. Furthermore, we have to disable the native stack walking in the async-profiler, as it isn’t wrapped in code that catches crashes. We also have, for unknown reasons, to set the safemode option of async-profiler to 0.
The implementation of the signal handler is simple (just remove the wait from the previous version). It results in the following sequence diagram:
Interaction between the sampler thread and the signal handlers when not blocking the sampled thread during the stack walking.
You can find the implementation on GitHub, albeit with known concurrency problems, but these are out-of-scope for this blog post and related to copying the ucontext atomically.
And now to the important question: How often did AsyncGetCallTrace crash? In the renaissance finagle-http benchmark (with a sampling interval of 10ms), it crashed in 592 of around 808000 calls, a crash rate of 0.07% and far better than expected.
The main problem can be seen when we look at the flame graphs (set the environment variable SKIP_WAIT to enable the modification):
Which looks not too dissimilar to the flame graph with busy waiting:
Many traces (the left part of the graph) are broken and do not appear in the second flame graph. Many of these traces seem to be aborted:
But this was an interesting experiment, and the implementation seems to be possible, albeit creating a safe and accurate profiler would be hard and probably not worthwhile: Catching the segmentation faults seems to be quite expensive: The runtime for the renaissance finagle-http benchmark is 83 seconds for the version with busy waiting and 84 seconds without, despite producing worse results.
Evaluation
We can now compare the performance of the original with the two prototypical implementations and the experimental implementation in a preliminary evaluation. I like using the benchmarks of the renaissance suite (version 0.14.2). For this example, I used the primarily single core, dotty benchmark with an interval of 1ms and 10ms:
The shorter interval will make the performance impact of changes to the profiling more impactful. I’m profiling with my Threadripper 3995WX on Ubuntu using hyperfine (one warm-up run and ten measured runs each). The standard deviation is less than 0.4% in the following diagram, which shows the wall-clock time:
The number of obtained samples is roughly the same overall profiler runs, except for the experimental implementation, which produces around 12% fewer samples. All approaches seem to have a comparable overhead when considering wall-clock time. It’s different considering the user-time:
This shows that there is a significant user-time performance penalty when not using the original approach. This is expected, as we’re engaging two threads into one during the sampling of a specific threadTherefore, the wall-clock timings might.
The wall-clock timings might therefore be affected by my CPU having enough cores so that the sampler and all other threads run fully concurrently.
I tried to evaluate all approaches with a benchmark that utilizes all CPU (finagle-http), but my two new approaches have apparently severe shortcomings, as they produced only around a quarter of the samples compared to the original async-profiler and OpenJDK combination. This is worth fixing, but out-of-scope for this blog post, which already took more than a week to write.
Conclusion
This was the serious part of the experiment: Using AsyncGetCallTrace in a separate thread is possible with minor modifications and offers many advantages (as discussed before). It especially provides a more secure approach to profiling while not affecting performance if you’re system is not yet saturated: A typical trade-off between security and performance. I think that it should be up to the experienced performance engineer two decide and profilers should offer both when my JEP eventually makes the out-of-thread walking available on stock OpenJDKs.
The implementations in both the OpenJDK and async-profiler also show how to quickly implement, test and evaluate different approaches with widely used benchmarks.
Conclusion
The initial question, “Couldn’t we just use AsyncGetCallTrace in a separate thread?” can be answered with a resounding “Yes!”. Sampling in separate threads has advantages, but we have to block the sampled thread during stack walking; omitting this leads to broken traces.
If you have anything to add or found a flaw in my approaches or my implementations, or any other suggestions, please let me know 🙂
I hope this article gave you a glimpse into my current work and the future of low-level Java profiling APis.
This blog post is part of my work in the SapMachine team at SAP, making profiling easier for everyone.
Profilers are great tools in your toolbox, like debuggers, when solving problems with your Java application (I’ve been on a podcast on this topic recently). I’ll tell you some of their problems and a technique to cope with them in this blog post.
There are many open-source profilers, most notably JFR/JMC, and async-profiler, that help you to find and fix performance problems. But they are just software themself, interwoven with a reasonably large project, the OpenJDK (or OpenJ9, for that matter), and thus suffer from the same problems as the typical problems of application they are used to profile:
Tests could be better
Performance and accuracy could be better
Tests could be more plentiful, especially for the underlying API, which could be tested well
Changes in seemingly unrelated parts of the enclosing project can adversely affect them
Therefore you take the profiles generated by profilers with a grain of salt. There are several blog posts and talks covering the accuracy problems of profilers:
I would highly recommend you to read my Writing a profiler from scratch series If you want to know more about how the foundational AsyncGetCallTrace is used in profilers. Just to list a few.
A sample AsyncGetCallTraceTrace bug
A problem that has been less discussed is the lacking test coverage of the underlying APIs. The AsyncGetCallTrace API, used by async-profiler and others, has just one test case in the OpenJDK (as I discussed before). This test case can be boiled down to the following:
import java.lang.reflect.InvocationTargetException;
import java.lang.reflect.Method;

public class Main {

    static { /** load native library */ }

    public static void main(String[] args) throws Exception {
        Class<?> klass = Main.class;
        Method mainMethod = klass.getMethod("test");
        mainMethod.invoke(null);
    }

    public static void test() {
        if (!checkAsyncGetCallTraceCall()) {
            throw ...;
        }
    }

    public static native boolean checkAsyncGetCallTraceCall();
}
This is the simplest test case that can be written in the OpenJDK JTREG test framework for OpenJDK. The problem with this test case? The implementation of checkAsyncGetCallTraceCall only checks for the topmost frame. To test AsyncGetCallTrace correctly here, one should compare the trace returned by this call with the trace of an oracle. We can use GetStackTrace (the safepoint-biased predecessor of ASGCT) here as it seems to return the correct trace.
GetStackTrace returns something like the following:
This problem can be observed with a modified test case with JFR and async-profiler too:
public class Main {

    public static void main(String[] args) throws Exception {
        Class<?> klass = Main.class;
        Method mainMethod = klass.getMethod("test");
        mainMethod.invoke(null);
    }

    public static void test() {
        javaLoop();
    }

    public static void javaLoop() {
        long start = System.currentTimeMillis();
        while (start + 3000 > System.currentTimeMillis());
    }
}
The expected flame graph is on the left (obtained after fixing the bug), and the actual flame graph is on the right.
So the only test case on AsyncGetCallTrace in the OpenJDK did not properly test the whole trace. This was not a problem when the test case was written. One can expect that its author checked the entire stack trace manually once and then created a small check test case to test the first frame, which is not implementation specific. But this is a problem for regression testing:
The Implementation of JEP 416: Reimplement Core Reflection with Method Handle in JDK 18+23 in mid-2021 modified the inner workings of reflection and triggered this bug. The lack of proper regression tests meant the bug had only been discovered a week ago. The actual cause of the bug is more complicated and related to a broken invariant regarding stack pointers in the stack walking. You can read more on this in the comments by Jorn Vernee and Richard Reingruber to my PR.
My PR improves the test by checking the result of AsyncGetCallTrace against GetStackTrace, as explained before, and fixing the bug by slightly loosening the invariant.
My main problem with finding this bug is that it shows how the lack of test coverage for the underlying profiling APIs might cause problems even for profiling simple Java code. I only found the bug because I’m writing many tests for my new AsyncGetStackTrace API. It’s hard work, but I’m convinced this is the only way to create a reliable foundation for profilers.
Profilers in a loop
Profilers have many problems but are still helpful if you know what they can and cannot do. They should be used with care, without trusting everything they tell you. Profilers are only as good as the person interpreting the profiler results and the person’s technique.
I have a background in computer science, and every semester I give students in a paper writing lab an hour-long lecture on doing experiments. I started this a few years back and continue to do it pro-bono because it is an important skill to teach. One of the most important things that I teach the students is that doing experiments is essentially a loop:
You start with an abstract model of the experiment and its environment (like the tool or algorithm you’re testing). Then you formulate a hypothesis in this model (e.g., “Algorithm X is faster as Y because of Z”). You might find problems in your model during this step and go back to the modeling step, or you don’t and start evaluating, checking whether the hypothesis holds. During this evaluation, you might find problems with your hypothesis (e.g., it isn’t valid) or even your model and go back to the respective step. Besides problems, you usually find new information that lets you refine your model and hypothesis. Evaluating without a mental model or a hypothesis makes it impossible to interpret the evaluation results correctly. But remember that a mismatch between hypothesis and evaluation might also be due to a broken evaluation.
The same loop can be applied to profiling: Before investigating any issue with a program, you should acquire at least a rough mental model of the code. This means understanding the basic architecture, performance-critical components, and the issues of the underlying libraries. Then you formulate a hypothesis based on the problem you’re investigating embedded in your mental model (e.g., “Task X is slow because Y is probably slow …”). You can then evaluate the hypothesis using actual tests and a profiler. But as before, remember that your evaluation might also contain bugs. You can only discover these with a mental model and a reasonably refined hypothesis.
This technique lets you use profilers without fearing that spurious errors will lead you to wrong conclusions.
I hope you found this article helpful and educational. It is an ongoing effort to add proper tests and educate users of profilers. See you in the next post when I cover the next step in writing a profiler from scratch.
This blog post is part of my work in the SapMachine team at SAP, making profiling easier for everyone.