Last week, I demonstrated that OpenJDK is faster than GraalVM Java, at least for obtaining the Java version. This even prompted the mighty Thomas Wuerthinger (creator of GraalVM) to react. But the measured ~20ms for the OpenJDK is still too slow for applications like execjar, where it could significantly increase the runtime of short-running CLI tools. In this week’s brief blog post, I’ll show you the fastest way to access the Java version.
The main performance issue is that calling java -version creates a process with a fairly large (around 38MB) maximum resident set size, and using a proper command line parser. But do we actually need to call the java binary to get the version?
TL;DR: I created the java-version tool, which can obtain the Java version in under a millisecond.
Basic Idea
No, we can just realize that most Java installations have a release file that contains the relevant information in a machine-readable format. You can find this file in the main folder of the installation (./release when java is in ./bin).
Welcome to the last blog post of the year. Last week, I discussed the limitations of custom JFR events. This week, I’ll also be covering a profiling-related topic and showcasing a tiny tool called JStall.
I hope I’m not the only one who sometimes wonders: “What is my Java application doing right now?” When you don’t see any output. Yes, you could perform a simple thread dump via jstack, but it is hard to understand which threads are actually consuming CPU and making any sort of progress. This is where my tiny tool called JStall comes in:
JStall is a small command-line tool for one-shot inspection of running JVMs using thread dumps and short, on-demand profiling. The tool essentially takes multiple thread dumps of your application and uses the per-thread cpu-time information to find the most CPU-time-consuming Java threads.
First, download the JStall executable from the GitHub releases page. Let us then start by finding the currently running JVMs:
> ./jstall
Usage: jstall <command> <pid|files> [options]

Available commands:
  status     - Show overall status (deadlocks + most active threads)
  deadlock   - Check for deadlocks
  most-work  - Show threads doing the most work
  flame      - Generate flame graph
  threads    - List all threads

Available JVMs:
  7153 ./jstall
  1223 <unknown>
  8136 ./renaissance-gpl-0.16.0.jar
  6138 org.jetbrains.idea.maven.server.RemoteMavenServer36
  5597 DeadlockDemo
  49294 com.intellij.idea.Main
This provides us with a list of options for the main status command, as well as a list of JVM processes and their corresponding main classes. Let’s start checking for deadlocking:
JDK Flight Recorder (JFR) provides support for custom events as a profiler. Around two years ago, I wrote a blog post on this very topic: Custom JFR Events: A Short Introduction. These custom events are beneficial because they enable us to record additional project-specific information alongside the standard JFR events, all in the same file. We can then view and process this information with the JFR tools. You can freely specify these events in Java.
There is only one tiny problem nobody talks about: Array support (and, in more general, the support of complex types).
Over a year ago, I wrote a blog post called Who instruments the instrumenters? together with Mikaël Francoeur on how we debugged the Java instrumentation code. In the meantime, I gave a more detailed talk on this topic at VoxxedDays Amsterdam. The meta-agent that I developed for this worked well for Java agents/instrumenters, but what about native agents? Marco Sussitz found my agent and asked exactly this question. Native agents are agents that utilize the JVMTI API to, for example, modify class bytecode; however, they are not written in Java. With this blog post, I’m proud to announce that the meta-agent now supports instrumenting native agents.
TL;DR: Meta-agent allows you to see how an agent, native or Java, transforms bytecode.
There are many examples of native agents, like DynaTrace‘s monitoring agent or async-profiler‘s method tracer. I’m using the latter in my example here, as it’s open-source and readily available. The method tracer instruments the Java bytecode to trace the execution time of specific methods. You can find more about it in the async-profiler forum.
As a sample program, we use Loop.java:
public class Loop {
    public static void main(String[] args)
      throws InterruptedException {
        while (true) Thread.sleep(1000);
    }
}
Let’s trace the Thrread.sleep method and use the meta-agent to see what async-profiler does with the bytecode:
This opens a server at localhost:7071 and we check how async-profiler modified the Thread class:
So we can now instrument native agents like any other Java agent. And the part: As all Java agents are built on top of the libinstrument native agent, we can also see what any Java agent is doing. For example, we can see that the Java instrumentation agent instruments itself:
So I finally built an instrumenter that can essentially instrument my instrumentation agent, which in turn instruments other instrumentation agents. Another benefit is that the instrumenter can find every modification of any Java agent.
In my previous post, I showed you how tricky it is to compare objects from the JFR Java API. You probably wondered why I wrote about this topic. Here is the reason: In this blog post, I’ll cover how to load JFR files into a DuckDB database to allow querying profiling data with simple SQL queries, all JFR views included.
This blog post will start a small series on making JFR quack.
TL;DR
You can now use a query tool (via GitHub) to transform JFR files into similarly sized DuckDB files:
CREATE VIEW "hot-methods" AS
SELECT
  (c.javaName || '.' || m.name || m.descriptor) AS "Method",
  COUNT(*) AS "Samples",
  format_percentage(COUNT(*) / (SELECT COUNT(*) FROM ExecutionSample)) AS "Percent"
FROM ExecutionSample es
JOIN Method m ON es.stackTrace$topMethod = m._id
JOIN Class c ON m.type = c._id
GROUP BY es.stackTrace$topApplicationMethod, c.javaName, m.name, m.descriptor
ORDER BY COUNT(*) DESC
LIMIT 25
In the last blog post, I showed you how to silence JFR’s startup messages. This week’s blog post is also related to JFR, and no, it’s not about the JFR Events website, which got a simple search bar. It’s a short blog post on comparing objects from JFR recordings in Java and why this is slightly trickier than you might have expected.
Example
Getting a JFR recording is simple; just use the RecordingStream API. We do this in the following to record an execution trace of a tight loop using JFR and store it in a list:
List<RecordedEvent> events = new ArrayList<>();
// Know when to stop the loop
AtomicBoolean running = new AtomicBoolean(true);
// We obtain one hundred execution samples
// that have all the same stack trace
final long currentThreadId = Thread.currentThread().threadId();
try (RecordingStream rs = new RecordingStream()) {
    rs.enable("jdk.ExecutionSample").with("period", "1ms");
    rs.onEvent("jdk.ExecutionSample", event -> {
        if (event.getThread("sampledThread")
                 .getJavaThreadId() != currentThreadId) {
            return; // don't record other threads
        }
        events.add(event);
        if (events.size() >= 100) {
            // we can signal to stop
            running.set(false);
        }
    });
    rs.startAsync();
    int i = 0;
    while (running.get()) { // some busy loop to produce sample
        for (int j = 0; j < 100000; j++) {
            i += j;
        }
    }
    rs.stop();
}
[0.172s][info][jfr,startup] Started recording 1. No limit specified, using maxsize=250MB as default.
[0.172s][info][jfr,startup]
[0.172s][info][jfr,startup] Use jcmd 29448 JFR.dump name=1 to copy recording data to file.
when starting the Flight Recorder with -XX:StartFlightRecorder? Even though the default logging level is warning, not info?
This is what this week’s blog post is all about. After I showed you last week how to waste CPU like a Professional, this week I’ll show you how to silence JFR. Back to the problem:
As a short backstory, my profiler needed a test to check that the queue size of the sampler really increased dynamically (see Java 25’s new CPU-Time Profiler: Queue Sizing (3)), so I needed a way to let a thread spend a pre-defined number of seconds running natively on the CPU. You can find the test case in its hopefully final form here, but be aware that writing such cases is more complicated than it looks.
So here we are: In need to essentially properly waste CPU-time, preferably in user-land, for a fixed amount of time. The problem: There are only a few scant resources online, so I decided to create my own. I’ll show you seven different ways to implement a simple
void my_wait(int seconds);
method, and you’ll learn far more about this topic than you ever wanted to. That works both on Mac OS and Linux. All the code is MIT licensed; you can find it on GitHub in my waste-cpu-experiments, alongside some profiling results.
I developed, together with others, the new CPU-time profiler for Java, which is now included in JDK 25. A few weeks ago, I covered the profiler’s user-facing aspects, including the event types, configuration, and rationale, alongside the foundations of safepoint-based stack walking in JFR (see Taming the Bias: Unbiased Safepoint-Based Stack Walking). If you haven’t read those yet, I recommend starting there. In this week’s blog post, I’ll dive into the implementation of the new CPU-time profiler.
It was a remarkable coincidence that safepoint-based stack walking made it into JDK 25. Thanks to that, I could build on top of it without needing to re-implement:
The actual stack walking given a sampling request
Integration with the safepoint handler
Of course, I worked on this before, as described in Taming the Bias: Unbiased Safepoint-Based Stack Walking. But Erik’s solution for JDK 25 was much more complete and profited from his decades of experience with JFR. In March 2025, whether the new stack walker would get into JDK 25 was still unclear. So I came up with other ideas (which I’m glad I didn’t need). You can find that early brain-dump in Profiling idea (unsorted from March 2025).
In this post, I’ll focus on the core components of the new profiler, excluding the stack walking and safepoint handler. Hopefully, this won’t be the last article in the series; I’m already researching the next one.
Main Components
There are a few main components of the implementation that come together to form the profiler:
This is my actual collection of ideas from March 2025, when it was unclear whether the updated JFR sampling at safepoints made it into JDK 25. It eventually did, so I scrapped the ideas. But it offers the reader an interesting, unfiltered look into my ideas and thoughts at the time, probably only useful for people who are really into profiling and the OpenJDK. Just be aware that it is therefore a document of its time (March 2025) and doesn’t reflect the actual current implementation. Also, don’t expect any deeper explanations.
Ever wondered how the views of the jfr tool are implemented? There are views like hot-methods which gives the most used methods, or cpu-load-samples that gives you the system load over time that you can directly use on the command line:
> jfr view cpu-load-samples recording.jfr

                                     CPU Load

Time                         JVM User           JVM System           Machine Total
------------------ ------------------ -------------------- -----------------------
14:33:29                        8,25%                0,08%                  29,65%
14:33:30                        8,25%                0,00%                  29,69%
14:33:31                        8,33%                0,08%                  25,42%
14:33:32                        8,25%                0,08%                  27,71%
14:33:33                        8,25%                0,08%                  24,64%
14:33:34                        8,33%                0,00%                  30,67%
...
This is helpful when glancing at JFR files and trying to roughly understand their contents, without loading the files directly into more powerful, but also more resource-hungry, JFR viewers.
In this short blog post, I’ll show you how the views work under the hood using JFR queries and how to use the queries with my new experimental JFR query tool.
I didn’t forget the promised blog post on implementing the new CPU-time profiler in JDK 25; it’ll come soon.
Under the hood, JFR views use a built-in query language to define all views in the view.ini file. The above is, for example, defined as:
More than three years in the making, with a concerted effort starting last year, my CPU-time profiler landed in Java with OpenJDK 25. It’s an experimental new profiler/method sampler that helps you find performance issues in your code, having distinct advantages over the current sampler. This is what this week’s and next week’s blog posts are all about. This week, I will cover why we need a new profiler and what information it provides; next week, I’ll cover the technical internals that go beyond what’s written in the JEP. I will quote the JEP 509 quite a lot, thanks to Ron Pressler; it reads like a well-written blog post in and of itself.
Before I show you its details, I want to focus on what the current default method profiler in JFR does:
Two years ago, I still planned to implement a new version of AsyncGetCallTrace in Java. This plan didn’t materialize, but Erik Österlund had the idea to fully walk the stack at safepoints during the discussions. Walking stacks only at safepoints normally would incur a safepoint-bias (see The Inner Workings of Safepoints), but when you record some program state in signal handlers, you can prevent this. I wrote about this idea and its basic implementation in Taming the Bias: Unbiased Safepoint-Based Stack Walking. I’ll revisit this topic in this week’s short blog post because Markus Grönlund took Erik’s idea and started implementing it for the standard JFR method sampler:
Around ten months ago I wrote a blog post together with Mikaël Francoeur on how to instrument instrumenters:
Have you ever wondered how libraries like Spring and Mockito modify your code at run-time to implement all their advanced features? Wouldn’t it be cool to get a peek behind the curtains? This is the premise of my meta-agent, a Java agent to instrument instrumenters, to get these insights and what this blog post is about.
This launched a website under localhost:7071 where you could view the actions of every instrument and transformer. The only problem? It’s cumbersome to use, especially programmatically. Join me in this short blog post to learn about the newest edition of meta-agent and what it can offer.
Instrumentation Handler
An idea that came up at the recent ConFoo conference in discussion with Mikaël and Jonatan Ivanov was to add a new handler mechanism to call code every time a new transformer is added or a class is instrumented. So I got to work.
If you’re here for eBPF content, this blog post is not for you. I recommend reading an article on a concurrency fuzzing scheduler at LWN.
Ever wonder how the JDK Flight Recorder (JFR) keeps track of the classes and methods it has collected for stack traces and more? In this short blog post, I’ll explore JFR tagging and how it works in the OpenJDK.
Tags
JFR files consist of self-contained chunks. Every chunk contains:
The maximum chunk size is usually 12MB, but you can configure it:
java -XX:FlightRecorderOptions:maxchunksize=1M
Whenever JFR collects methods or classes, it has to somehow tell the JFR writer which entities have been used so that their mapping can be written out. Each entity also has to have a tracing ID that can be used in the events that reference it.
This is where JFR tags come in. Every class, module, and package entity has a 64-bit value called _trace_id (e.g., classes). Which consists of both the ID and the tag. Every method has an _orig_method_idnum, essentially its ID and a trace flag, which is essentially the tag.
In a world without any concurrency, the tag could just be a single bit, telling us whether an entity is used. But in reality, an entity can be used in the new chunk while we’re writing out the old chunk. So, we need to have two distinctive periods (0 and 1) and toggle between them whenever we write a chunk.
Tagging
We can visualize the whole life cycle of a tag for a given entity:
In this example, the entity, a class, is brought into JFR by the method sampler (link) while walking another thread’s stack. This causes the class to be tagged and enqueued in the internal entity queue (and is therefore known to the JFR writer) if it hasn’t been tagged before (source):
This shows that tagging also prevents entities from being duplicated in a chunk.
Then, when a chunk is written out. First, a safepoint is requested to initialize the next period (the next chunk) and the period to be toggled so that the subsequent use of an entity now belongs to the new period and chunk. Then, the entity is written out, and its tag for the previous period is reset (code). This allows the aforementioned concurrency.
But how does it ensure that the tagged classes aren’t unloaded before they are emitted? By writing out the classes when any class is unloaded. This is simple yet effective and doesn’t need any change in the GC.
Conclusion
Tagging is used in JFR to record classes properly, methods, and other entities while also preventing them from accidentally being garbage collected before they are written out. This is a simple but memory-effective solution. It works well in the context of concurrency but assumes entities are used in the event creation directly when tagging them. It is not supported to tag the entities and then push them into the queue to later create events asynchronously. This would probably require something akin to reference counting.
Thanks for coming this far in a blog post on a profiling-related topic. I chose this topic because I wanted to know more about tagging and plan to do more of these short OpenJDK-specific posts.
Almost to the day, a year ago, I published my blog post called Level-up your Java Debugging Skills with on-demand Debugging. In this blog post, I wrote about multiple rarely known and rarely used features of the Java debugging agent, including the onjcmd feature. To quote my own blog post:
JCmd triggered debugging
There are often cases where the code that you want to debug is executed later in your program’s run or after a specific issue appears. So don’t waste time running the debugging session from the start of your program, but use the onjcmd=y option to tell the JDWP agent to wait with the debugging session till it is triggered via jcmd.
The alternative to using this feature is to start the debugging session at the beginning and only connect to the JDWP agent when you want to start debugging. But this was, for a time, significantly slower than using the onjcmd feature (source):
Fixing bugs in Spring Boot and Mockito by instrumenting them
Have you ever wondered how libraries like Spring and Mockito modify your code at run-time to implement all their advanced features? Wouldn’t it be cool to get a peek behind the curtains? This is the premise of my meta-agent, a Java agent to instrument instrumenters, to get these insights and what this blog post is about. This post is a collaboration with Mikaël Francoeur, who had the idea for the meta-agent and wrote most of this post. So it’s my first ever post-collaboration. But I start with a short introduction to the agent itself before Mikaël takes over with real-world examples.
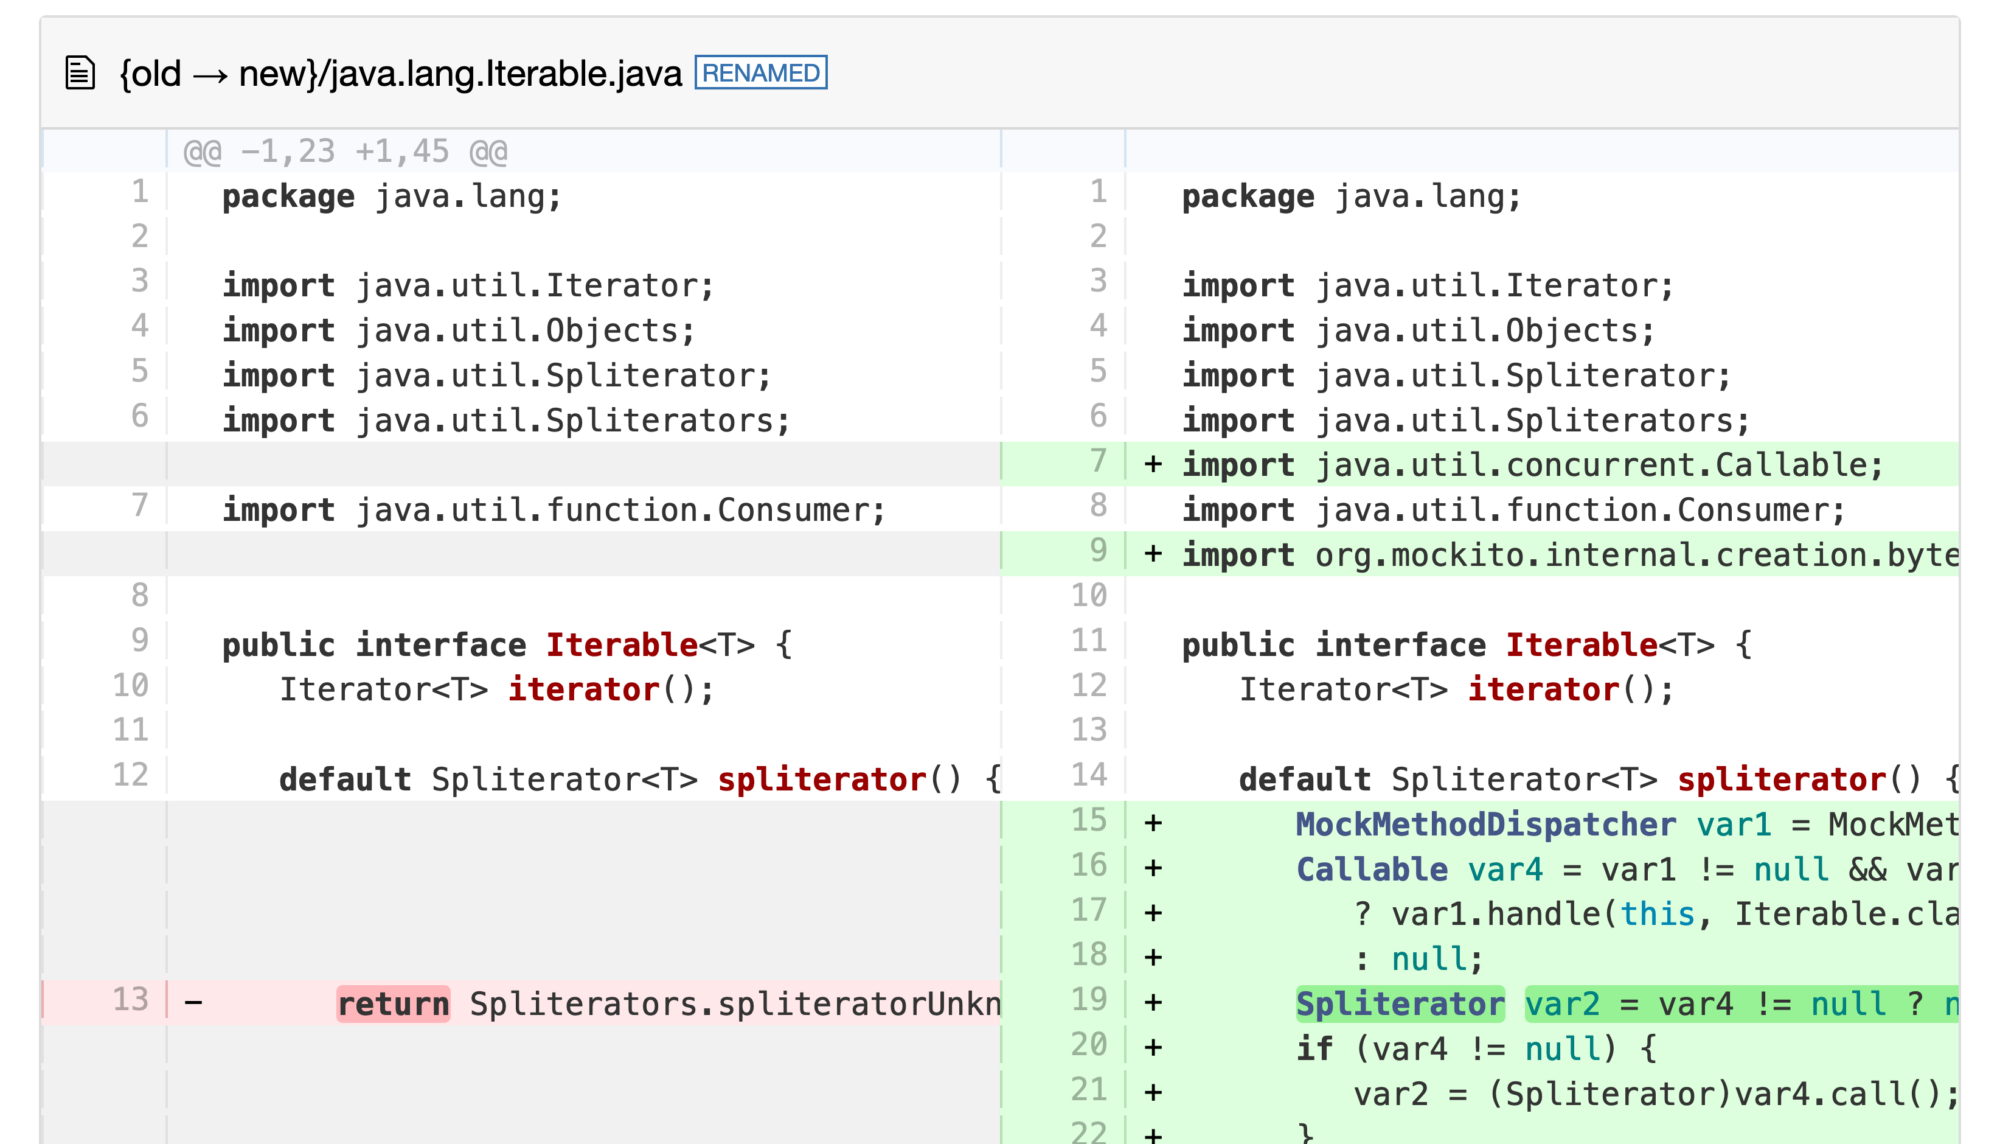
Meta-Agent
The meta-agent (GitHub) is a Java agent that instruments the Instrumentation.addTransformer methods agents use to add bytecode transformers and wrap the added transformers to capture bytecode before and after each transformation. This allows the agent to capture what every instrumenting agent does at run-time. I covered the basics of writing your own instrumenting agent before in my blog post Instrumenting Java Code to Find and Handle Unused Classes and my related talk. So, I’ll skip all the implementation details here.
But how can you use it? You first have to download the agent (or build it from scratch via mvn package -DskipTests), then you can just attach it to your JVM at the start:
A few months ago, I told you about the onjcmd feature in my blog post Level-up your Java Debugging Skills with on-demand Debugging (which is coming to JavaLand 2024). The short version is that adding onjcmd=y to the list of JDWP options allows you to delay accepting the incoming connection request in the JDWP agent until jcmd <JVM pid> VM.start_java_debugging is called.
The main idea is that the JDWP agent
only listens on the debugging port after it is triggered, which could have some security benefits
and that the JDWP agent causes less overhead while waiting, compared to just accepting connections from the beginning.
The first point is debatable; one can find arguments for and against it. But for the second point, we can run some benchmarks. After renewed discussions, I started benchmarking to conclude whether the onjcmd feature improves on-demand debugging performance. Spoiler alert: It doesn’t.
Renaissance is a modern, open, and diversified benchmark suite for the JVM, aimed at testing JIT compilers, garbage collectors, profilers, analyzers and other tools.
Renaissance is a benchmarking suite that contains a range of modern workloads, comprising of various popular systems, frameworks and applications made for the JVM.
Renaissance benchmarks exercise a range of programming paradigms, including concurrent, parallel, functional and object-oriented programming.
Renaissance typically runs the sub-benchmarks in multiple iterations. Still, I decided to run the sub-benchmarks just once per Renaissance run (via -r 1) and instead run Renaissance itself ten times using hyperfine to get a proper run-time distribution. I compared three different executions of Renaissance for this blog post:
without JDWP: Running Renaissance without any debugging enabled, to have an appropriate baseline, via java -jar renaissance.jar all -r 1
with JDWP: Running Renaissance in debugging mode, with the JDWP agent accepting debugging connections the whole time without suspending the JVM, via java -agentlib:jdwp=transport=dt_socket,server=y,suspend=n,address=*:5005 -jar renaissance.jar all -r 1
with onjcmd: Running Renaissance in debugging mode, with the JDWP agent accepting debugging connections only after the jcmd call without suspending the JVM, via java -agentlib:jdwp=transport=dt_socket,server=y,suspend=n,onjcmd=y,address=*:5005 -jar renaissance.jar all -r 1
Remember that we never start a debugging session or use jcmd, as we’re only interested in the performance of the JVM while waiting for a debugging connection in the JDWP agent.
Yes, I know that Renaissance uses different iteration numbers for the sub-benchmarks, but this should not affect the overall conclusions from the benchmark.
Results
Now to the results. For a current JDK 21 on my Ubuntu 23.10 machine with a ThreadRipper 3995WX CPU, hyperfine obtains the following benchmarks:
Benchmark 1: without JDWP
  Time (mean ± σ):     211.075 s ±  1.307 s    [User: 4413.810 s, System: 1438.235 s]
  Range (min … max):   209.667 s … 213.361 s    10 runs

Benchmark 2: with JDWP
  Time (mean ± σ):     218.985 s ±  1.924 s    [User: 4533.024 s, System: 1133.126 s]
  Range (min … max):   216.673 s … 222.249 s    10 runs

Benchmark 3: with onjcmd
  Time (mean ± σ):     219.469 s ±  1.185 s    [User: 4537.213 s, System: 1181.856 s]
  Range (min … max):   217.824 s … 221.316 s    10 runs

Summary
  "without JDWP" ran
    1.04 ± 0.01 times faster than "with JDWP"
    1.04 ± 0.01 times faster than "with onjcmd"
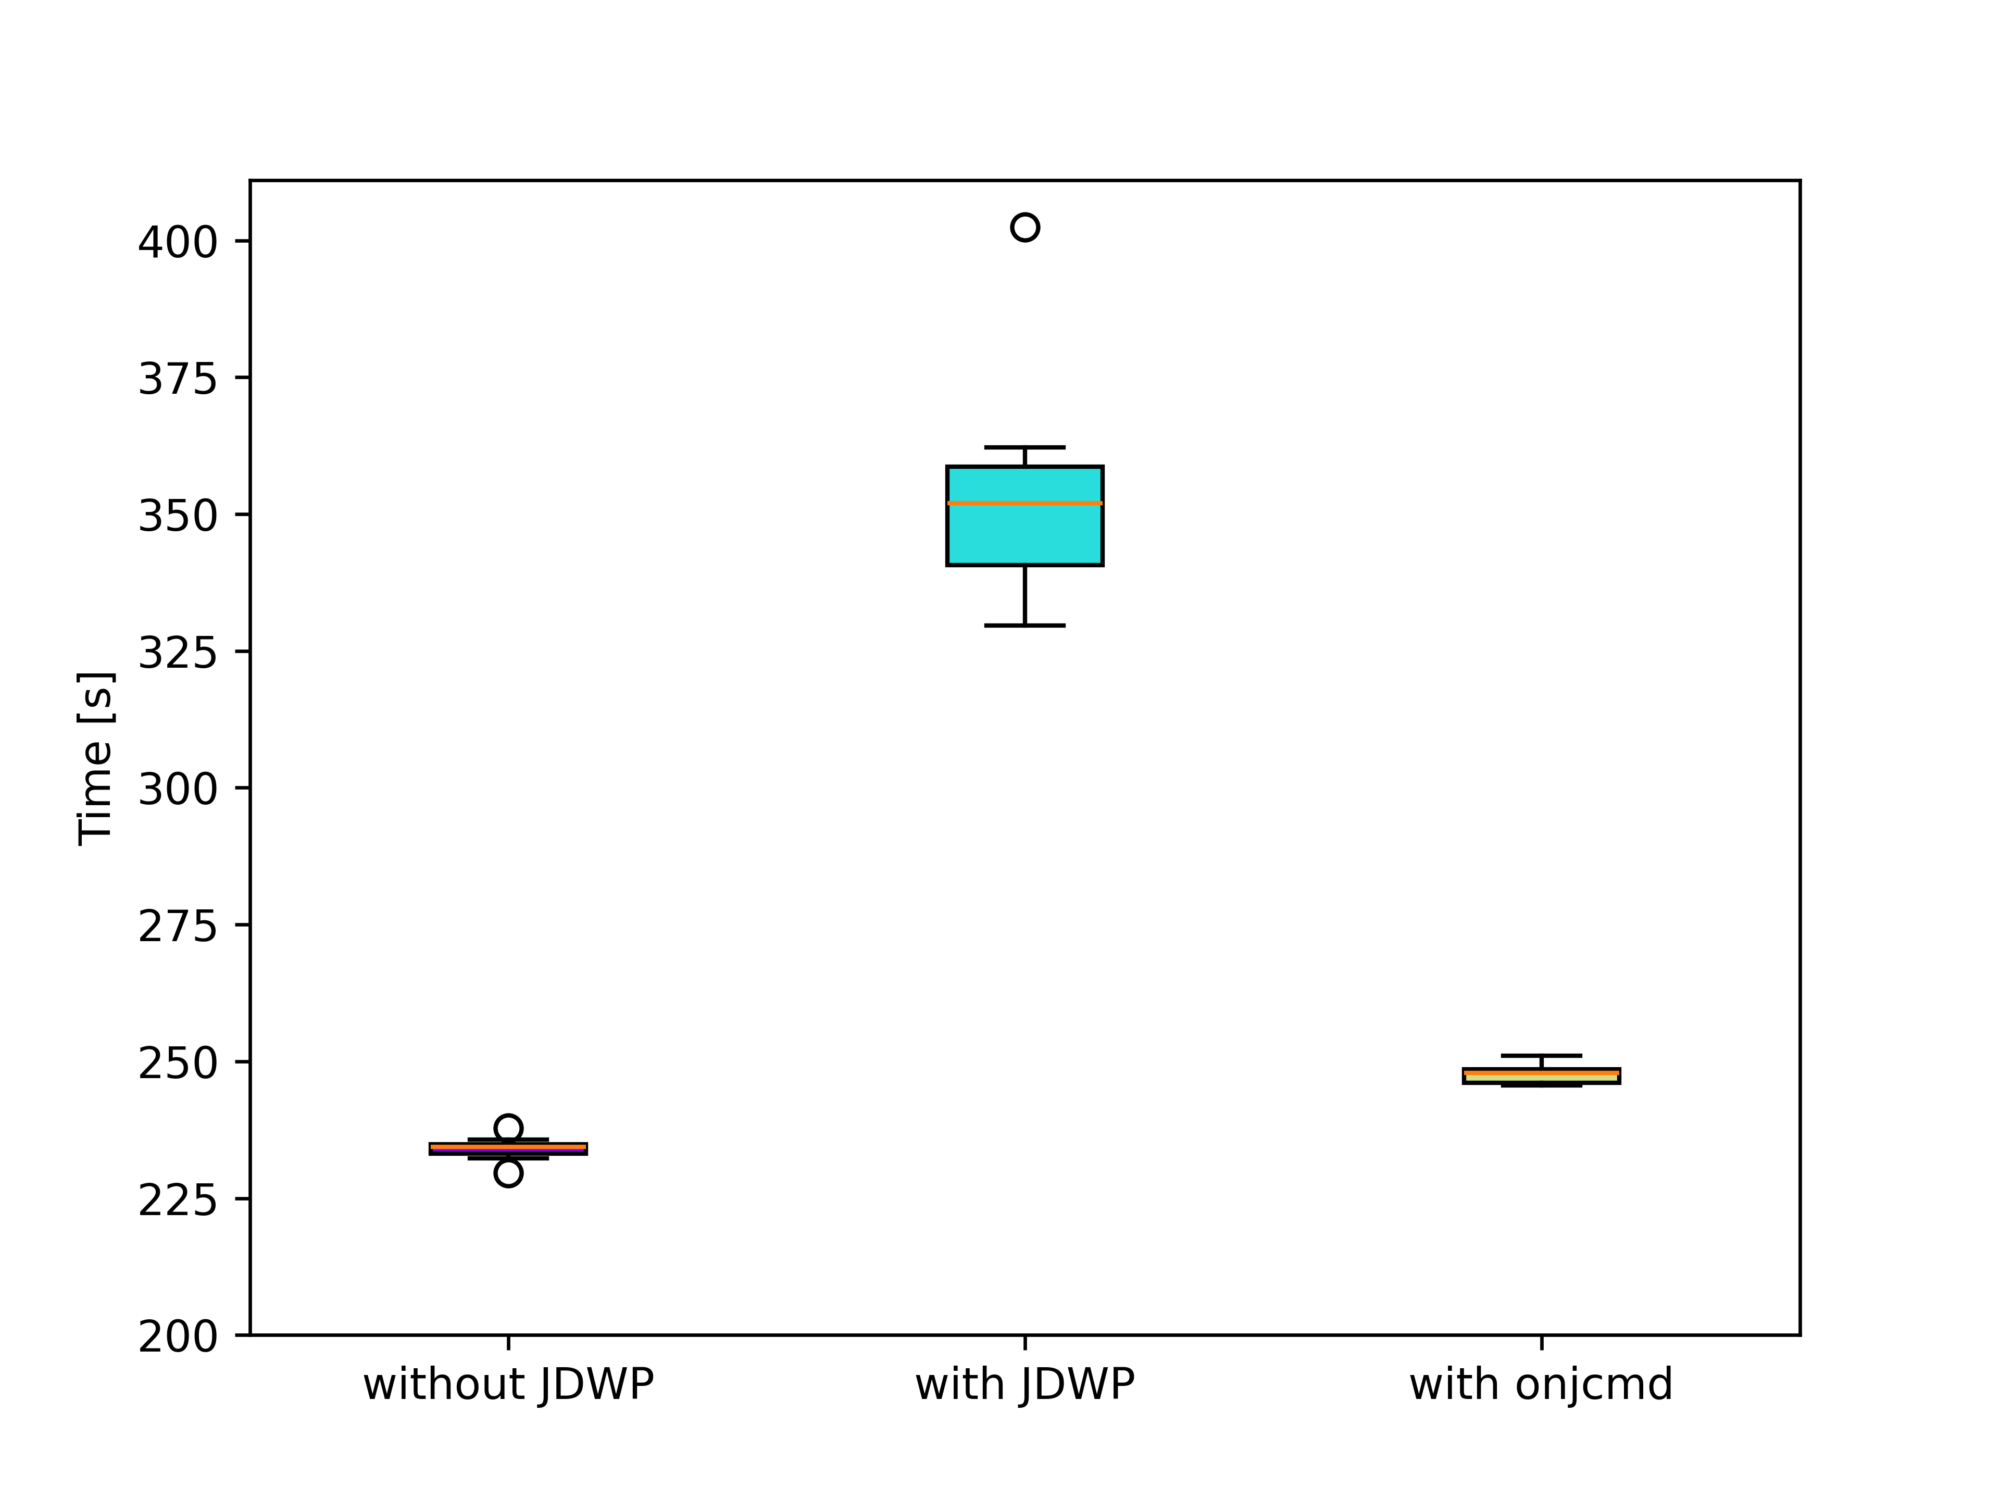
You can see that the run-time difference between “with JDWP” and “with onjcmd” is 0.5s, way below the standard deviations of both benchmarks. Plotting the benchmark results using box plots visualizes this fact:
Or, more analytically, Welch’s t-test doesn’t rule out the possibility of both benchmarks producing the same run-time distribution with p=0.5. There is, therefore, no measurable effect on the performance if we use the onjcmd feature. But what we do notice is that enabling the JDWP agent results in an increase in the run-time by 4%.
The question is then: Why has it been implemented in the JDK at all? Let’s run Renaissance on JDK 11.0.3, the first release supporting onjcmd.
Results on JDK 11.0.3
Here, using onjcmd results in a significant performance improvement of a factor of 1.5 (from 354 to 248 seconds) compared to running the JDWP agent without it:
Benchmark 1: without JDWP
  Time (mean ± σ):     234.011 s ±  2.182 s    [User: 5336.885 s, System: 706.926 s]
  Range (min … max):   229.605 s … 237.845 s    10 runs

Benchmark 2: with JDWP
  Time (mean ± σ):     353.572 s ± 20.300 s    [User: 4680.987 s, System: 643.978 s]
  Range (min … max):   329.610 s … 402.410 s    10 runs

Benchmark 3: with onjcmd
  Time (mean ± σ):     247.766 s ±  1.907 s    [User: 4690.555 s, System: 609.904 s]
  Range (min … max):   245.575 s … 251.026 s    10 runs
Summary
  "without JDWP" ran
    1.06 ± 0.01 times faster than "with onjcmd"
    1.51 ± 0.09 times faster than "with JDWP"
We excluded the finagle-chirper sub-benchmark here, as it causes the run-time to increase drastically. The sub-benchmark alone does not cause any problems, so the GC run possibly causes the performance hit before the sub-benchmark, which cleans up after the dotty sub-benchmark. Dotty is run directly before finagle-chirper.
Please be aware that the run sub-benchmarks on JDK 11 differ from the run on JDK 21, so don’t compare it to the results for JDK 21.
But what explains this difference?
Fixes since JDK 11.0.3
Between JDK 11.0.3 and JDK 21, there have been improvements to the OpenJDK, some of which drastically improved the performance of the JVM in debugging mode. Most notable is the fix for JDK-8227269 by Roman Kennke. The issue, reported by Egor Ushakov, reads as follows:
Slow class loading when running with JDWP
When debug mode is active (-agentlib:jdwp), an application spends a lot of time in JVM internals like Unsafe.defineAnonymousClass or Class.getDeclaredConstructors.Sometimes this happens on EDT and UI freezes occur.
If we look into the code, we’ll see that whenever a new class is loaded and an event about it is delivered, when a garbage collection has occurred, classTrack_processUnloads iterates over all loaded classes to see if any of them have been unloaded. This leads to O(classCount * gcCount) performance, which in case of frequent GCs (and they are frequent, especially the minor ones) is close to O(classCount^2). In IDEA, we have quite a lot of classes, especially counting all lambdas, so this results in quite significant overhead.
This change came into the JDK with 11.0.9. We see the 11.0.3 results with 11.0.8, but with 11.0.9, we see the results of the current JDK 11:
Benchmark 1: without JDWP
  Time (mean ± σ):     234.647 s ±  2.731 s    [User: 5331.145 s, System: 701.760 s]
  Range (min … max):   228.510 s … 238.323 s    10 runs

Benchmark 2: with JDWP
  Time (mean ± σ):     250.043 s ±  3.587 s    [User: 4628.578 s, System: 716.737 s]
  Range (min … max):   242.515 s … 254.456 s    10 runs

Benchmark 3: with onjcmd
  Time (mean ± σ):     249.689 s ±  1.765 s    [User: 4788.539 s, System: 729.207 s]
  Range (min … max):   246.324 s … 251.559 s    10 runs

Summary
  "without JDWP" ran
    1.06 ± 0.01 times faster than "with onjcmd"
    1.07 ± 0.02 times faster than "with JDWP"
This clearly shows the significant impact of the change. 11.0.3 came out on Apr 18, 2019, and 11.0.9 on Jul 15, 2020, so the onjcmd improved on-demand debugging for almost a year.
Want to try this out yourself? Get the binaries from SapMachine and run the benchmarks yourself. This kind of performance archaeology is quite rewarding, giving you insights into critical performance issues.
Conclusion
A few years ago, it was definitely a good idea to add the onjcmd feature to have usable on-demand debugging performance-wise. But nowadays, we can just start the JDWP agent to wait for a connection and connect to it whenever we want to, without any measurable performance penalty (in the Renaissance benchmark).
This shows us that it is always valuable to reevaluate if specific features are worth the maintenance cost. I hope this blog post gave you some insights into the performance of on-demand debugging. See you next week for the next installment in my hello-ebpf series.
This article is part of my work in the SapMachine team at SAP, making profiling and debugging easier for everyone.
JFR (JDK Flight Recorder) is the default profiler for OpenJDK (see my other blog posts for more information). What makes JFR stand out from the other profilers is the ability to log many, many different events that contain lots of information, like information on class loading, JIT compilation, and garbage collection. You can see a list of all available events on my JFR Event Collection website:
This website gives an overview of the events, with descriptions from the OpenJDK, their properties, examples, configurations, and the JDK versions in which every event is present. However, few descriptions are available, and the available texts are mostly single sentences.
TL:DR: I used GPT3.5 to create a description for every event by giving it the part of the OpenJDK source code that creates the event.
For most events, I state the lack of a description, coupled with a request that the knowledgeable reader might contribute one:
But as you can see, there is not really any progress in creating documentation. So, I have two options left:
Ask knowledgeable JDK developers to add descriptions: It’s time-consuming, and it would only be added in the next release
Write the descriptions myself directly for the website: This is pretty time-consuming, with over 150 events per JDK version.
Task AI to interpret the code that creates each event in the JDK source code.
With 1. and 2. infeasible, I started working on the AI approach, implementing it in my JFR event collector tool that collects the information displayed on the website.
I tried to use local AI models for this project but failed, so I started using GPT3.5-turbo and testing it on the OpenAI ChatGPT website. The main structure of my endeavor is as follows:
For every event, I first collect all usages and creations in the OpenJDK source, and then I construct a prompt of the following form that includes the surrounding context of the source locations:
Explain the JFR event <event> concisely so that the reader, proficient in JFR, knows the meaning and relevance of the event to profiling and its fields, without giving code snippets or referencing the code directly, take the following code as the context of its usage and keep it short and structured (and in markdown format, so format it properly to make it readable, using bullet points for field lists, but nothing else): <context>
Now some information about the event: Fields: <fields> It is <flags: experimental, internal>
Don’t mention implementation details, like methods, but explain the meaning of the event and how to use it for profiling. Keep field names lowercase and in backticks. Don’t use headings. Don’t repeat yourself. Keep it short.
For example, I asked ChatGPT the following for the ReservedStackActivation event:
Explain the JFR event ReservedStackActivation […]:
I then pass this prompt to GPT-3.5 and obtain the result:
The ReservedStackActivation event in JFR signifies a potentially dangerous stack overflow in a Java method that has been annotated with ReservedStackAccess. It is used for profiling purposes to identify methods that may be causing stack overflows.
The relevant field for this event is:
method: Represents the Java method where the potential stack overflow occurred.
My prompt and the code used to find the usage contexts, simple regular expressions without C++ parsing, is quite simplistic, but the results are somewhat usable.
But this event has also a description:
Activation of Reserved Stack Area caused by stack overflow with ReservedStackAccess annotated method in call stack
Why did I choose this event, then? Because it allows you to compare the LLM generated and the OpenJDK developer’s written description. Keep in mind that the LLM did not get passed the event description. The generated version is similar, yet more text.
You can find my implementation on GitHub (GPLv2.0 licensed) and the generated documentation on the JFR Event Collection:
Conclusion
I’m unsure whether I like or dislike the results of this experiment: It’s, on the one hand, great to generate descriptions for events that didn’t have any, using the code as the source of truth. But does it really give new insights, or is it just bloated text? I honestly don’t know whether the website needs it. Therefore, I am currently just generating it for JDK 21 and might remove the feature in the future. The AI can’t replace the insights you get by reading articles on specific events, like Gunnar Morling’s recent post on the NativeMemory events.
Do you have any opinions on this? Feel free to use the usual channels to voice your opinion, and consider improving the JFR documentation if you can.
See you next week with a blog post on something completely different yet slightly related to Panama and the reason for my work behind last week’s From C to Java Code using Panama article. Consider this as my Christmas present to my readers.
This article is part of my work in the SapMachine team at SAP, making profiling and debugging easier for everyone. Thanks to Vedran Lerenc for helping me with the LLM part of this project.
Or: I just released version 0.0.11 with a cool new feature that I can’t wait to tell you about…
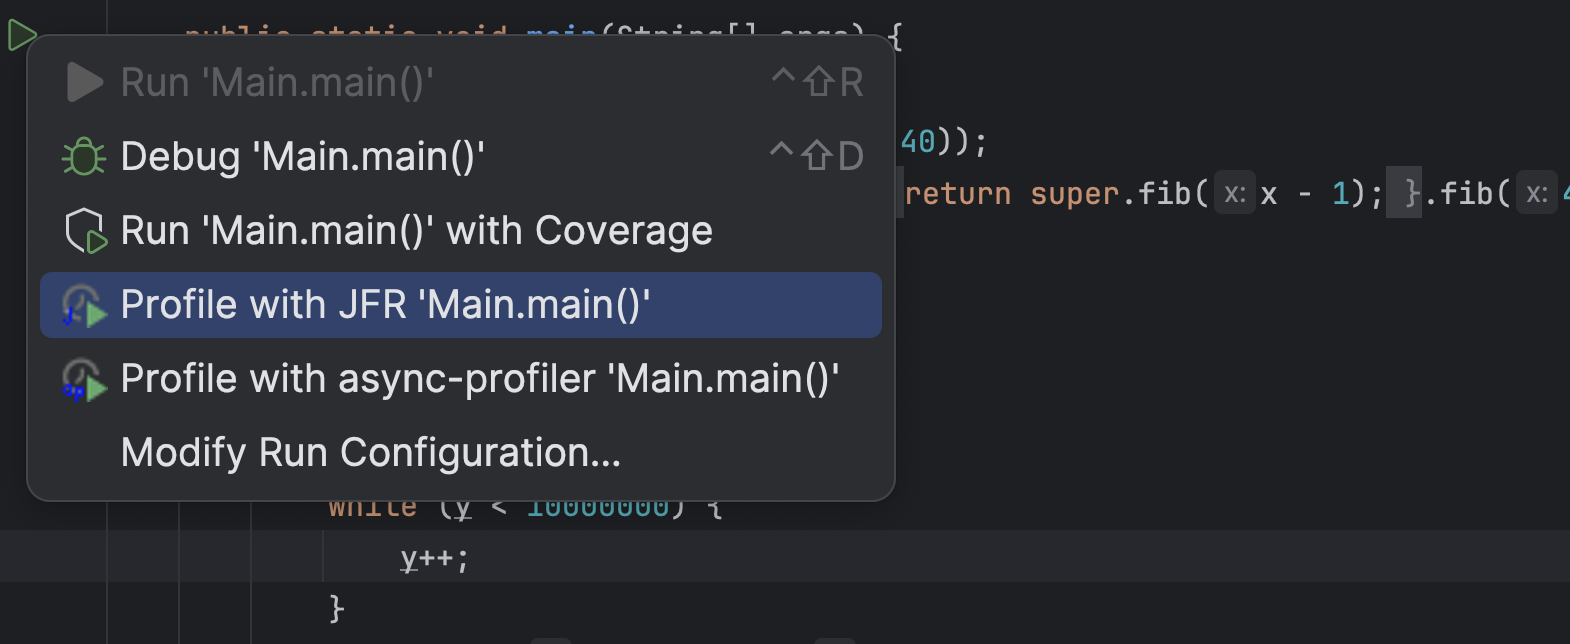
According to the recent JetBrains survey, most people use Maven as their build system and build Spring Boot applications with Java. Yet my profiling plugin for IntelliJ only supports profiling pure Java run configuration. Configurations where the JVM gets passed the main class to run. This is great for tiny examples where you directly right-click on the main method and profile the whole application using the context menu:
But this is not great when you’re using the Maven build system and usually run your application using the exec goal, or, god forbid, use Spring Boot or Quarkus-related goals. Support for these goals has been requested multiple times, and last week, I came around to implementing it (while also two other bugs). So now you can profile your Spring Boot, like the Spring pet-clinic, application running with spring-boot:run:
Giving you a profile like:
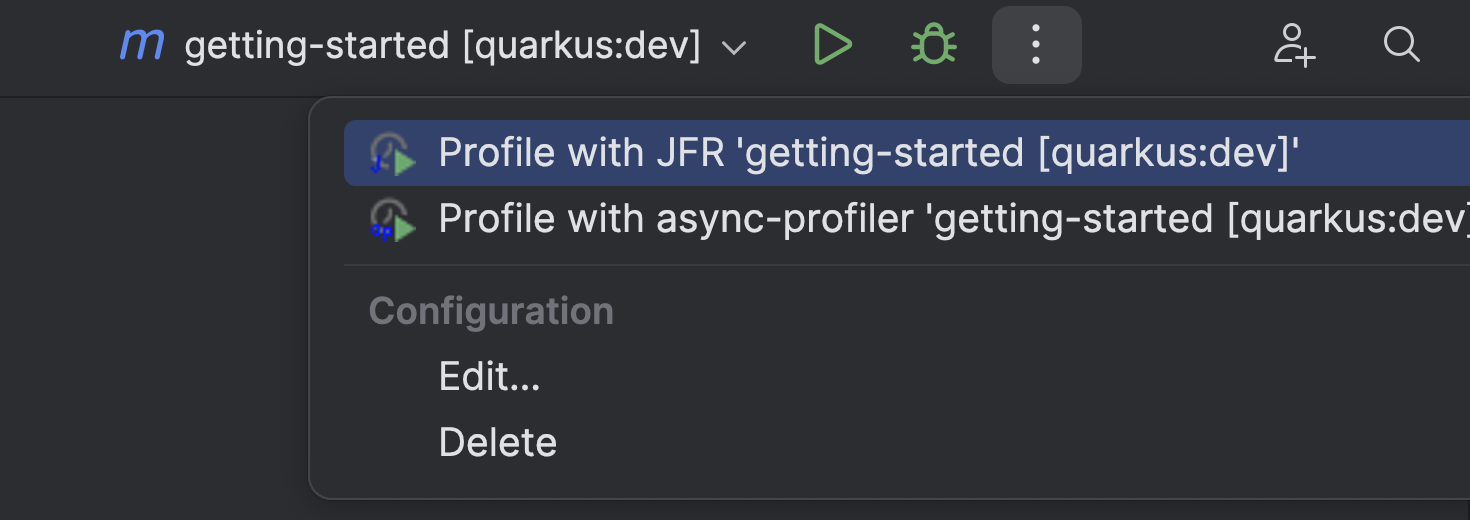
Or your Quarkus application running with quarkus:dev:
Giving you a profile like:
This works specifically by using the options of these goals, which allows the profiler plugin to pass profiling-specific JVM options. If the plugin doesn’t detect a directly supported plugin, it passes the JVM options via the MAVEN_OPTS environment variable. This should work with the exec goals and others.
Gradle script support has also been requested, but despite searching the whole internet till the night, I didn’t find any way to add JVM options to the JVM that Gradle runs for the Spring Boot or run tasks without modifying the build.gradle file itself (see Baeldung).
I left when it was dark and rode out into the night with my bike. Visiting other lost souls in the pursuit of sweet potato curry.
Only Quarku’s quarkusDev task has the proper options so that I can pass the JVM options. So, for now, I only have basic Quarkus support but nothing else. Maybe one of my readers knows how I could still provide profiling support for non-Quarkus projects.
You can configure the options that the plugin uses for specific task prefixes yourself in the .profileconfig.json file:
{
    "additionalGradleTargets": [
        {
            // example for Quarkus
            "targetPrefix": "quarkus",
            "optionForVmArgs": "-Djvm.args",
            "description": "Example quarkus config, adding profiling arguments via -Djvm.args option to the Gradle task run"
        }
    ],
    "additionalMavenTargets": [
        {   // example for Quarkus
            "targetPrefix": "quarkus:",
            "optionForVmArgs": "-Djvm.args",
            "description": "Example quarkus config, adding profiling arguments via -Djvm.args option to the Maven goal run"
        }
    ]
}
This update has been the first one with new features since April. The new features should make life easier for profiling both real-world and toy applications. If you have any other feature requests, feel free to create an issue on GitHub and, ideally, try to create a pull request. I’m happy to help you get started.
See you next week on some topics I have not yet decided on. I have far more ideas than time…
This article is part of my work in the SapMachine team at SAP, making profiling and debugging easier for everyone. Thanks to the issue reporters and all the other people who tried my plugin.