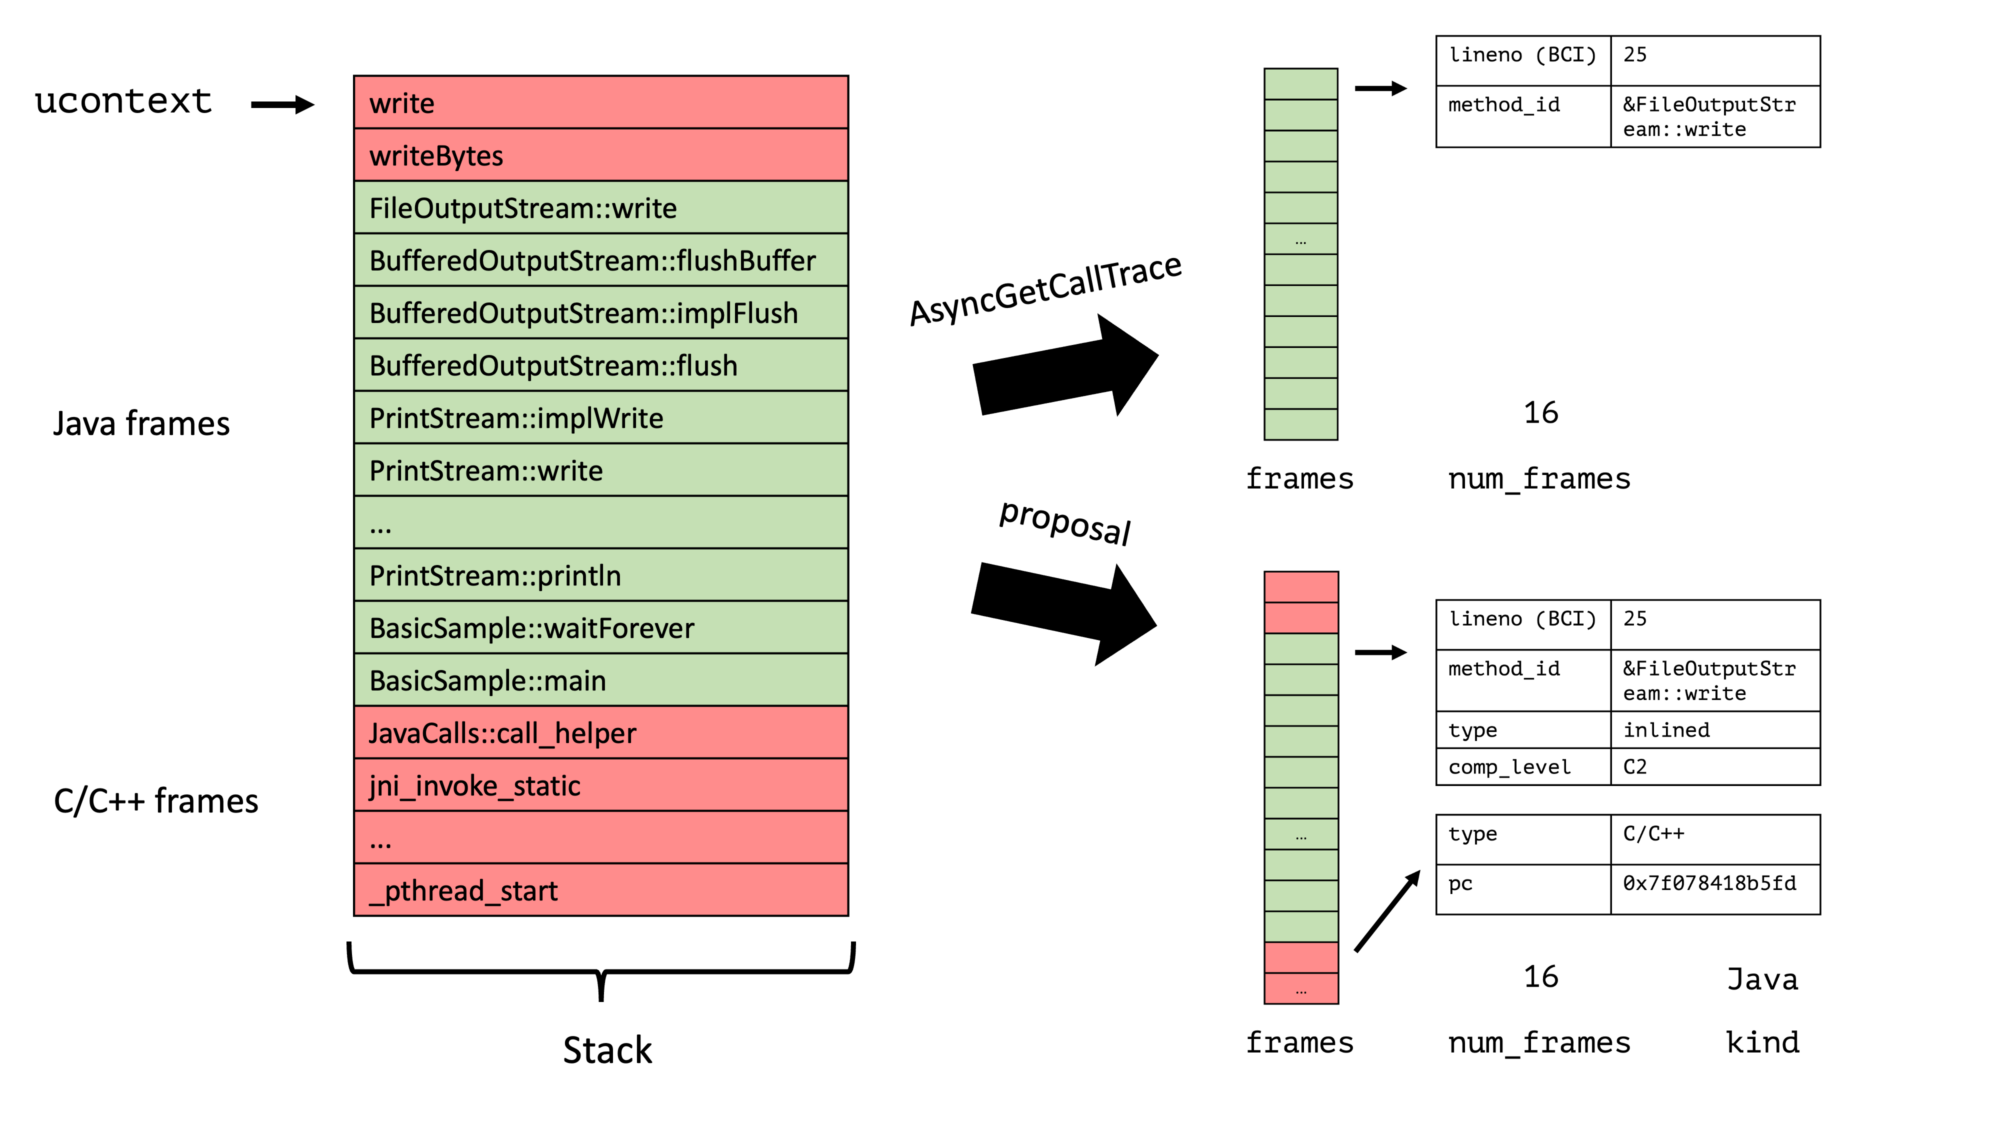
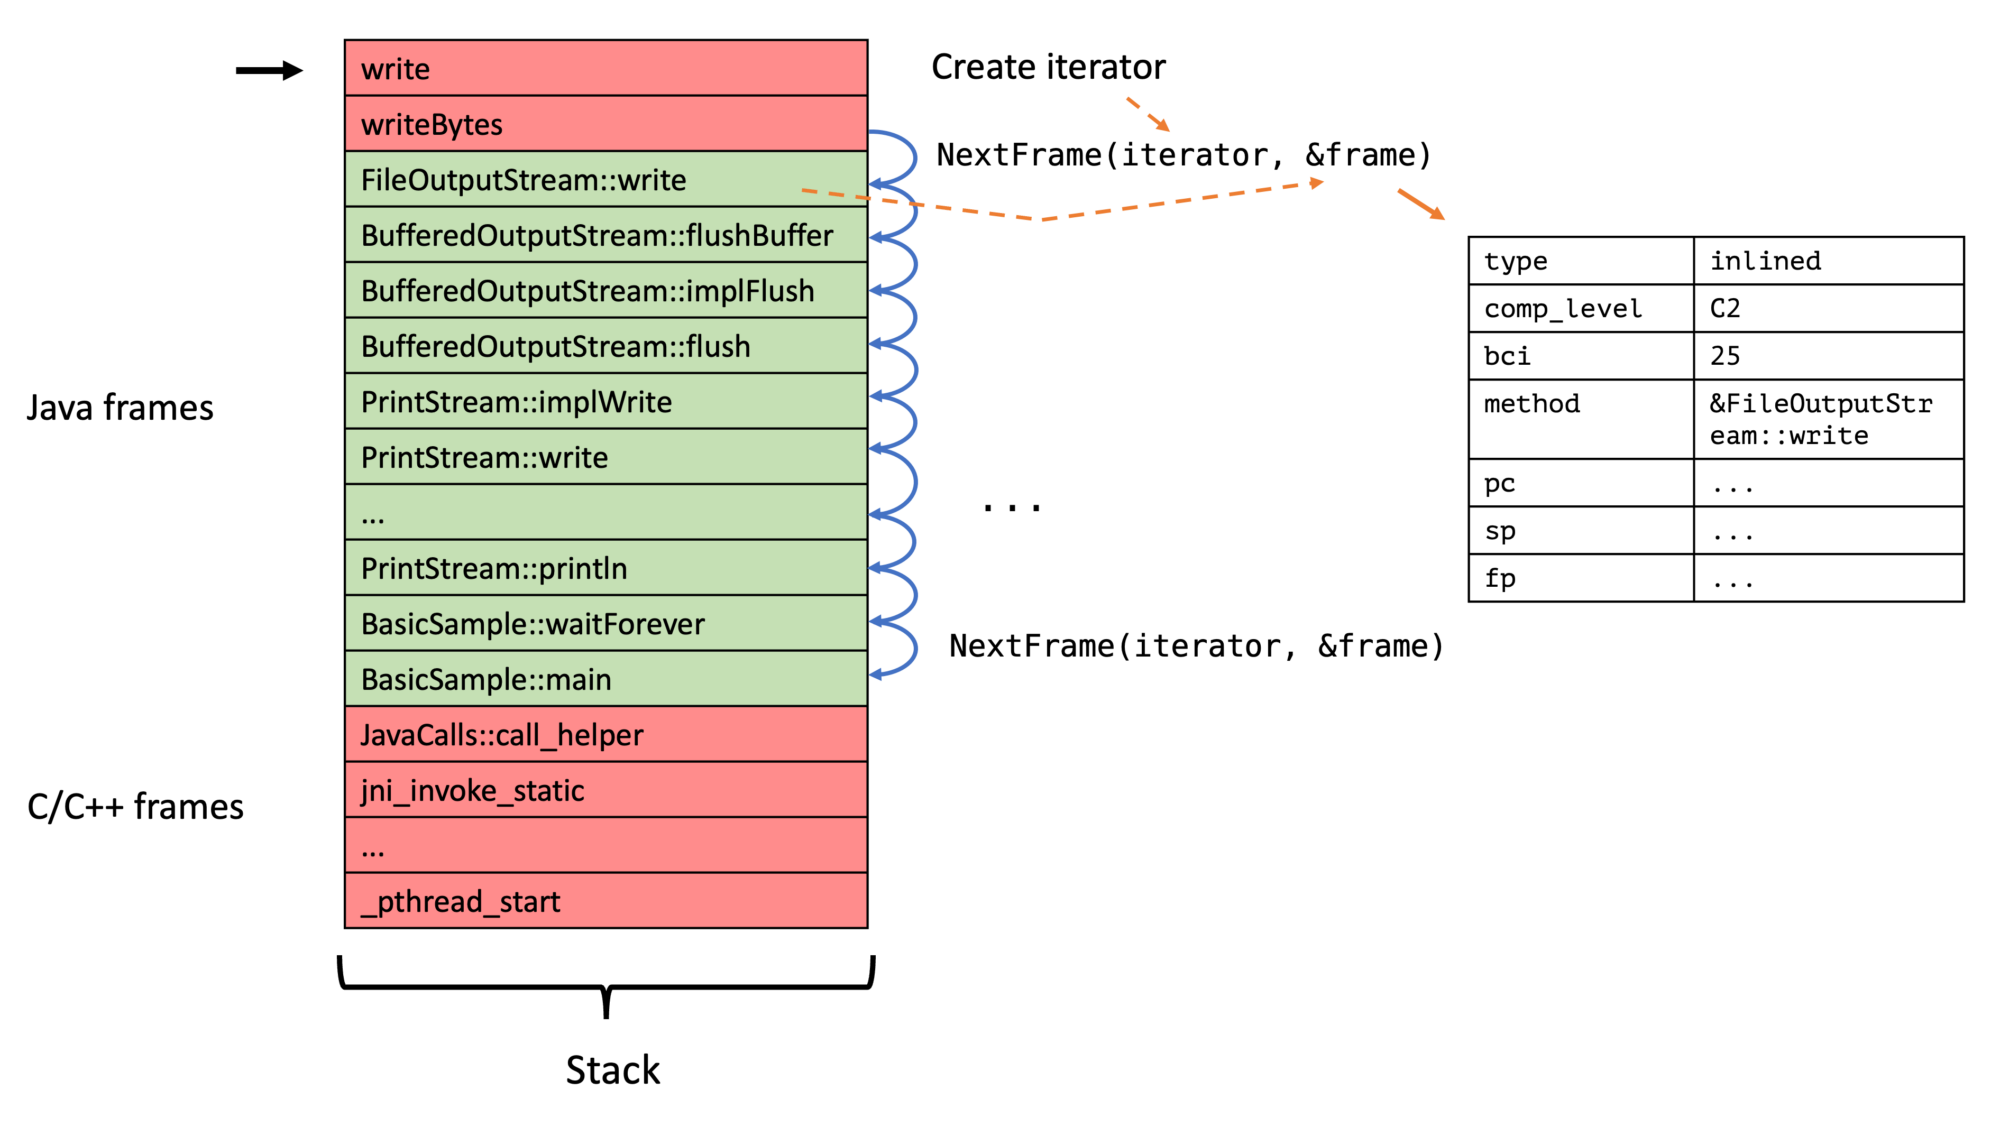
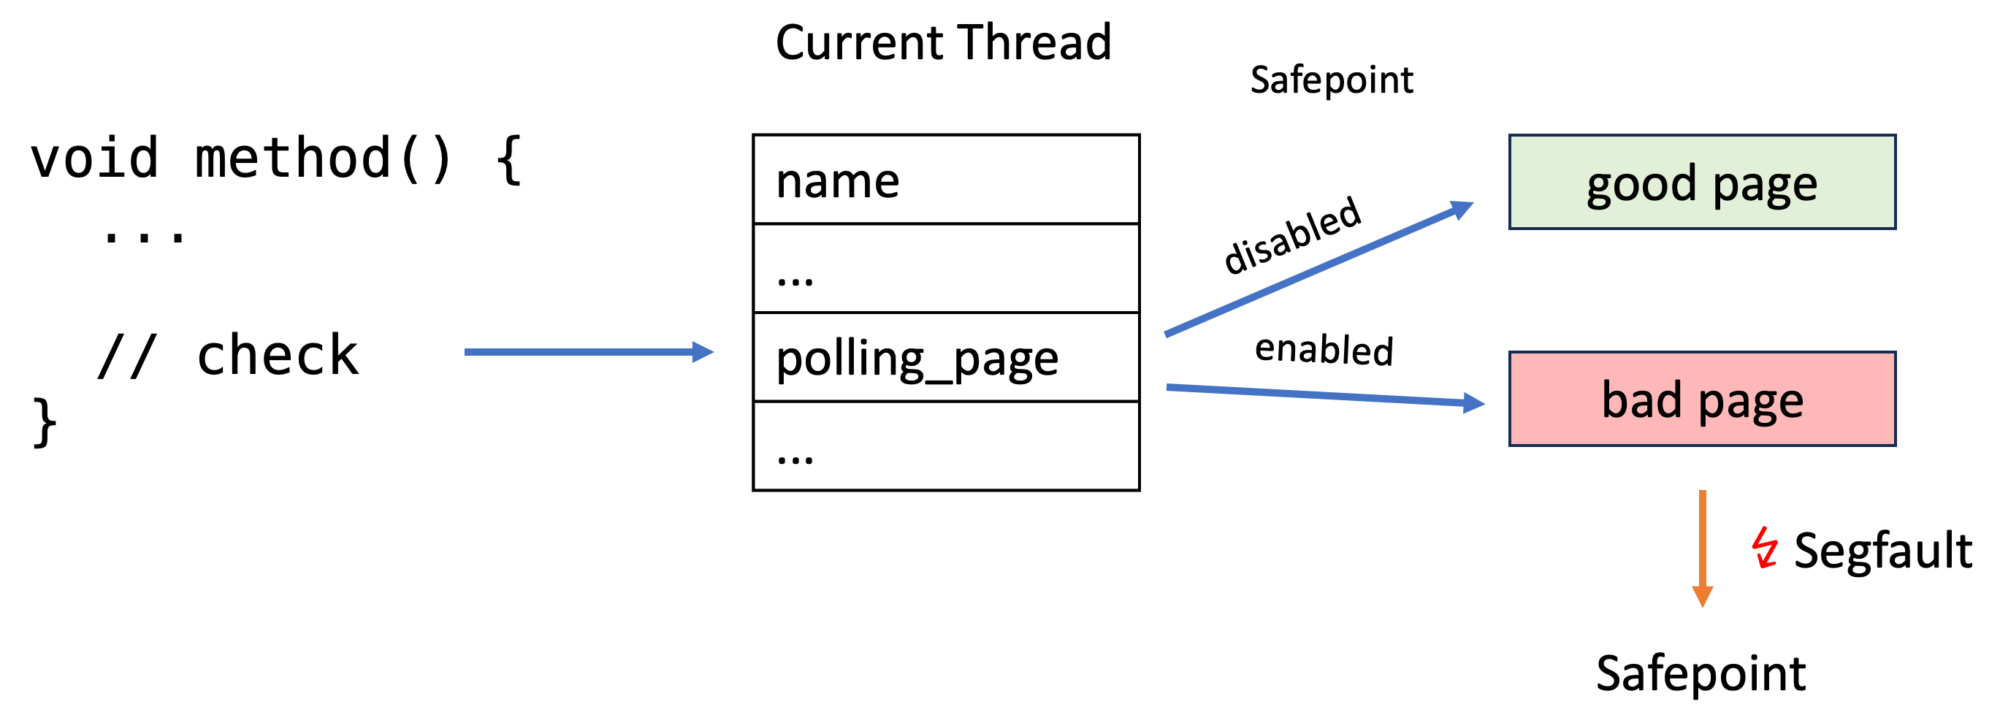
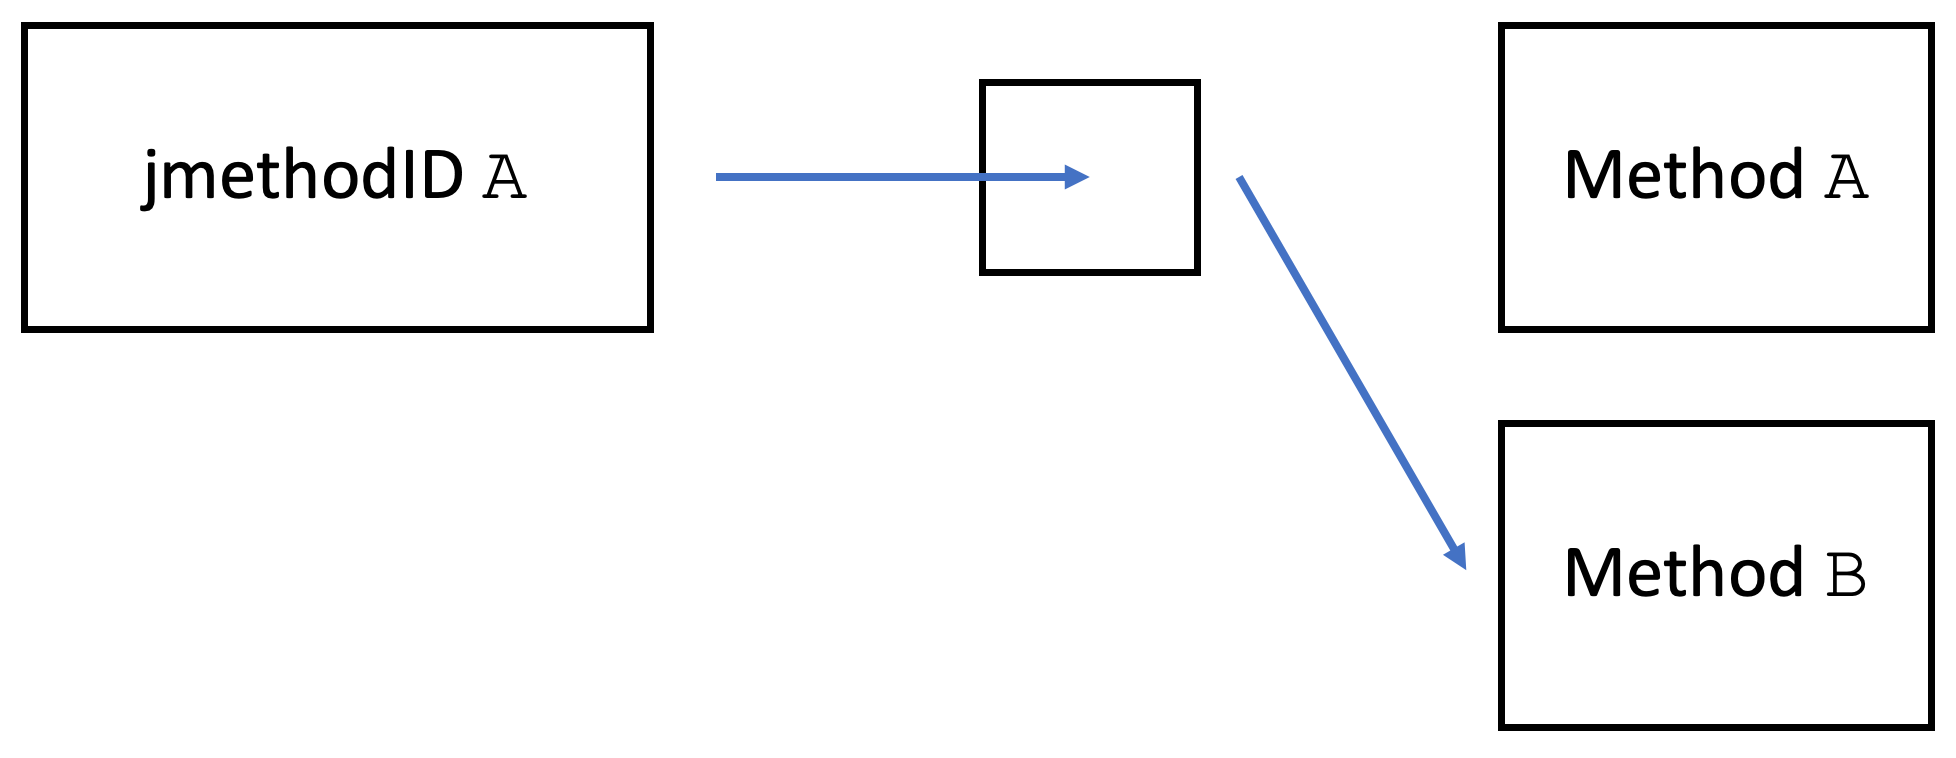
I gave a talk on the topic of Python 3.12’s new monitoring and debugging API at FOSDEM’s Python Devroom:
Furthermore, I’m excited to announce my acceptance to PyCon Berlin this year. When I started my blog series last year, I would’ve never dreamed of speaking at a large Python conference. I’m probably the only OpenJDK developer there, but I’m happy to meet many new people from a different community.
This article is part of my work in the SapMachine team at SAP, making profiling and debugging easier for everyone.
This week, I’ll show you briefly how to use another kind of eBPF maps, the perf event buffer, and run tests with docker and JUnit 5.
This blog post is shorter than the previous one as I’m preparing for the OpenJDK committers workshop in Brussels and my Python and Java DevRoom talks at FOSDEM. I’m happy to meet my readers; say hi when you’re there.
Perf Event Buffer
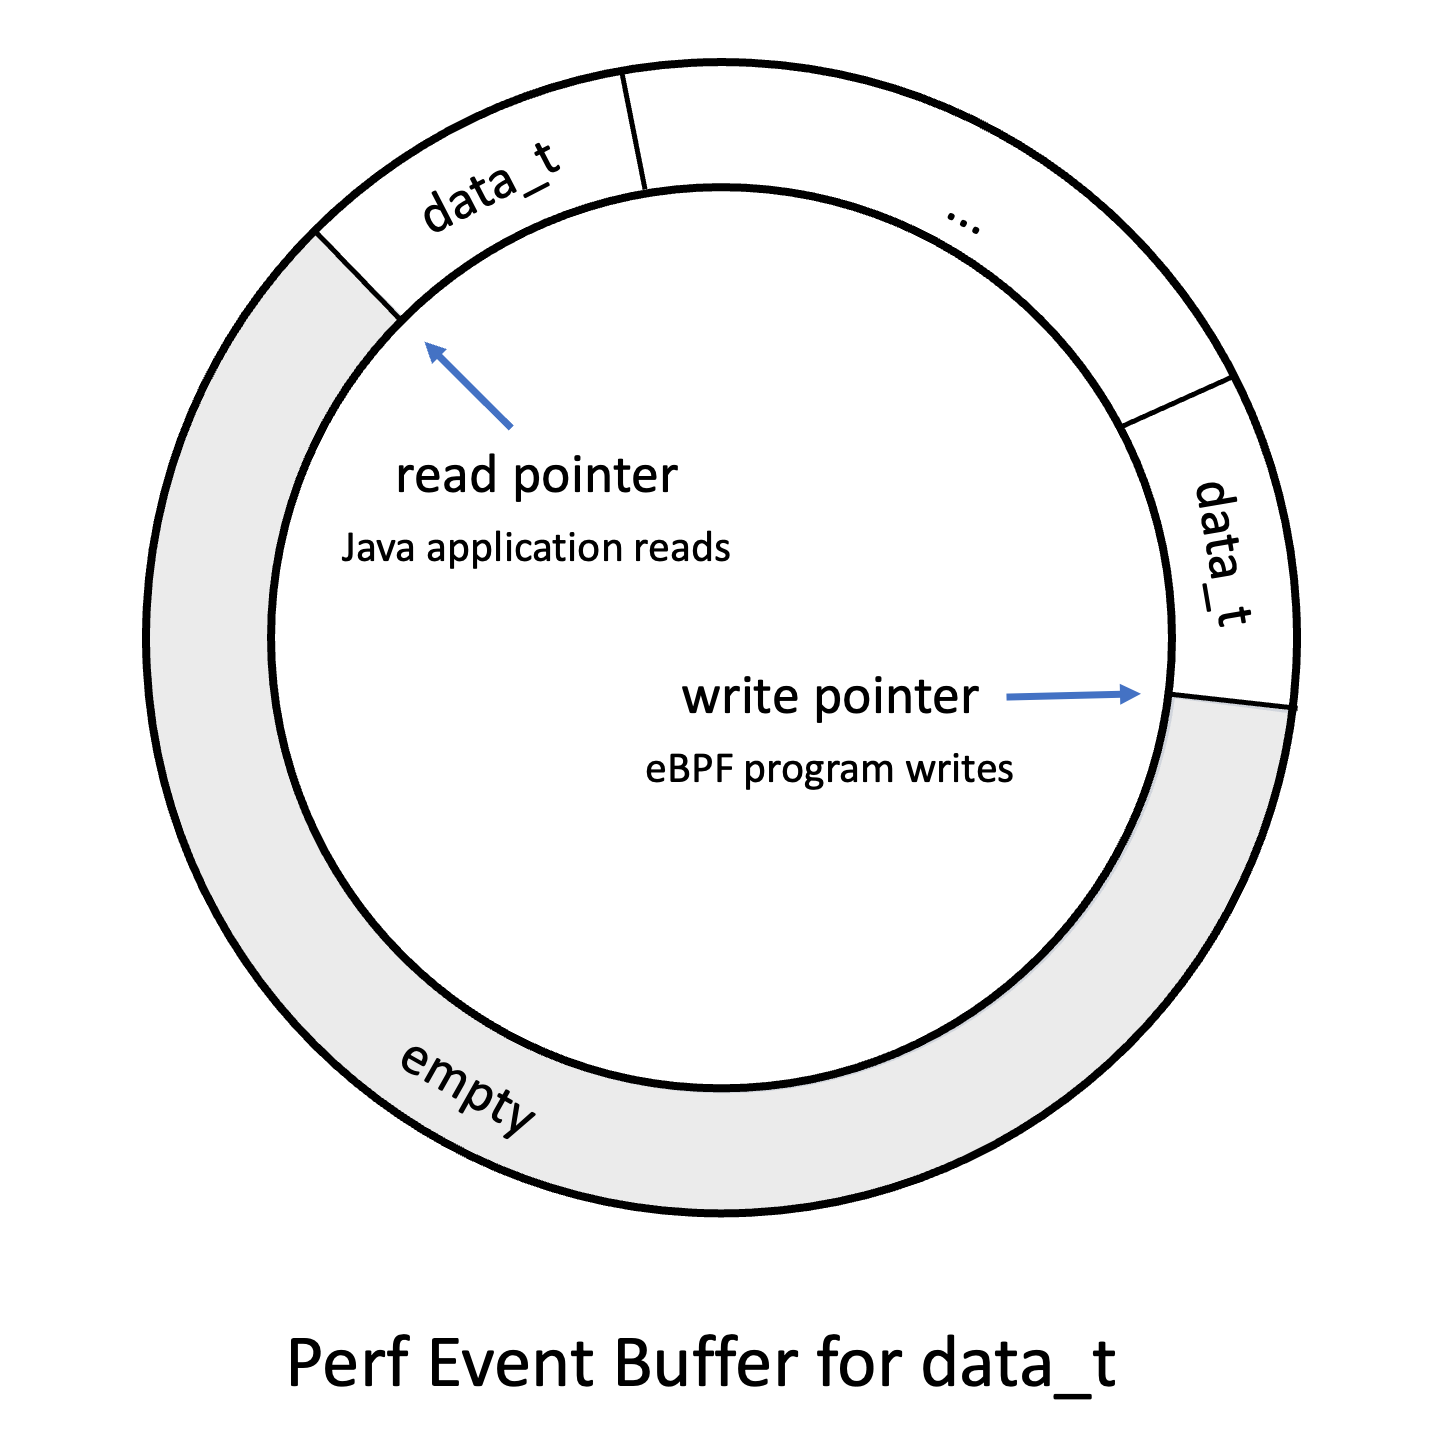
Data structures, like the hash map described in the previous blog post, are great for storing data but have their limitation when we want to pass new bits of information continuously from the eBPF program to our user-land application. This is especially pertinent when recording performance events. So, in 2015, the Linux kernel got a new map type: BPF_MAP_TYPE_PERF_EVENT_ARRAY. This map type functions as a fixed-size ring buffer that can store elements of a given size and is allocated per CPU. The eBPF program submits data to the buffer, and the user-land application retrieves it. When the buffer is full, data can’t be submitted, and a drop counter is incremented.
Perf Event Buffers have their issues, as explained by Andrii Nakryiko, so in 2020,eBPF got ring buffers, which have less overhead. Perf Event Buffers are still used, as only Linux 5.8 and above supports ring buffers. It doesn’t make a difference for our toy examples, but I’ll show you how to use ring buffers in a few weeks.
You can read more about Perf Event Buffers in the Learning eBPF book by Liz Rice, pages 24 to 28.
Example
Now, to a small example, called chapter2.HelloBuffer, which records for every execve call the calling process id, the user id, and the current task name and transmits it to the Java application:
> ./run.sh chapter2.HelloBuffer
2852613 1000 code Hello World # vs code
2852635 1000 code Hello World
2852667 1000 code Hello World
2852690 1000 code Hello World
2852742 1000 Sandbox Forked Hello World # Firefox
2852760 1000 pool-4-thread-1 Hello World
2852760 1000 jspawnhelper Hello World # Java ProcessBuilder
2852760 1000 jspawnhelper Hello World
This gives us already much more information than the simple counter from my last blog post. The eBPF program to achieve this is as follows:
BPF_PERF_OUTPUT(output);
struct data_t {
int pid;
int uid;
char command[16];
char message[12];
};
int hello(void *ctx) {
struct data_t data = {};
char message[12] = "Hello World";
// obtain process and user id
data.pid = bpf_get_current_pid_tgid() >> 32;
data.uid = bpf_get_current_uid_gid() & 0xFFFFFFFF;
// obtain the current task/thread/process name,
// without the folder, of the task that is currently
// running
bpf_get_current_comm(&data.command,
sizeof(data.command));
// "Safely attempt to read size bytes from kernel space
// address unsafe_ptr and store the data in dst." (man-page)
bpf_probe_read_kernel(&data.message,
sizeof(data.message), message);
// try to submit the data to the perf buffer
output.perf_submit(ctx, &data, sizeof(data));
return 0;
}
You can get more information on bpf_get_current_com, bpf_probe_read_kernel in the bpf-helpers(7) man-page.
The Java application that reads the buffer and prints the obtained information is not too dissimilar from the example in my previous blog post. We first define the Data type:
record Data(
int pid,
int uid,
// we model char arrays as Strings
// with a size annotation
@Size(16) String command,
@Size(12) String message) {}
// we have to model the data type as before
static final BPFType.BPFStructType<Data> DATA_TYPE =
new BPFType.BPFStructType<>("data_t",
List.of(
new BPFType.BPFStructMember<>("pid",
BPFType.BPFIntType.INT32, 0, Data::pid),
new BPFType.BPFStructMember<>("uid",
BPFType.BPFIntType.INT32, 4, Data::uid),
new BPFType.BPFStructMember<>("command",
new BPFType.StringType(16), 8, Data::command),
new BPFType.BPFStructMember<>("message",
new BPFType.StringType(12), 24, Data::message)),
new BPFType.AnnotatedClass(Data.class, List.of()),
objects -> new Data((int) objects.get(0),
(int) objects.get(1),
(String) objects.get(2),
(String) objects.get(3)));
You might recognize that the BPF types now have the matching Java type in their type signature. I added this to have more type safety and less casting.
try (var b = BPF.builder("""
...
""").build()) {
var syscall = b.get_syscall_fnname("execve");
b.attach_kprobe(syscall, "hello");
BPFTable.PerfEventArray.EventCallback<Data> print_event =
(/* PerfEventArray instance */ array,
/* cpu id of the event */ cpu,
/* event data */ data,
/* size of the event data */ size) -> {
var d = array.event(data);
System.out.printf("%d %d %s %s%n",
d.pid(), d.uid(), d.command(), d.message());
};
try (var output = b.get("output",
BPFTable.PerfEventArray.<Data>createProvider(DATA_TYPE))
.open_perf_buffer(print_event)) {
while (true) {
// wait till packages are available,
// you can a timeout in milliseconds
b.perf_buffer_poll();
}
}
}
Tests
I’m happy to announce that hello-ebpf now has its own test runner, which uses virtme and docker to run all tests in their own runtime with their own kernel. All this is wrapped in my testutil/bin/java wrapper so that you can run the tests using mvn test:
mvn -Djvm=testutil/bin/java
And the best part? All tests are written using plain JUnit 5. As an example, here is the HelloWorld test:
public class HelloWorldTest {
@Test
public void testHelloWorld() throws Exception {
try (BPF b = BPF.builder("""
int hello(void *ctx) {
bpf_trace_printk("Hello, World!");
return 0;
}
""").build()) {
var syscall = b.get_syscall_fnname("execve");
b.attach_kprobe(syscall, "hello");
Utils.runCommand("uname", "-r");
// read the first trace line
var line = b.trace_readline();
// assert its content
assertTrue(line.contains("Hello, World!"));
}
}
}
There are currently only two tests, but I plan to add many more.
Conclusion
In this blog post, we learned about Perf Event Buffers, a valuable data structure for repeatedly pushing information from the eBPF program to the user-land application. Implementing this feature, we’re getting closer and closer to completing chapter 2 of the Learning eBPF book. Truth be told, the implementation in the GitHub repository supports enough of the BCC to implement the remaining examples and even the exercises from Chapter 2.
In the next part of the hello-ebpf series, I’ll show you how to tail call in eBPF to other eBPF functions and how to write your first eBPF application that uses the hello-ebpf library as a dependency.
Thanks for joining me on this journey to create a proper Java API for eBPF. Feel free to try the examples for yourself or even write new ones and join the discussions on GitHub. See you in my next blog post or at FOSDEM.
This article is part of my work in the SapMachine team at SAP, making profiling and debugging easier for everyone.
public class HelloWorld {
public static void main(String[] args) {
try (BPF b = BPF.builder("""
int hello(void *ctx) {
bpf_trace_printk("Hello, World!");
return 0;
}
""").build()) {
var syscall = b.get_syscall_fnname("execve");
b.attach_kprobe(syscall, "hello");
b.trace_print();
}
}
}
But what if we want to send more information from our eBPF program to our userland application than just some logs? For example, to share the accumulated number of execve calls, the processes of a specific user called and transmits information akin to:
record Data(
/** user id */
@Unsigned long uid,
/** group id */
@Unsigned long gid,
/** count of execve calls */
@Unsigned int counter) {}
This is what this week’s blog post is all about.
Communication
When two regular programs want to share information, they either send data via sockets or use shared memory that both programs can access:
eBPF uses none of the above two approaches: Working with sockets makes a shared state hard to maintain, and using shared memory is difficult because the eBPF program lives in the kernel and the Java program in userland. Accessing any userland memory from eBPF at all is deemed to be experimental, according to the official BPF Design Q&A:
Tracing BPF programs can overwrite the user memory of the current task with bpf_probe_write_user(). Every time such program is loaded the kernel will print warning message, so this helper is only useful for experiments and prototypes. Tracing BPF programs are root only.
But how can we then communicate? This is where eBPF maps come in:
BPF ‘maps’ provide generic storage of different types for sharing data between kernel and user space. There are several storage types available, including hash, array, bloom filter and radix-tree. Several of the map types exist to support specific BPF helpers that perform actions based on the map contents.
BPF maps are accessed from user space via the bpf syscall, which provides commands to create maps, lookup elements, update elements and delete elements.
These fixed-size data structures form the backbone of every eBPF application, and their support is vital to creating any non-trivial tool.
Using basic eBPF maps
Using these maps, we can implement our execve-call-counter eBPF program. We start with the simple version that just stores the counter in a simple user-id-to-counter hash map:
// macro to create a uint64_t to uin64_t hash map
BPF_HASH(counter_table);
// u64 (also known as uint64_t) is an unsigned
// integer with a width of 64 bits
// in Java terms, it's the unsigned version
// of long
int hello(void *ctx) {
u64 uid;
u64 counter = 0;
u64 *p;
uid = bpf_get_current_uid_gid() & 0xFFFFFFFF;
p = counter_table.lookup(&uid);
// p is null if the element is not in the map
if (p != 0) {
counter = *p;
}
counter++;
counter_table.update(&uid, &counter);
return 0;
}
This example is from the Learning eBPF book by Liz Rice, pages 21 to 23, where you can find a different take. And if you’re wondering why we’re using u64 instead of the more standard uint64_t, this is because the Linux kernel predates the definition of u64 (and other such types) in stdint.h (see StackOverflow), although today it’s possible to use both.
In this example, we first create a hash called counter_table using the bcc macro BPF_HASH. We can access the hash map using the bcc-only method lookup and update, which are convenience wrappers for void *bpf_map_lookup_elem(struct bpf_map *map, const void *key) and long bpf_map_update_elem(struct bpf_map *map, const void *key,const void *value, u64 flags) (see the bpf-helpers man-page). Additionally, we use bpf_get_current_uid_gid() to get the current user-id:
u64 bpf_get_current_uid_gid(void)
Description Get the current uid and gid.
Return A 64-bit integer containing the current GID and UID, and created as such: current_gid << 32 | current_uid.
A side note regarding naming: “table” and “map” are used interchangeably in the bcc Python-API and related examples, which I carried over into the Java-API for consistency.
Now to the userland program: The hello-ebpf Java API offers methods to access these maps and can be used to write a userland program, HelloMap, that prints the contents of the maps every few seconds:
public class HelloMap {
public static void main(String[] args)
throws InterruptedException {
try (var b = BPF.builder("""
...
""").build()) {
var syscall = b.get_syscall_fnname("execve");
// attach the eBPF program to execve
b.attach_kprobe(syscall, "hello");
// create a mirror for the hash table eBPF map
BPFTable.HashTable<Long, Long> counterTable =
b.get_table("counter_table",
UINT64T_MAP_PROVIDER);
while (true) {
Thread.sleep(2000);
// the map mirror implements the Java Map
// interface with methods like
// Map.entrySet
for (var entry : counterTable.entrySet()) {
System.out.printf("ID %d: %d\t",
entry.getKey(),
entry.getValue());
}
System.out.println();
}
}
}
}
This program attaches the eBPF program to the execve system call and uses the HashTable map mirror to access the map counter_table.
You can run the example using the run.sh script (after you built the project via the build.sh script) as root on an x86 Linux:
> ./run.sh chapter2.HelloMap
ID 0: 1 ID 1000: 3
ID 0: 1 ID 1000: 3
ID 0: 1 ID 1000: 4
ID 0: 1 ID 1000: 11
ID 0: 1 ID 1000: 11
ID 0: 1 ID 1000: 12
...
ID 0: 22 ID 1000: 176
Here, user 0 is the root user, and user 1000 is my non-root user, I called ls in the shell with both users a few times to gather some data.
But maybe my map mirror is broken, and this data is just a fluke? It’s always good to have a way to check the content of the maps. This is where bpftool-map comes into play: We can use
> bpftool map list
2: prog_array name hid_jmp_table flags 0x0
key 4B value 4B max_entries 1024 memlock 8512B
owner_prog_type tracing owner jited
40: hash name counter_table flags 0x0
key 8B value 8B max_entries 10240 memlock 931648B
btf_id 142
> bpftool map dump name counter_table
[{
"key": 1000,
"value": 163
},{
"key": 0,
"value": 22
}
]
We can see that our examples are in the correct ballpark.
Storing simple numbers in a map is great, but what if we want to keep more complex information as values in the map, like the Data record with user-id, group-id, and counter from the beginning of this article?
The most recent addition to the hello-ebpf project is the support of record/struct values in maps:
Storing more complex structs in maps
The eBPF code for this example is a slight extension of the previous example:
// record Data(
// @Unsigned long uid,
// @Unsigned long gid,
// @Unsigned int counter
// ){}
struct data_t {
u64 uid;
u64 gid;
u32 counter;
};
// u64 to data_t map
BPF_HASH(counter_table, u64, struct data_t);
int hello(void *ctx) {
// get user id
u64 uid = bpf_get_current_uid_gid() & 0xFFFFFFFF;
// get group id
u64 gid = bpf_get_current_uid_gid() >> 32;
// create data object
// with uid, gid and counter=0
struct data_t info = {uid, gid, 0};
struct data_t *p = counter_table.lookup(&uid);
if (p != 0) {
info = *p;
}
info.counter++;
counter_table.update(&uid, &info);
return 0;
}
The Java application is slightly more complex, as we have to model the data_t struct in Java. We start by defining the record Data as before:
record Data(
/** user id */
@Unsigned long uid,
/** group id */
@Unsigned long gid,
/** count of execve calls */
@Unsigned int counter) {}
The @Unsigned annotation is part of the ebpf-annotations module and allows you to document type properties that aren’t present in Java.
/**
* Struct
*
* @param bpfName name of the struct in BPF
* @param members members of the struct,
* order should be the same as
* in the constructor
* @param javaClass class that represents the struct
* @param constructor constructor that takes the members
* in the same order as
* in the constructor
*/
record BPFStructType(String bpfName,
List<BPFStructMember> members,
AnnotatedClass javaClass,
Function<List<Object>, ?> constructor)
implements BPFType
Which model struct members as follows:
/**
* Struct member
*
* @param name name of the member
* @param type type of the member
* @param offset offset from the start of the struct in bytes
* @param getter function that takes the struct and returns the member
*/
record BPFStructMember(String name,
BPFType type,
int offset,
Function<?, Object> getter)
With these classes, we can model our data_t struct as follows:
BPFType.BPFStructType DATA_TYPE =
new BPFType.BPFStructType("data_t",
List.of(
new BPFType.BPFStructMember(
"uid",
BPFType.BPFIntType.UINT64,
/* offset */ 0, (Data d) -> d.uid()),
new BPFType.BPFStructMember(
"gid",
BPFType.BPFIntType.UINT64,
8, (Data d) -> d.gid()),
new BPFType.BPFStructMember(
"counter",
BPFType.BPFIntType.UINT32,
16, (Data d) -> d.counter())),
new BPFType.AnnotatedClass(Data.class, List.of()),
objects ->
new Data((long) objects.get(0),
(long) objects.get(1),
(int) objects.get(2)));
This is cumbersome, I know, but it will get easier soon, I promise.
The DATA_TYPE type can then be passed to the BPFTable.HashTable to create the UINT64T_DATA_MAP_PROVIDER:
BPFTable.TableProvider<BPFTable.HashTable<@Unsigned Long, Data>>
UINT64T_DATA_MAP_PROVIDER =
(/* BPF object */ bpf,
/* map id in eBPF */ mapId,
/* file descriptor of the map */ mapFd,
/* name of the map */ name) ->
new BPFTable.HashTable<>(
bpf, mapId, mapFd,
/* key type */ BPFType.BPFIntType.UINT64,
/* value type */ DATA_TYPE,
name);
We use this provider to access the map with BPF#get_table:
public class HelloStructMap {
// ...
public static void main(String[] args)
throws InterruptedException {
try (var b = BPF.builder("""
// ...
""").build()) {
var syscall = b.get_syscall_fnname("execve");
b.attach_kprobe(syscall, "hello");
var counterTable = b.get_table("counter_table",
UINT64T_DATA_MAP_PROVIDER);
while (true) {
Thread.sleep(2000);
for (var value : counterTable.values()) {
System.out.printf(
"ID %d (GID %d): %d\t",
value.uid(), value.gid(),
value.counter());
}
System.out.println();
}
}
}
}
We can run the example and get the additional information:
> ./run.sh own.HelloStructMap
ID 0 (GID 0): 1 ID 1000 (GID 1000): 3
ID 0 (GID 0): 1 ID 1000 (GID 1000): 9
...
ID 0 (GID 0): 1 ID 1000 (GID 1000): 13
ID 0 (GID 0): 5 ID 1000 (GID 1000): 14
> bpftool map dump name counter_table
[{
"key": 0,
"value": {
"uid": 0,
"gid": 0,
"counter": 5
}
},{
"key": 1000,
"value": {
"uid": 1000,
"gid": 1000,
"counter": 13
}
}
]
Granted, it doesn’t give you more insights into the observed system, but it is a showcase of the current state of the map support in hello-ebpf.
Conclusion
eBPF maps are the primary way to communicate information between the eBPF program and the userland application. Hello-ebpf gained with this blog post support for basic eBPF hash maps and the ability to store structures in these maps. But of course, hash maps are not the only type of maps; we’ll add support for other map types, like perf maps and queues, in the next blog posts, as well as making the struct definitions a little bit easier. So stay tuned.
Thanks for joining me on this journey to create a proper Java API for eBPF. Feel free to try the examples for yourself or even write new ones and join the discussions on GitHub. See you in my next blog post.
This article is part of my work in the SapMachine team at SAP, making profiling and debugging easier for everyone. Thanks to Mohammed Aboullaite for answering my many questions.
Please be aware that this blog post uses the discontinued libbcc-based API in hello-ebpf.
eBPF allows you to attach programs directly to hooks in the Linux kernel without loading kernel modules, like hooks for networking or executing programs. This has historically been used for writing custom package filters in firewalls. Still, nowadays, it is used for monitoring and tracing, becoming an ever more critical building block of modern observability tools. To quote from ebpf.io:
Historically, the operating system has always been an ideal place to implement observability, security, and networking functionality due to the kernel’s privileged ability to oversee and control the entire system. At the same time, an operating system kernel is hard to evolve due to its central role and high requirement towards stability and security. The rate of innovation at the operating system level has thus traditionally been lower compared to functionality implemented outside of the operating system.
eBPF changes this formula fundamentally. It allows sandboxed programs to run within the operating system, which means that application developers can run eBPF programs to add additional capabilities to the operating system at runtime. The operating system then guarantees safety and execution efficiency as if natively compiled with the aid of a Just-In-Time (JIT) compiler and verification engine. This has led to a wave of eBPF-based projects covering a wide array of use cases, including next-generation networking, observability, and security functionality.
Today, eBPF is used extensively to drive a wide variety of use cases: Providing high-performance networking and load-balancing in modern data centers and cloud native environments, extracting fine-grained security observability data at low overhead, helping application developers trace applications, providing insights for performance troubleshooting, preventive application and container runtime security enforcement, and much more. The possibilities are endless, and the innovation that eBPF is unlocking has only just begun.
Writing eBPF apps
On the lowest level, eBPF programs are compiled down to eBPF bytecode and attached to hooks in the kernel via a syscall. This is tedious; so many libraries for eBPF allow you to write applications using and interacting with eBPF in C++, Rust, Go, Python, and even Lua.
But there are none for Java, which is a pity. So… I decided to write bindings using the new Foreign Function API (Project Panama, preview in 21) and bcc, the first and widely used library for eBPF, which is typically used with its Python API and allows you to write eBPF programs in C, compiling eBPF programs dynamically at runtime.
Anyway, I’m starting my new blog series and eBPF library hello-ebpf:
Let’s discover eBPF together. Join me on the journey to write all examples from the Learning eBPF book (get it also from Bookshop.org, Amazon, or O’Reilly) by Liz Rice and more in Java, implementing a Java library for eBPF along the way, with a blog series to document the journey. I highly recommend reading the book alongside my articles; for this blog post, I read the book till page 18.
The project is still in its infancy, but I hope that we can eventually extend the overview image from ebpf.io with a duke:
Goals
The main goal is to provide a library (and documentation) for Java developers to explore eBPF and write their own eBPF programs without leaving their favorite language and runtime.
The Python API is just a wrapper around the bcc library using the built-in cffi, which extends the raw bindings to improve usability. The initial implementation of the library is a translation of the Python code to Java 21 code with Panama for FFI.
For example the following method of the Python API
def get_syscall_fnname(self, name):
name = _assert_is_bytes(name)
return self.get_syscall_prefix() + name
is translated into Java as follows:
public String get_syscall_fnname(String fnName) {
return get_syscall_prefix() + fnName;
}
This is the reason why the library has the same license as the Python API, Apache 2.0. The API is purposefully close to the Python API and only deviates where absolutely necessary, adding a few helper methods to improve it slightly. This makes it easier to work with the examples from the book and speeds up the initial development. But finishing a translation of the Python API is not the end goal:
Plans
A look ahead into the future so you know what to expect:
Implement the full API so that we can recreate all bcc examples from the book
Make it adequately available as a library on Maven Central
These plans might change, but I’ll try to keep this current. I’m open to suggestions, contributions, and ideas.
Contributing
Contributions are welcome; just open an issue or a pull request. Discussions take place in the discussions section of the GitHub repository. Please spread the word if you like it; this greatly helps the project.
I’m happy to include more example programs, API documentation, helper methods, and links to repositories and projects that use this library.
Running the first example
The Java library is still in its infancy, but we are already implementing the most basic eBPF program from the book that prints “Hello World!” every time a new program is started via the execve system call:
This helps you track the processes that use execve and lets you observe that Firefox (via MediaSu~isor) creates many processes and see whenever a Z-Shell creates a new process.
public class HelloWorld {
public static void main(String[] args) {
try (BPF b = BPF.builder("""
int hello(void *ctx) {
bpf_trace_printk("Hello, World!");
return 0;
}
""").build()) {
var syscall = b.get_syscall_fnname("execve");
b.attach_kprobe(syscall, "hello");
b.trace_print();
}
}
}
The eBPF program appends a “Hello World” trace message to the /sys/kernel/debug/tracing/trace DebugFS file via bpf_trace_printk everytime the hello method is called. The trace has the following format: “<current task, e.g. zsh>-<process id> [<CPU id the task is running on>] <options> <timestamp>: <appending ebpf method>: <actual message, like 'Hello World'>“. But bpf_trace_printk is slow, it should only be used for debugging purposes.
The Java code attaches the hello method to the execve system call and then prints the lines from the /sys/kernel/debug/tracing/trace file. The program is equivalent to the Python code from the book. But, of course, many features have not yet been implemented and so the programs you can write are quite limited.
Conclusion
eBPF is an integral part of the modern observability tech stack. The hello-ebpf Java library will allow you to write eBPF applications directly in Java for the first time. This is an enormous undertaking for a side project so it will take some time. With my new blog series, you can be part of the journey, learning eBPF and building great tools.
I plan to write a blog post every few weeks and hope you join me. You wouldn’t be the first: Mohammed Aboullaite has already entered and helped me with his eBPF expertise. The voyage will hopefully take us from the first hello world examples shown in this blog post to a fully fledged Java eBPF library.
This article is part of my work in the SapMachine team at SAP, making profiling and debugging easier for everyone. Thank you to Martin Dörr and Lukas Werling who helped in the preparation of this article.
The Foreign Function & Memory API (also called Project Panama) has come a long way since it started. You can find the latest version implemented in JDK 21 as a preview feature (use --enable-preview to enable it) which is specified by the JEP 454:
By efficiently invoking foreign functions (i.e., code outside the JVM), and by safely accessing foreign memory (i.e., memory not managed by the JVM), the API enables Java programs to call native libraries and process native data without the brittleness and danger of JNI.
This is pretty helpful when trying to build wrappers around existing native libraries. Other languages, like Python with ctypes, have had this for a long time, but Java is getting a proper API for native interop, too. Of course, there is the Java Native Interface (JNI), but JNI is cumbersome and inefficient (call-sites aren’t inlined, and the overhead of converting data from Java to the native world and back is huge).
Be aware that the API is still in flux. Much of the existing non-OpenJDK documentation is not in sync.
Example
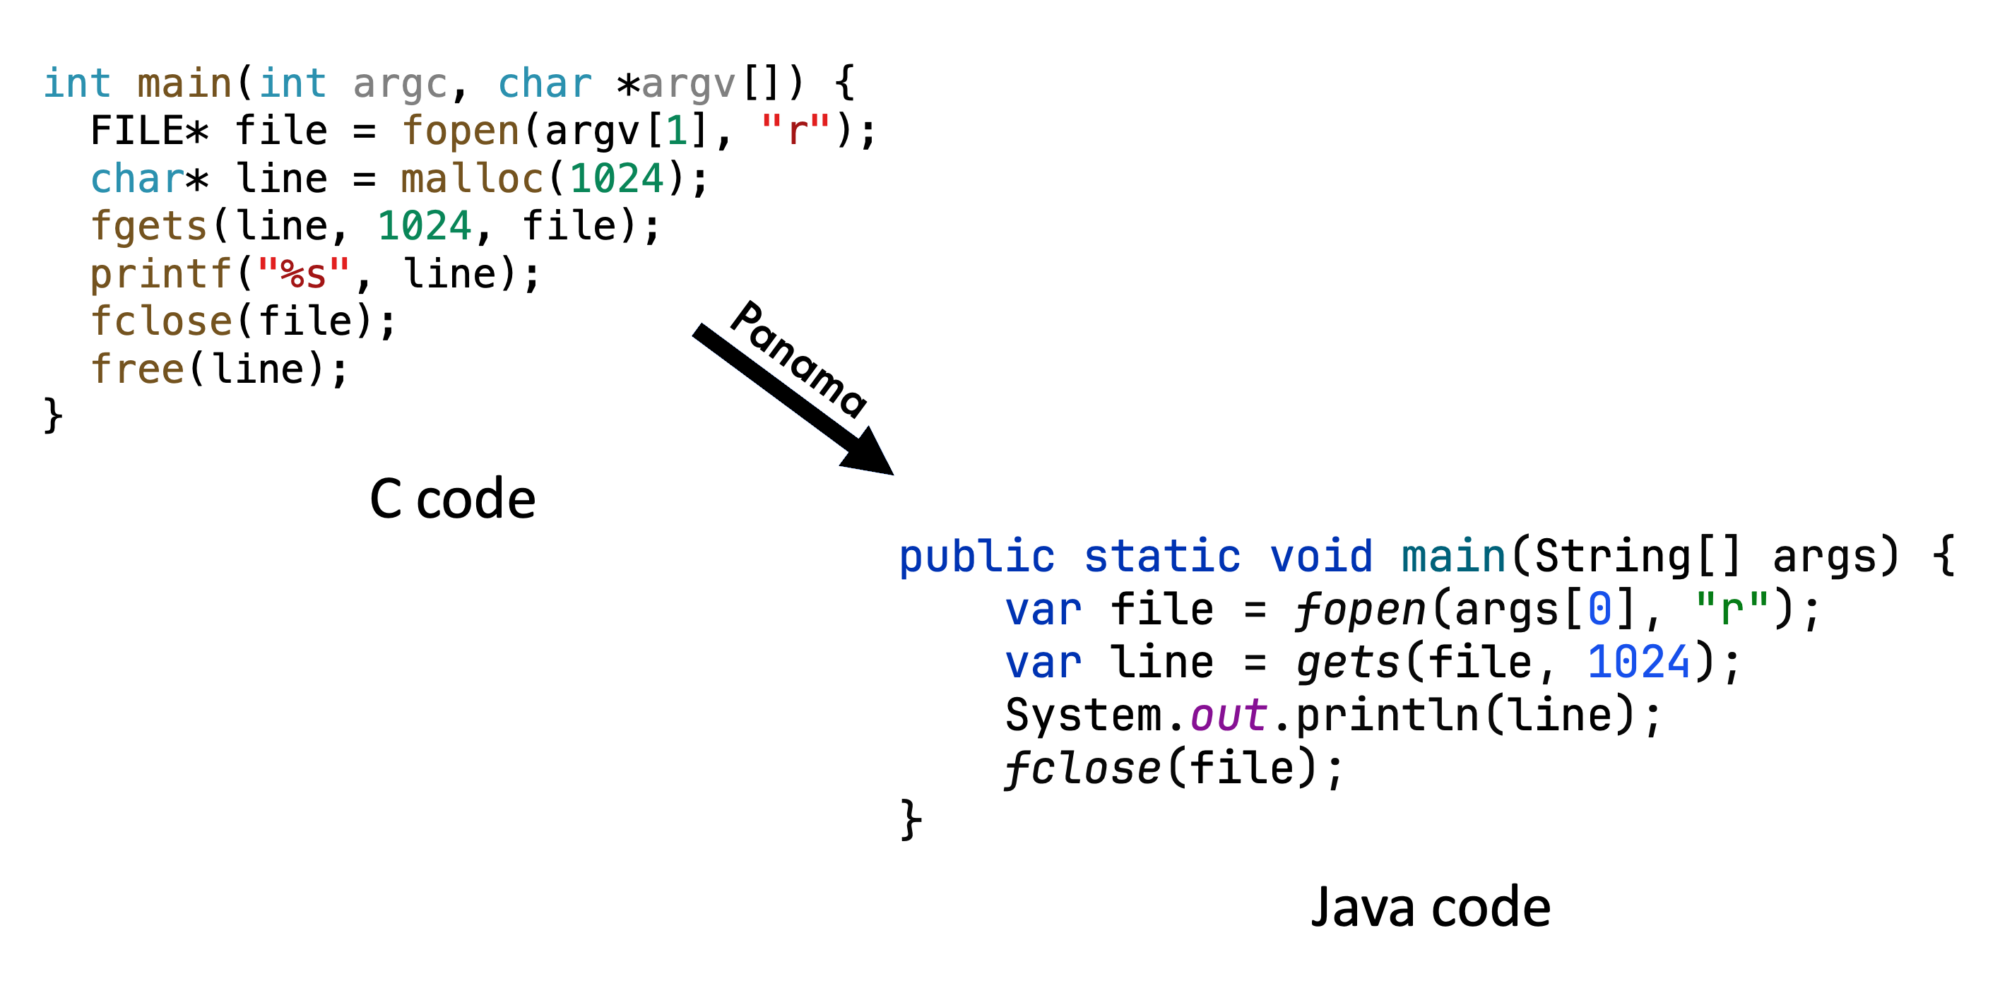
Now to my main example: Assume you’re tired of all the abstraction of the Java I/O API and just want to read a file using the traditional I/O functions of the C standard lib (like read_line.c): we’re trying to read the first line of the passed file, opening the file via fopen, reading the first line via gets, and closing the file via fclose.
This would have involved writing C code in the old JNI days, but we can access the required C functions directly with Panama, wrapping the C functions and writing the C program as follows in Java:
public static void main(String[] args) {
var file = fopen(args[0], "r");
var line = gets(file, 1024);
System.out.println(line);
fclose(file);
}
But do we implement the wrapper methods? We start with the FILE* fopen(char* file, char* mode) function which opens a file. Before we can call it, we have to get hold of its MethodHandle:
This looks up the fopen symbol in all the libraries that the current process has loaded, asking both the NativeLinker and the SymbolLookup. This code is used in many examples, so we move it into the function lookup:
The look-up returns the memory address at which the looked-up function is located.
We can proceed with the address of fopen and use it to create a MethodHandle that calls down from the JVM into native code. For this, we also have to specify the descriptor of the function so that the JVM knows how to call the fopen handle properly.
But how do we use this handle? Every handle has an invokeExact function (and an invoke function that allows the JVM to convert data) that we can use. The only problem is that we want to pass strings to the fopen call. We cannot pass the strings directly but instead have to allocate them onto the C heap, copying the chars into a C string:
In JDK 22 allocateUtf8String changes to allocateFrom (thanks Brice Dutheil for spotting this).
We use a confined arena for allocations, which is cleaned after exiting the try-catch. The newly allocated strings are then used to invoke fopen, letting us return the FILE*.
Older tutorials might mention MemorySessions, but they are removed in JDK 21.
After opening the file, we can focus on the char* fgets(char* buffer, int size, FILE* file) function. This function is passed a buffer of a given size, storing the next line from the passed file in the buffer.
Only the wrapper method differs because we have to allocate the buffer in the arena:
public static String gets(MemorySegment file, int size) {
try (var arena = Arena.ofConfined()) {
var buffer = arena.allocateArray(ValueLayout.JAVA_BYTE, size);
var ret = (MemorySegment) fgets.invokeExact(buffer, size, file);
if (ret == MemorySegment.NULL) {
return null; // error
}
return buffer.getUtf8String(0);
} catch (Throwable t) {
throw new RuntimeException(t);
}
}
Finally, we can implement the int fclose(FILE* file) function to close the file:
private static MethodHandle fclose = Linker.nativeLinker().downcallHandle(
PanamaUtil.lookup("fclose"),
FunctionDescriptor.of(ValueLayout.JAVA_INT, ValueLayout.ADDRESS));
public static int fclose(MemorySegment file) {
try {
return (int) fclose.invokeExact(file);
} catch (Throwable e) {
throw new RuntimeException(e);
}
}
You can find the source code in my panama-examples repository on GitHub (file HelloWorld.java) and run it on a Linux x86_64 machine via
> ./run.sh HelloWorld LICENSE # build and run
Apache License
which prints the first line of the license file.
Errno
We didn’t care much about error handling here, but sometimes, we want to know precisely why a C function failed. Luckily, the C standard library on Linux and other Unixes has errno:
Several standard library functions indicate errors by writing positive integers to errno.
On error, fopen returns a null pointer and sets errno. You can find information on all the possible error numbers on the man page for the open function.
We only have to have a way to obtain the errno directly after a call, we have to capture the call state and declare the capture-call-state option in the creation of the MethodHandle for fopen:
try (var arena = Arena.ofConfined()) {
// declare the errno as state to be captured,
// directly after the downcall without any interence of the
// JVM runtime
StructLayout capturedStateLayout = Linker.Option.captureStateLayout();
VarHandle errnoHandle =
capturedStateLayout.varHandle(
MemoryLayout.PathElement.groupElement("errno"));
Linker.Option ccs = Linker.Option.captureCallState("errno");
MethodHandle fopen = Linker.nativeLinker().downcallHandle(
lookup("fopen"),
FunctionDescriptor.of(POINTER, POINTER, POINTER),
ccs);
MemorySegment capturedState = arena.allocate(capturedStateLayout);
try {
// reading a non-existent file, this will set the errno
MemorySegment result =
(MemorySegment) fopen.invoke(capturedState,
// for our example we pick a file that doesn't exist
// this ensures a proper error number
arena.allocateUtf8String("nonexistent_file"),
arena.allocateUtf8String("r"));
int errno = (int) errnoHandle.get(capturedState);
System.out.println(errno);
return result;
} catch (Throwable e) {
throw new RuntimeException(e);
}
}
// returned char* require this specific type
static AddressLayout POINTER =
ValueLayout.ADDRESS.withTargetLayout(
MemoryLayout.sequenceLayout(JAVA_BYTE));
static MethodHandle strerror = Linker.nativeLinker()
.downcallHandle(lookup("strerror"),
FunctionDescriptor.of(POINTER,
ValueLayout.JAVA_INT));
static String errnoString(int errno){
try {
MemorySegment str =
(MemorySegment) strerror.invokeExact(errno);
return str.getUtf8String(0);
} catch (Throwable t) {
throw new RuntimeException(t);
}
}
When we then print the error string in our example after the fopen call, we get:
No such file or directory
This is as expected, as we hard-coded a non-existent file in the fopen call.
JExtract
Creating all the MethodHandles manually can be pretty tedious and error-prone. JExtract can parse header files, generating MethodHandles and more automatically. You can download jextract on the project page.
For our example, I wrote a small wrapper around jextract that automatically downloads the latest version and calls it on the misc/headers.h file to create MethodHandles in the class Lib. The headers file includes all the necessary headers to run examples:
Of course, we still have to take care of the string allocation in our wrapper, but this wrapper gets significantly smaller:
public static MemorySegment fopen(String filename, String mode) {
try (var arena = Arena.ofConfined()) {
// using the MethodHandle that has been generated
// by jextract
return Lib.fopen(
arena.allocateUtf8String(filename),
arena.allocateUtf8String(mode));
}
}
You can find the example code in the GitHub repository in the file HelloWorldJExtract.java. I integrated jextract via a wrapper directly into the Maven build process, so just mvn package to run the tool.
More Information
There are many other resources on Project Panama, but be aware that they might be dated. Therefore, I recommend reading JEP 454, which describes the newly introduced API in great detail. Additionally, the talk “The Panama Dojo: Black Belt Programming with Java 21 and the FFM API” by Per Minborg at this year’s Devoxx Belgium is a great introduction:
As well as the talk by Maurizio Cimadamore at this year’s JVMLS:
Conclusion
Project Panama greatly simplifies interfacing with existing native libraries. I hope it will gain traction after leaving the preview state with the upcoming JDK 22, but it should already be stable enough for small experiments and side projects.
I hope my introduction gave you a glimpse into Panama; as always, I’m happy for any comments, and I’ll see you next week(ish) for the start of a new blog series.
This article is part of my work in the SapMachine team at SAP, making profiling and debugging easier for everyone. Thank you to my colleague Martin Dörr, who helped me with Panama and ported Panama to PowerPC.
Or: I just released version 0.0.11 with a cool new feature that I can’t wait to tell you about…
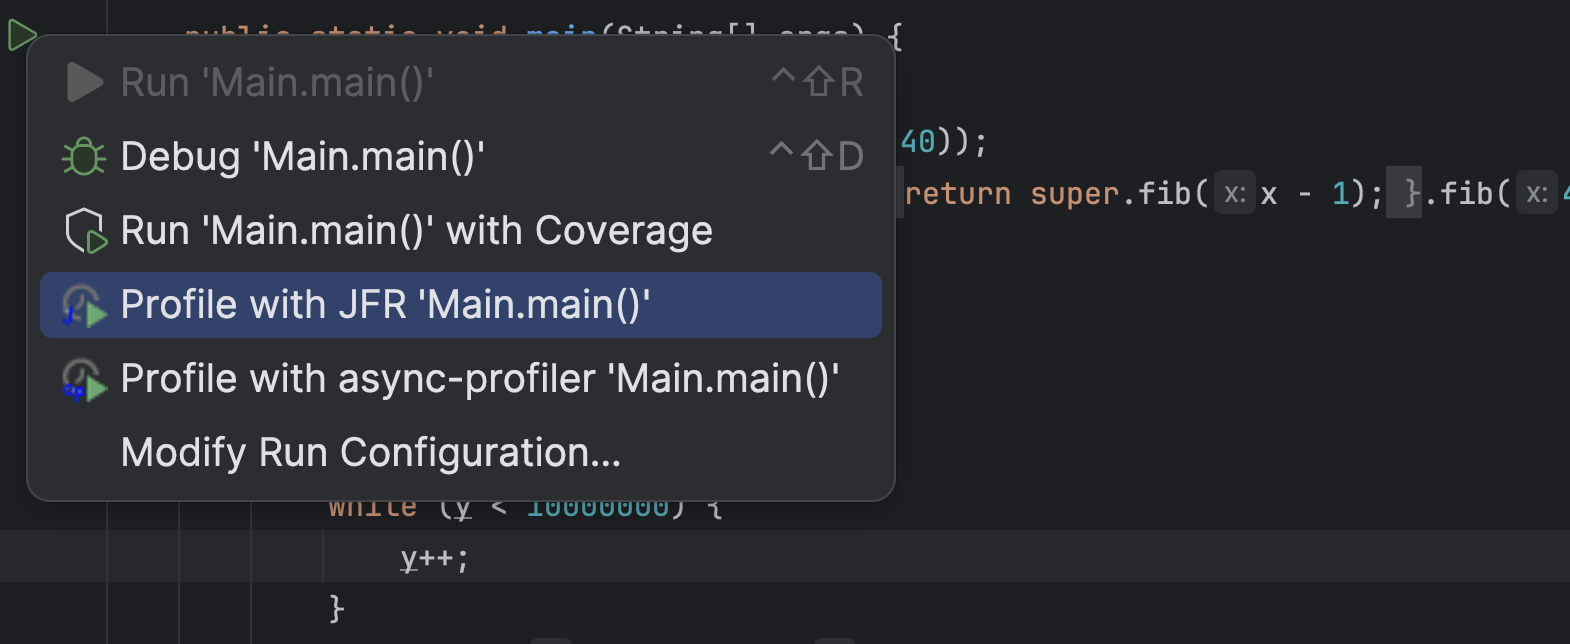
According to the recent JetBrains survey, most people use Maven as their build system and build Spring Boot applications with Java. Yet my profiling plugin for IntelliJ only supports profiling pure Java run configuration. Configurations where the JVM gets passed the main class to run. This is great for tiny examples where you directly right-click on the main method and profile the whole application using the context menu:
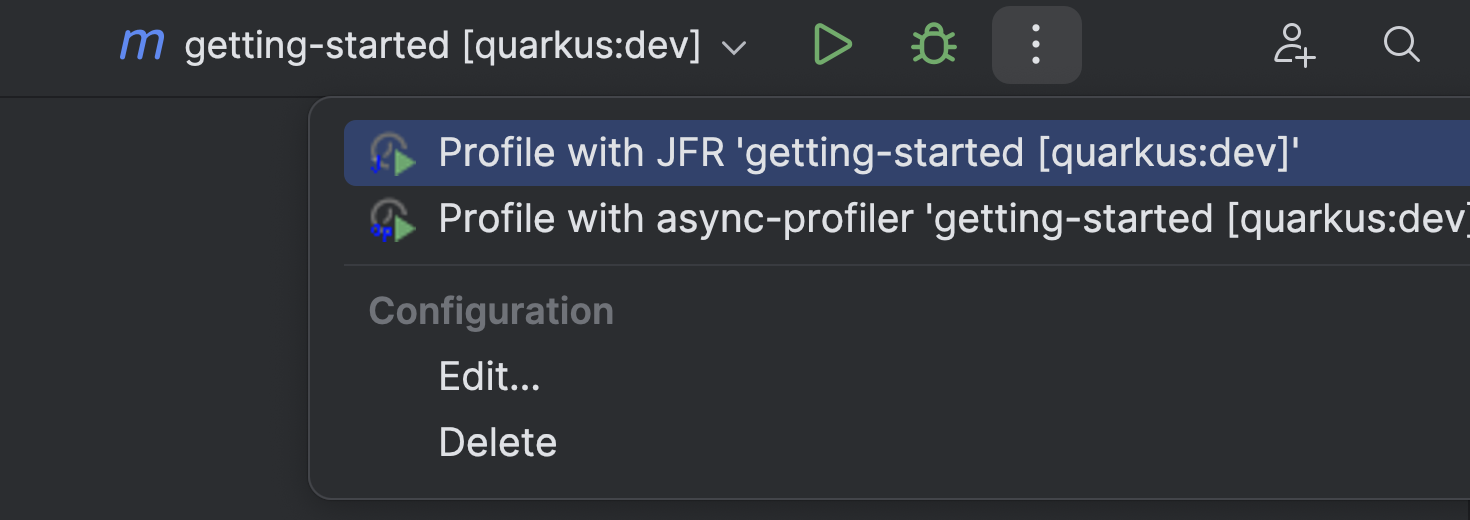
But this is not great when you’re using the Maven build system and usually run your application using the exec goal, or, god forbid, use Spring Boot or Quarkus-related goals. Support for these goals has been requested multiple times, and last week, I came around to implementing it (while also two other bugs). So now you can profile your Spring Boot, like the Spring pet-clinic, application running with spring-boot:run:
Giving you a profile like:
Or your Quarkus application running with quarkus:dev:
Giving you a profile like:
This works specifically by using the options of these goals, which allows the profiler plugin to pass profiling-specific JVM options. If the plugin doesn’t detect a directly supported plugin, it passes the JVM options via the MAVEN_OPTS environment variable. This should work with the exec goals and others.
Gradle script support has also been requested, but despite searching the whole internet till the night, I didn’t find any way to add JVM options to the JVM that Gradle runs for the Spring Boot or run tasks without modifying the build.gradle file itself (see Baeldung).
I left when it was dark and rode out into the night with my bike. Visiting other lost souls in the pursuit of sweet potato curry.
Only Quarku’s quarkusDev task has the proper options so that I can pass the JVM options. So, for now, I only have basic Quarkus support but nothing else. Maybe one of my readers knows how I could still provide profiling support for non-Quarkus projects.
You can configure the options that the plugin uses for specific task prefixes yourself in the .profileconfig.json file:
{
"additionalGradleTargets": [
{
// example for Quarkus
"targetPrefix": "quarkus",
"optionForVmArgs": "-Djvm.args",
"description": "Example quarkus config, adding profiling arguments via -Djvm.args option to the Gradle task run"
}
],
"additionalMavenTargets": [
{ // example for Quarkus
"targetPrefix": "quarkus:",
"optionForVmArgs": "-Djvm.args",
"description": "Example quarkus config, adding profiling arguments via -Djvm.args option to the Maven goal run"
}
]
}
This update has been the first one with new features since April. The new features should make life easier for profiling both real-world and toy applications. If you have any other feature requests, feel free to create an issue on GitHub and, ideally, try to create a pull request. I’m happy to help you get started.
See you next week on some topics I have not yet decided on. I have far more ideas than time…
This article is part of my work in the SapMachine team at SAP, making profiling and debugging easier for everyone. Thanks to the issue reporters and all the other people who tried my plugin.
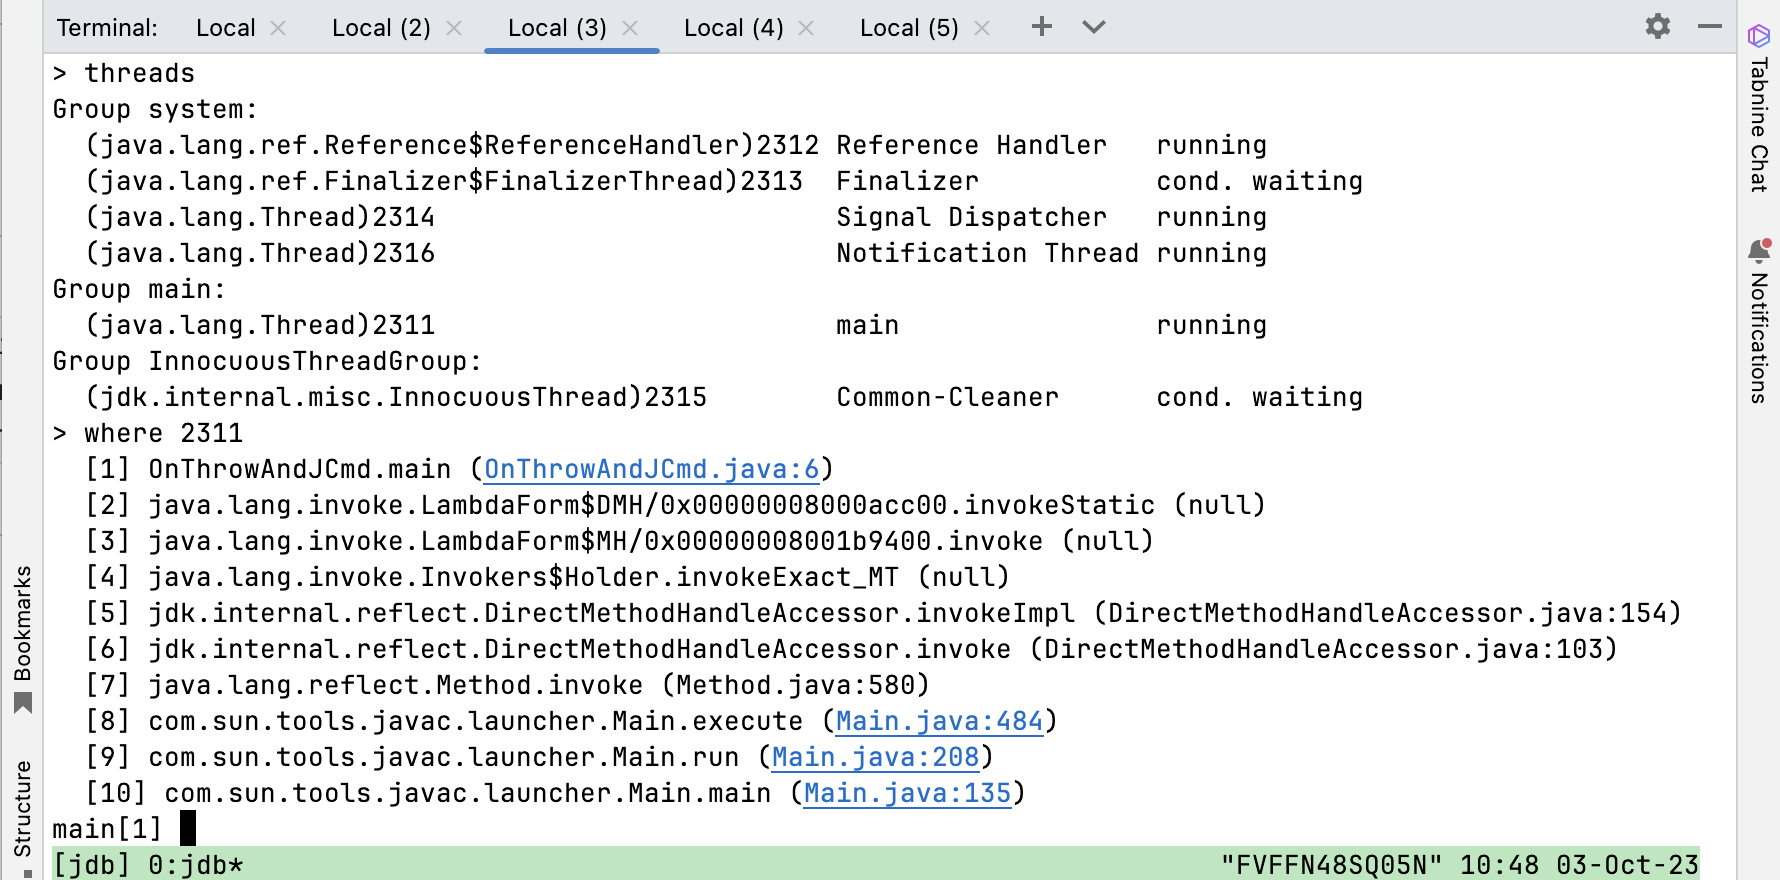
Another blog post in which I use sys.settrace. This time to solve a real problem.
When working with new modules, it is sometimes beneficial to get a glimpse of which entities of a module are actually used. I wrote something comparable in my blog post Instrumenting Java Code to Find and Handle Unused Classes, but this time, I need it in Python and with method-level granularity.
TL;DR
Download trace.py from GitHub and use it to print a call tree and a list of used methods and classes to the error output:
This could be a hard problem, but it isn’t when we’re using sys.settrace to set a handler for every method and function call, reapplying the knowledge we gained in my Let’s create a debugger together series to develop a small utility.
There are essentially six different types of functions (this sample code is on GitHub):
def log(message: str):
print(message)
class TestClass:
# static initializer of the class
x = 100
def __init__(self):
# constructor
log("instance initializer")
def instance_method(self):
# instance method, self is bound to an instance
log("instance method")
@staticmethod
def static_method():
log("static method")
@classmethod
def class_method(cls):
log("class method")
def free_function():
log("free function")
This is important because we have to handle them differently in the following. But first, let’s define a few helpers and configuration variables:
We also want to print a method call-tree, so we use indent to track the current indentation level. The module_matcher is the regular expression that we use to determine whether we want to consider a module, its classes, and methods. This could, e.g., be __main__ to only consider the main module. The print_location tells us whether we want to print the path and line location for every element in the call tree.
Now to the main helper class:
def log(message: str):
print(message, file=sys.stderr)
STATIC_INIT = "<static init>"
@dataclass
class ClassInfo:
""" Used methods of a class """
name: str
used_methods: Set[str] = field(default_factory=set)
def print(self, indent_: str):
log(indent_ + self.name)
for method in sorted(self.used_methods):
log(indent_ + " " + method)
def has_only_static_init(self) -> bool:
return (
len(self.used_methods) == 1 and
self.used_methods.pop() == STATIC_INIT)
used_classes: Dict[str, ClassInfo] = {}
free_functions: Set[str] = set()
The ClassInfo stores the used methods of a class. We store the ClassInfo instances of used classes and the free function in global variables.
Now to the our call handler that we pass to sys.settrace:
def handler(frame: FrameType, event: str, *args):
""" Trace handler that prints and tracks called functions """
# find module name
module_name: str = mod.__name__ if (
mod := inspect.getmodule(frame.f_code)) else ""
# get name of the code object
func_name = frame.f_code.co_name
# check that the module matches the define regexp
if not re.match(module_matcher, module_name):
return
# keep indent in sync
# this is the only reason why we need
# the return events and use an inner trace handler
global indent
if event == 'return':
indent -= 2
return
if event != "call":
return
# insert the current function/method
name = insert_class_or_function(module_name, func_name, frame)
# print the current location if neccessary
if print_location:
do_print_location(frame)
# print the current function/method
log(" " * indent + name)
# keep the indent in sync
indent += 2
# return this as the inner handler to get
# return events
return handler
def setup(module_matcher_: str = ".*", print_location_: bool = False):
# ...
sys.settrace(handler)
Now, we “only” have to get the name for the code object and collect it properly in either a ClassInfo instance or the set of free functions. The base case is easy: When the current frame contains a local variable self, we probably have an instance method, and when it contains a cls variable, we have a class method.
def insert_class_or_function(module_name: str, func_name: str,
frame: FrameType) -> str:
""" Insert the code object and return the name to print """
if "self" in frame.f_locals or "cls" in frame.f_locals:
return insert_class_or_instance_function(module_name,
func_name, frame)
# ...
def insert_class_or_instance_function(module_name: str,
func_name: str,
frame: FrameType) -> str:
"""
Insert the code object of an instance or class function and
return the name to print
"""
class_name = ""
if "self" in frame.f_locals:
# instance methods
class_name = frame.f_locals["self"].__class__.__name__
elif "cls" in frame.f_locals:
# class method
class_name = frame.f_locals["cls"].__name__
# we prefix the class method name with "<class>"
func_name = "<class>" + func_name
# add the module name to class name
class_name = module_name + "." + class_name
get_class_info(class_name).used_methods.add(func_name)
used_classes[class_name].used_methods.add(func_name)
# return the string to print in the class tree
return class_name + "." + func_name
But how about the other three cases? We use the header line of a method to distinguish between them:
class StaticFunctionType(Enum):
INIT = 1
""" static init """
STATIC = 2
""" static function """
FREE = 3
""" free function, not related to a class """
def get_static_type(code: CodeType) -> StaticFunctionType:
file_lines = Path(code.co_filename).read_text().split("\n")
line = code.co_firstlineno
header_line = file_lines[line - 1]
if "class " in header_line:
# e.g. "class TestClass"
return StaticFunctionType.INIT
if "@staticmethod" in header_line:
return StaticFunctionType.STATIC
return StaticFunctionType.FREE
These are, of course, just approximations, but they work well enough for a small utility used for exploration.
If you know any other way that doesn’t involve using the Python AST, feel free to post in a comment below.
Using the get_static_type function, we can now finish the insert_class_or_function function:
def insert_class_or_function(module_name: str, func_name: str,
frame: FrameType) -> str:
""" Insert the code object and return the name to print """
if "self" in frame.f_locals or "cls" in frame.f_locals:
return insert_class_or_instance_function(module_name,
func_name, frame)
# get the type of the current code object
t = get_static_type(frame.f_code)
if t == StaticFunctionType.INIT:
# static initializer, the top level class code
# func_name is actually the class name here,
# but classes are technically also callable function
# objects
class_name = module_name + "." + func_name
get_class_info(class_name).used_methods.add(STATIC_INIT)
return class_name + "." + STATIC_INIT
elif t == StaticFunctionType.STATIC:
# @staticmethod
# the qualname is in our example TestClass.static_method,
# so we have to drop the last part of the name to get
# the class name
class_name = module_name + "." + frame.f_code.co_qualname[
:-len(func_name) - 1]
# we prefix static class names with "<static>"
func_name = "<static>" + func_name
get_class_info(class_name).used_methods.add(func_name)
return class_name + "." + func_name
free_functions.add(frame.f_code.co_name)
return module_name + "." + func_name
Our utility library then prints the following upon execution:
standard error:
__main__.TestClass.<static init>
__main__.all_methods
__main__.log
__main__.TestClass.__init__
__main__.log
__main__.TestClass.instance_method
__main__.log
__main__.TestClass.<static>static_method
__main__.log
__main__.TestClass.<class>class_method
__main__.log
__main__.free_function
__main__.log
********** Trace Results **********
Used classes:
only static init:
not only static init:
__main__.TestClass
<class>class_method
<static init>
<static>static_method
__init__
instance_method
Free functions:
all_methods
free_function
log
standard output:
all methods
instance initializer
instance method
static method
class method
free function
Conclusion
This small utility uses the power of sys.settrace (and some string processing) to find a module’s used classes, methods, and functions and the call tree. The utility is pretty helpful when trying to grasp the inner structure of a module and the module entities used transitively by your own application code.
I published this code under the MIT license on GitHub, so feel free to improve, extend, and modify it. Come back in a few weeks to see why I actually developed this utility…
This article is part of my work in the SapMachine team at SAP, making profiling and debugging easier for everyone.
A small addendum to the previous five parts of my journey down the Python debugger rabbit hole (part 1, part 2, part 3, part 4, and part 5).
I gave a talk on this topic, based on my blog posts, at PyData Karlsruhe:
You can find all the source code of the demos here. It was a great pleasure giving this talk, and the audience received it well.
This might be the end of my journey into Python debuggers, but I feel some untold topics are out there. So, if you have any ideas, feel free to comment. See you in my next blog post and possibly at the next Python conference that accepts my talk proposal.
The presentation was part of my work in the SapMachine team at SAP, making profiling and debugging easier for everyone.
A small addendum to the previous four parts of my journey down the Python debugger rabbit hole (part 1, part 2, part 3, and part 4).
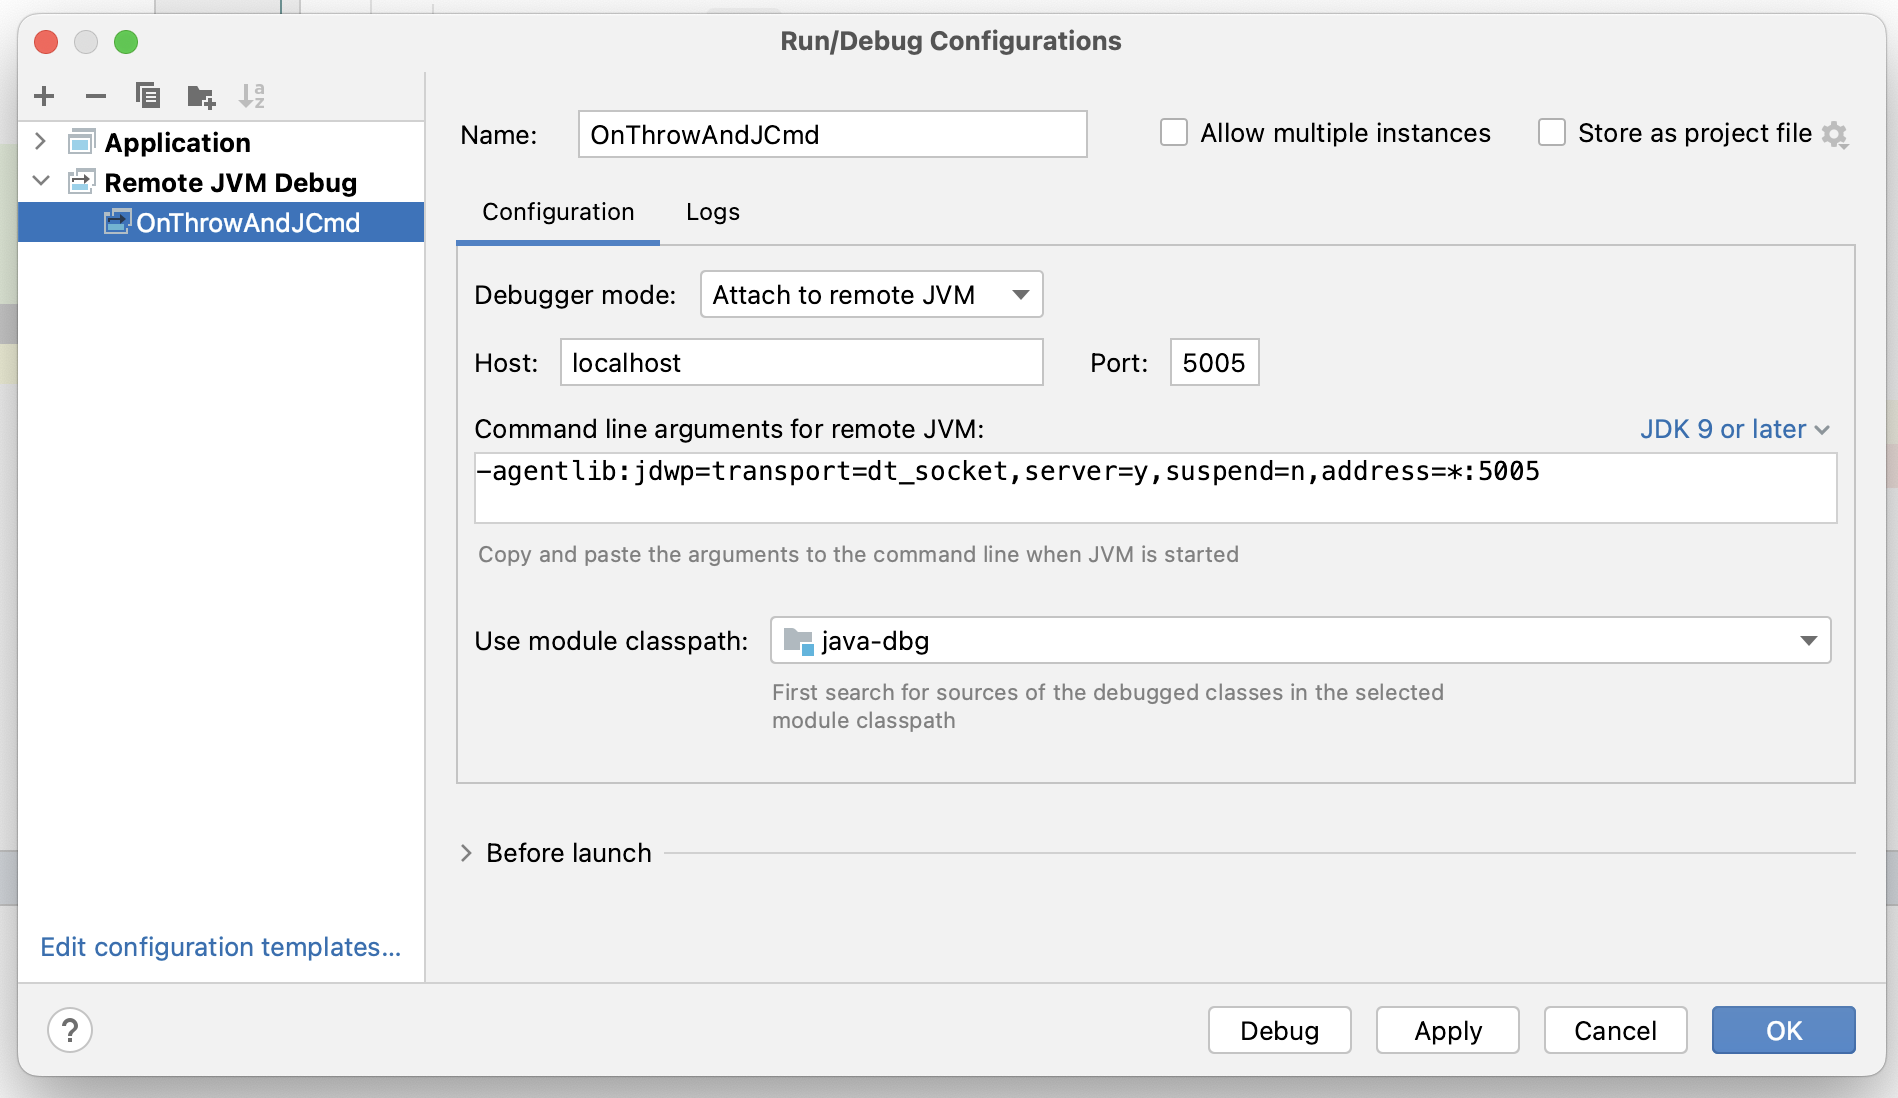
I tried the debugger I finished last week on a small sample application for my upcoming talk at the PyData Südwest meet-up, and it failed. The problem is related to running the file passed to the debugger. Consider that we debug the following program:
def main():
print("Hi")
if __name__ == "__main__":
main()
We now set the breakpoint in the main method when starting the debugger and continuing with the execution of the program. The problem: It never hits the breakpoint. But why? Because it never calls the main method.
The cause of this problem is that the __name__ variable is set to dbg2.py (the file containing the code is compiling and running the script). But how do we run the script? We use the following (based on a Real Python article):
_globals = globals().copy()
# ...
class Dbg:
# ...
def run(self, file: Path):
""" Run a given file with the debugger """
self._main_file = file
# see https://realpython.com/python-exec/#using-python-for-configuration-files
compiled = compile(file.read_text(), filename=str(file), mode='exec')
sys.argv.pop(0)
sys.breakpointhook = self._breakpoint
self._process_compiled_code(compiled)
exec(compiled, _globals)
This code uses the compile method to compile the code, telling this method that the file belongs to the program file.
The mode argument specifies what kind of code must be compiled; it can be 'exec' if source consists of a sequence of statements, 'eval' if it consists of a single expression, or 'single' if it consists of a single interactive statement (in the latter case, expression statements that evaluate to something other than None will be printed).
We then remove the first argument of the program because it is the debugged file in the case of the debugger and run some post-processing on the compiled code object. This is the reason why we can’t just use eval. Finally, we use exec to execute the compiled code with the global variables that we had before creating the Dbg class and others.
The problem is that exec it doesn’t set the import-related module attributes, such as __name__ and __file__ properly. So we have to emulate these by adding global variables:
It makes of course sense that exec behaves this way, as it is normally used to evaluate code in the current context.
With this now fixed, it is possible to debug normal applications like the line counter that I use in my upcoming talk at the 16th November in Karlsruhe.
I hope you liked this short addendum and see you next time with a blog post on something more Java-related.
The fourth part of my journey down the Python debugger rabbit hole (part 1, part 2, and part 3).
In this article, we’ll be looking into how changes introduced in Python 3.12 can help us with one of the most significant pain points of our current debugger implementation: The Python interpreter essentially calls our callback at every line of code, regardless if we have a breakpoint in the currently running method. But why is this the case?
This is the necessary third part of my journey down the Python debugger rabbit hole; if you’re new to the series, please take a look at part 1 and part 2 first.
I promised in the last part of this series that I’ll show you how to use the new Python APIs. However, some code refactoring is necessary before I can finally proceed. The implementation in dbg.py mixes the sys.settrace related code and code that can be reused for other debugging implementations. So, this is a short blog post covering the result of the refactoring. The code can be found in dbg2.py.
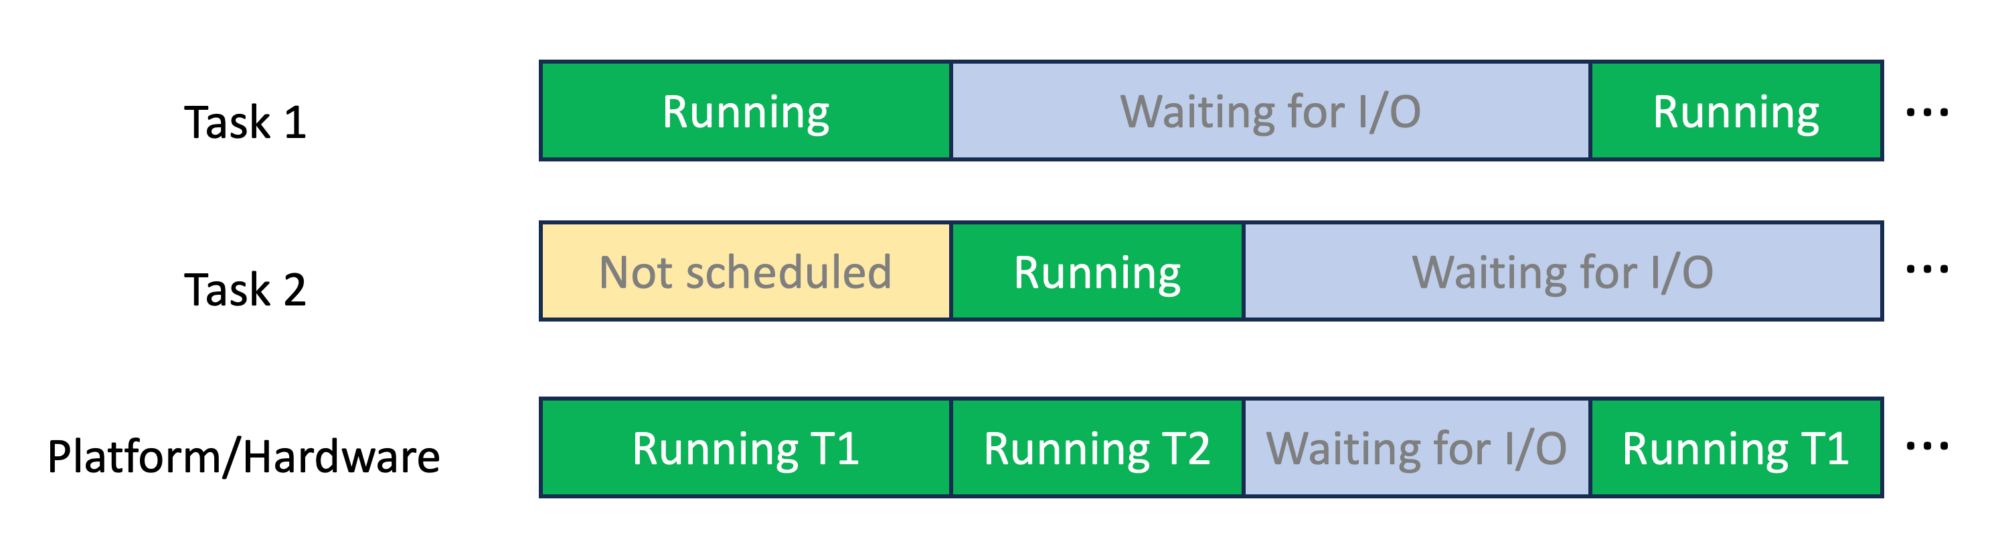
Both try to utilize a computation resource fully, be it hardware core or platform thread, by multiplexing multiple tasks onto it, despite many tasks waiting regularly for IO operations to complete:
When one task waits, another can be scheduled, improving overall throughput. This works especially well when longer IO operations follow short bursts of computation.
There are, of course, differences between the two, most notably: HyperThreading doesn’t need the tasks to cooperate, as Loom does, so a virtual core can’t starve other virtual cores. Also noteworthy is that the scheduler for Hyper-Threading is implemented in silicon and cannot be configured or even changed, while the virtual thread execution can be targeted to one’s needs.
I hope you found this small insight helpful in understanding virtual threads and putting them into context. You can find more about these topics in resources like JEP 444 (Virtual Threads) and the “Hyper-Threading Technology Architecture and Microarchitecture” paper.
This article is part of my work in the SapMachine team at SAP, making profiling and debugging easier for everyone.
Have you ever wanted to bring your JFR events into context? Adding information on sessions, user IDs, and more can improve your ability to make sense of all the events in your profile. Currently, we can only add context by creating custom JFR events, as I presented in my Profiling Talks:
We can use these custom events (see Custom JFR Events: A Short Introduction and Custom Events in the Blocky World: Using JFR in Minecraft) to store away the information and later relate them to all the other events by using the event’s time, duration, and thread. This works out-of-the-box but has one major problem: Relating events is quite fuzzy, as time stamps are not as accurate (see JFR Timestamps and System.nanoTime), and we do all of this in post-processing.
But couldn’t we just attach some context to every JFR event we’re interested in? Not yet, but Jaroslav Bachorik from DataDog is working on it. Recently, he wrote three blog posts (1, 2, 3). The following is a different take on his idea, showing how to use it in a small file server example.
The main idea of Jaroslav’s approach is to store a context in thread-local memory and attach it to every JFR event as configured. But before I dive into the custom context, I want to show you the example program, which you can find, as always, MIT-licensed on GitHub.
Example
We create a simple file server via Javalin, which allows a user to
Register (URL schema register/{user})
Store data in a file (store/{user}/{file}/{content})
Retrieve file content (load/{user}/{file})
Delete files (delete/{user}/{file})
The URLs are simple to use, and we don’t bother about error handling, user authentication, or large files, as this would complicate our example. I leave it as an exercise for the inclined reader. The following is the most essential part of the application: the server declaration:
This example runs on Jaroslav’s OpenJDK fork (commit 6ea2b4f), so if you want to run it in its complete form, please build the fork and make sure that you’re PATH and JAVA_HOME environment variables are set accordingly.
You can build the server using mvn package and start it, listening on the port 1000, via:
java -jar target/jfr-context-example.jar 1000
You can then use it via your browser or curl:
# start the server
java -XX:StartFlightRecording=filename=flight.jfr,settings=config.jfc \
-jar target/jfr-context-example.jar 1000 &
pid=$!
# register a user
curl http://localhost:1000/register/moe
# store a file
curl http://localhost:1000/store/moe/hello_file/Hello
# load the file
curl http://localhost:1000/load/moe/hello_file
-> Hello
# delete the file
curl http://localhost:1000/delete/moe/hello_file
kill $pid
# this results in the flight.jfr file
To make testing easier, I created the test.sh script, which starts the server, registers a few users and stores, loads, and deletes a few files, creating a JFR file along the way. We're using a custom JFR configuration to enable the IO events without any threshold. This is not recommended for production but is required in our toy example to get any such event: